thomas.shaffer@LIGO.ORG - posted 15:41, Thursday 24 July 2025 (85970)
Lock loss 2237 UTC
Ending a 21 hour lock. No obvious cause, lock loss tool analyzing.
Ending a 21 hour lock. No obvious cause, lock loss tool analyzing.
FAMIS 26053, last checked in alog85829
The script reports BSC high frequency noise is elevated for the following sensors:
ITMY_ST1_CPSINF_H3
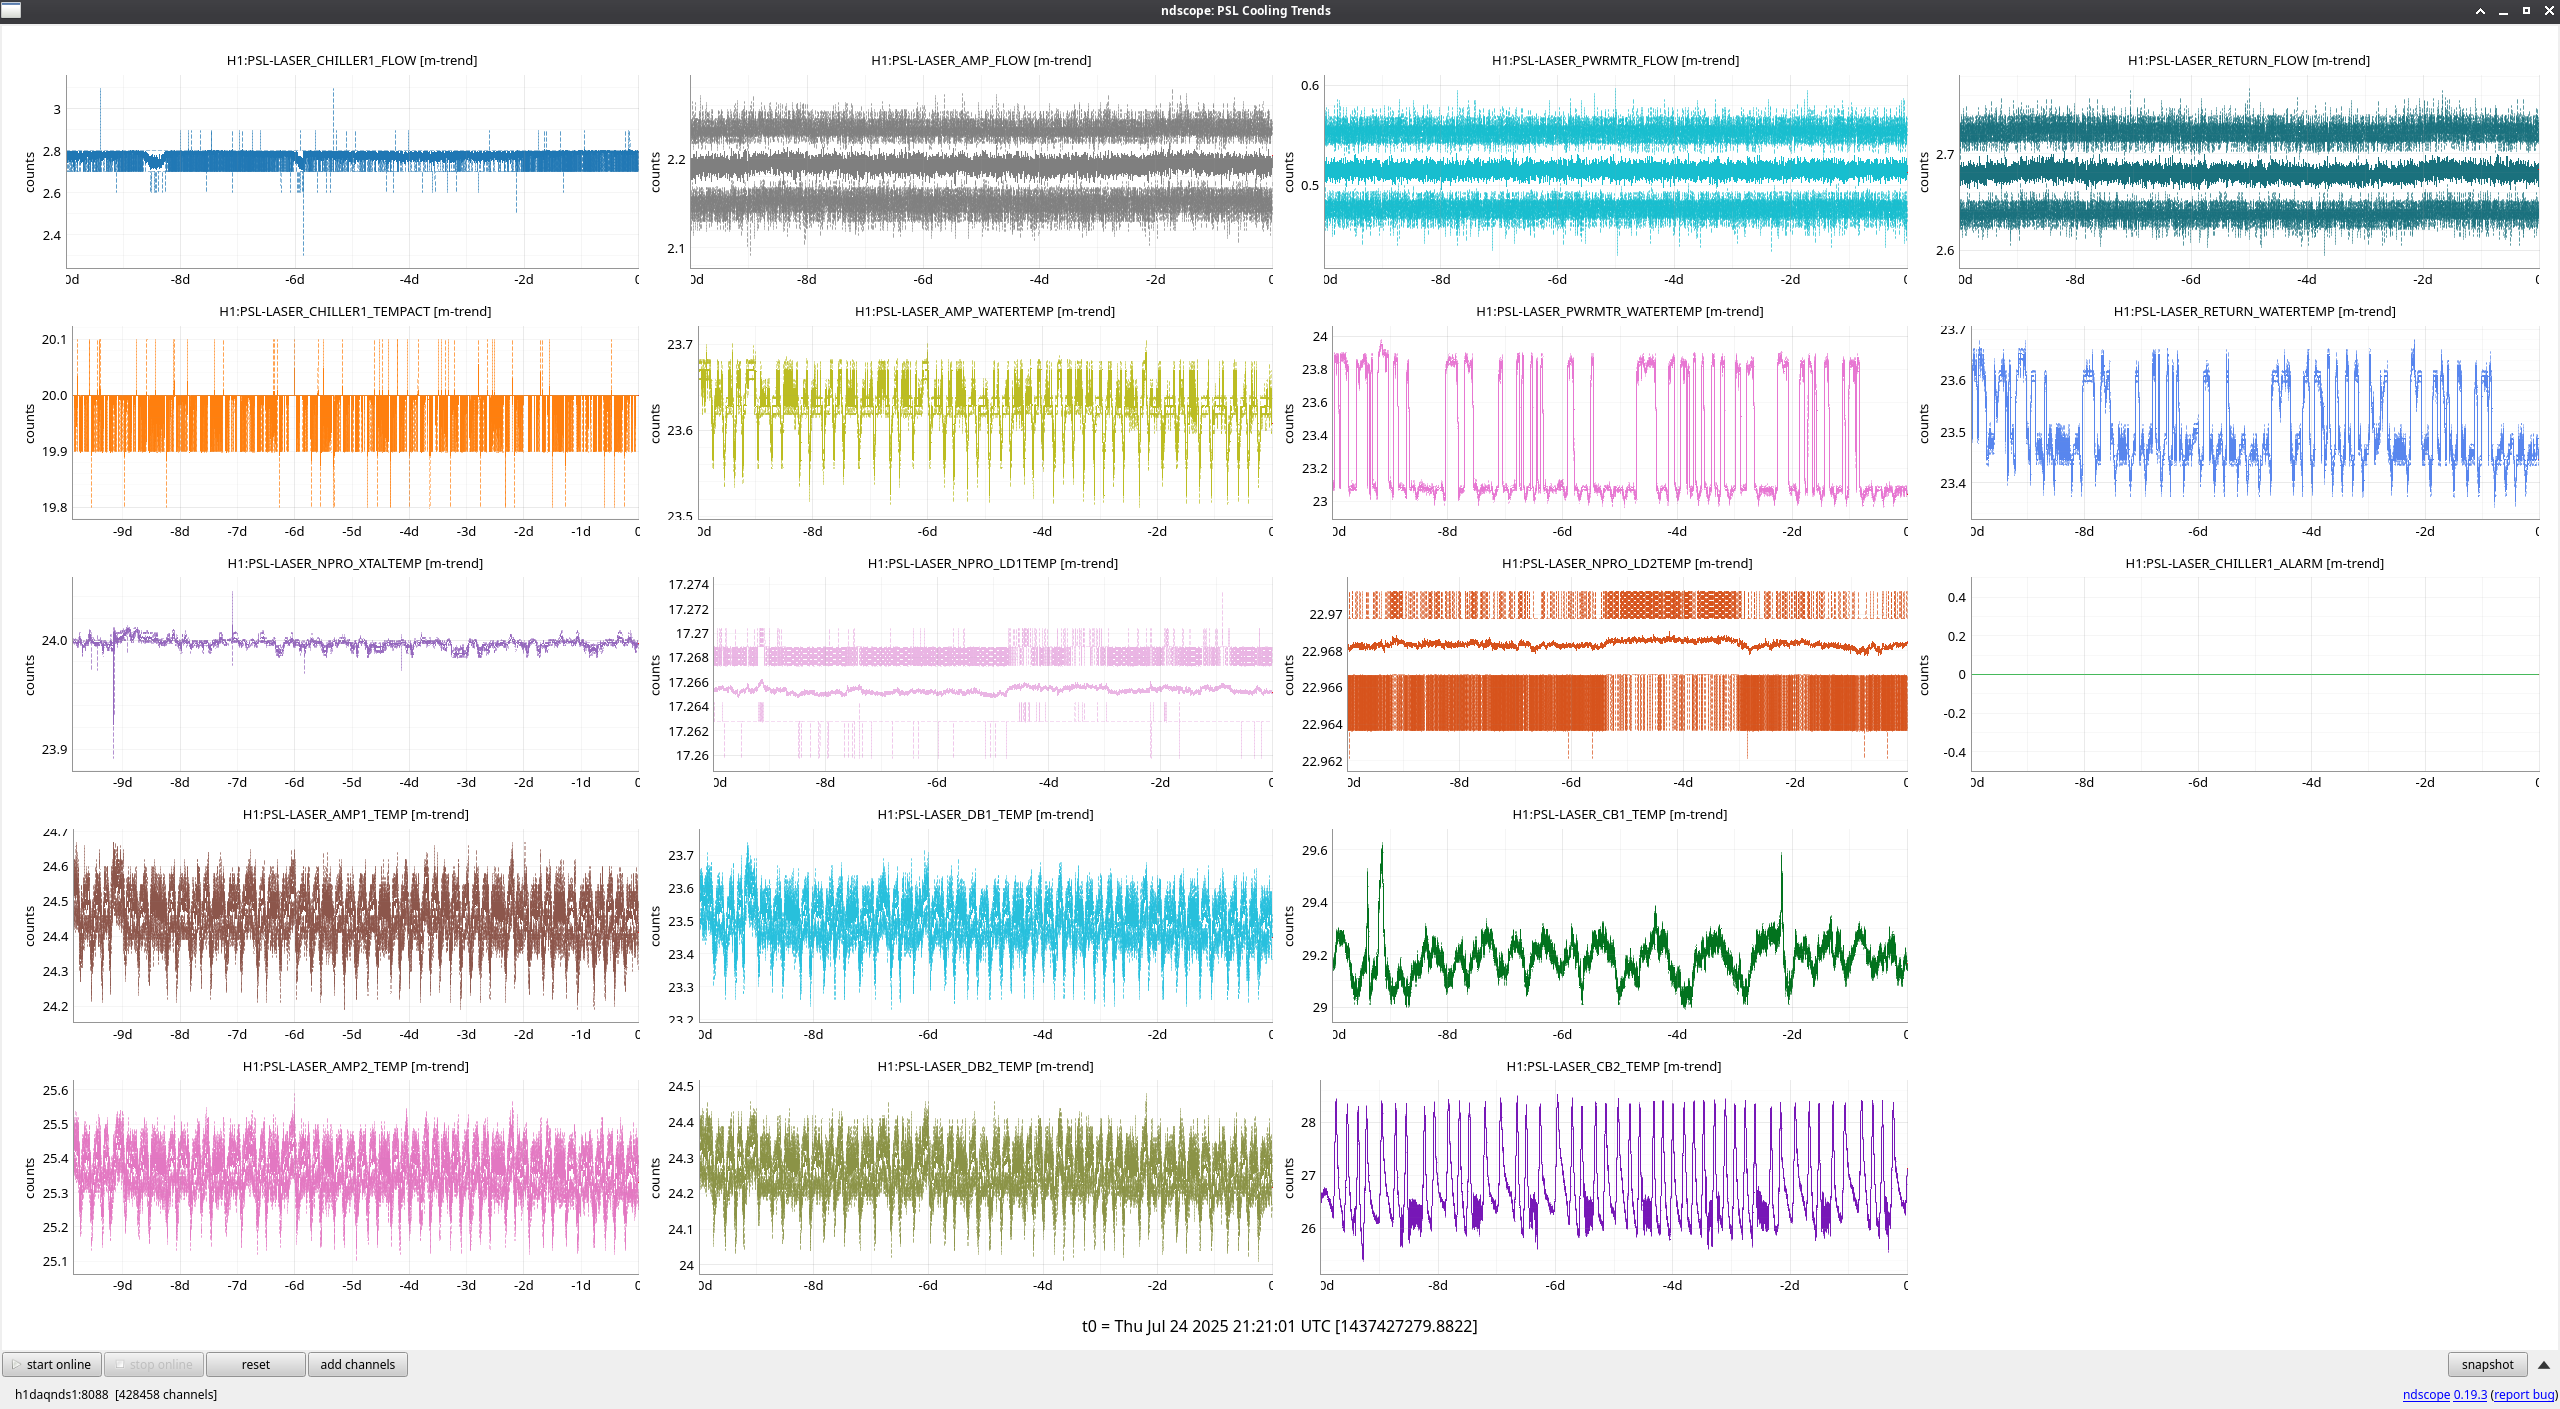
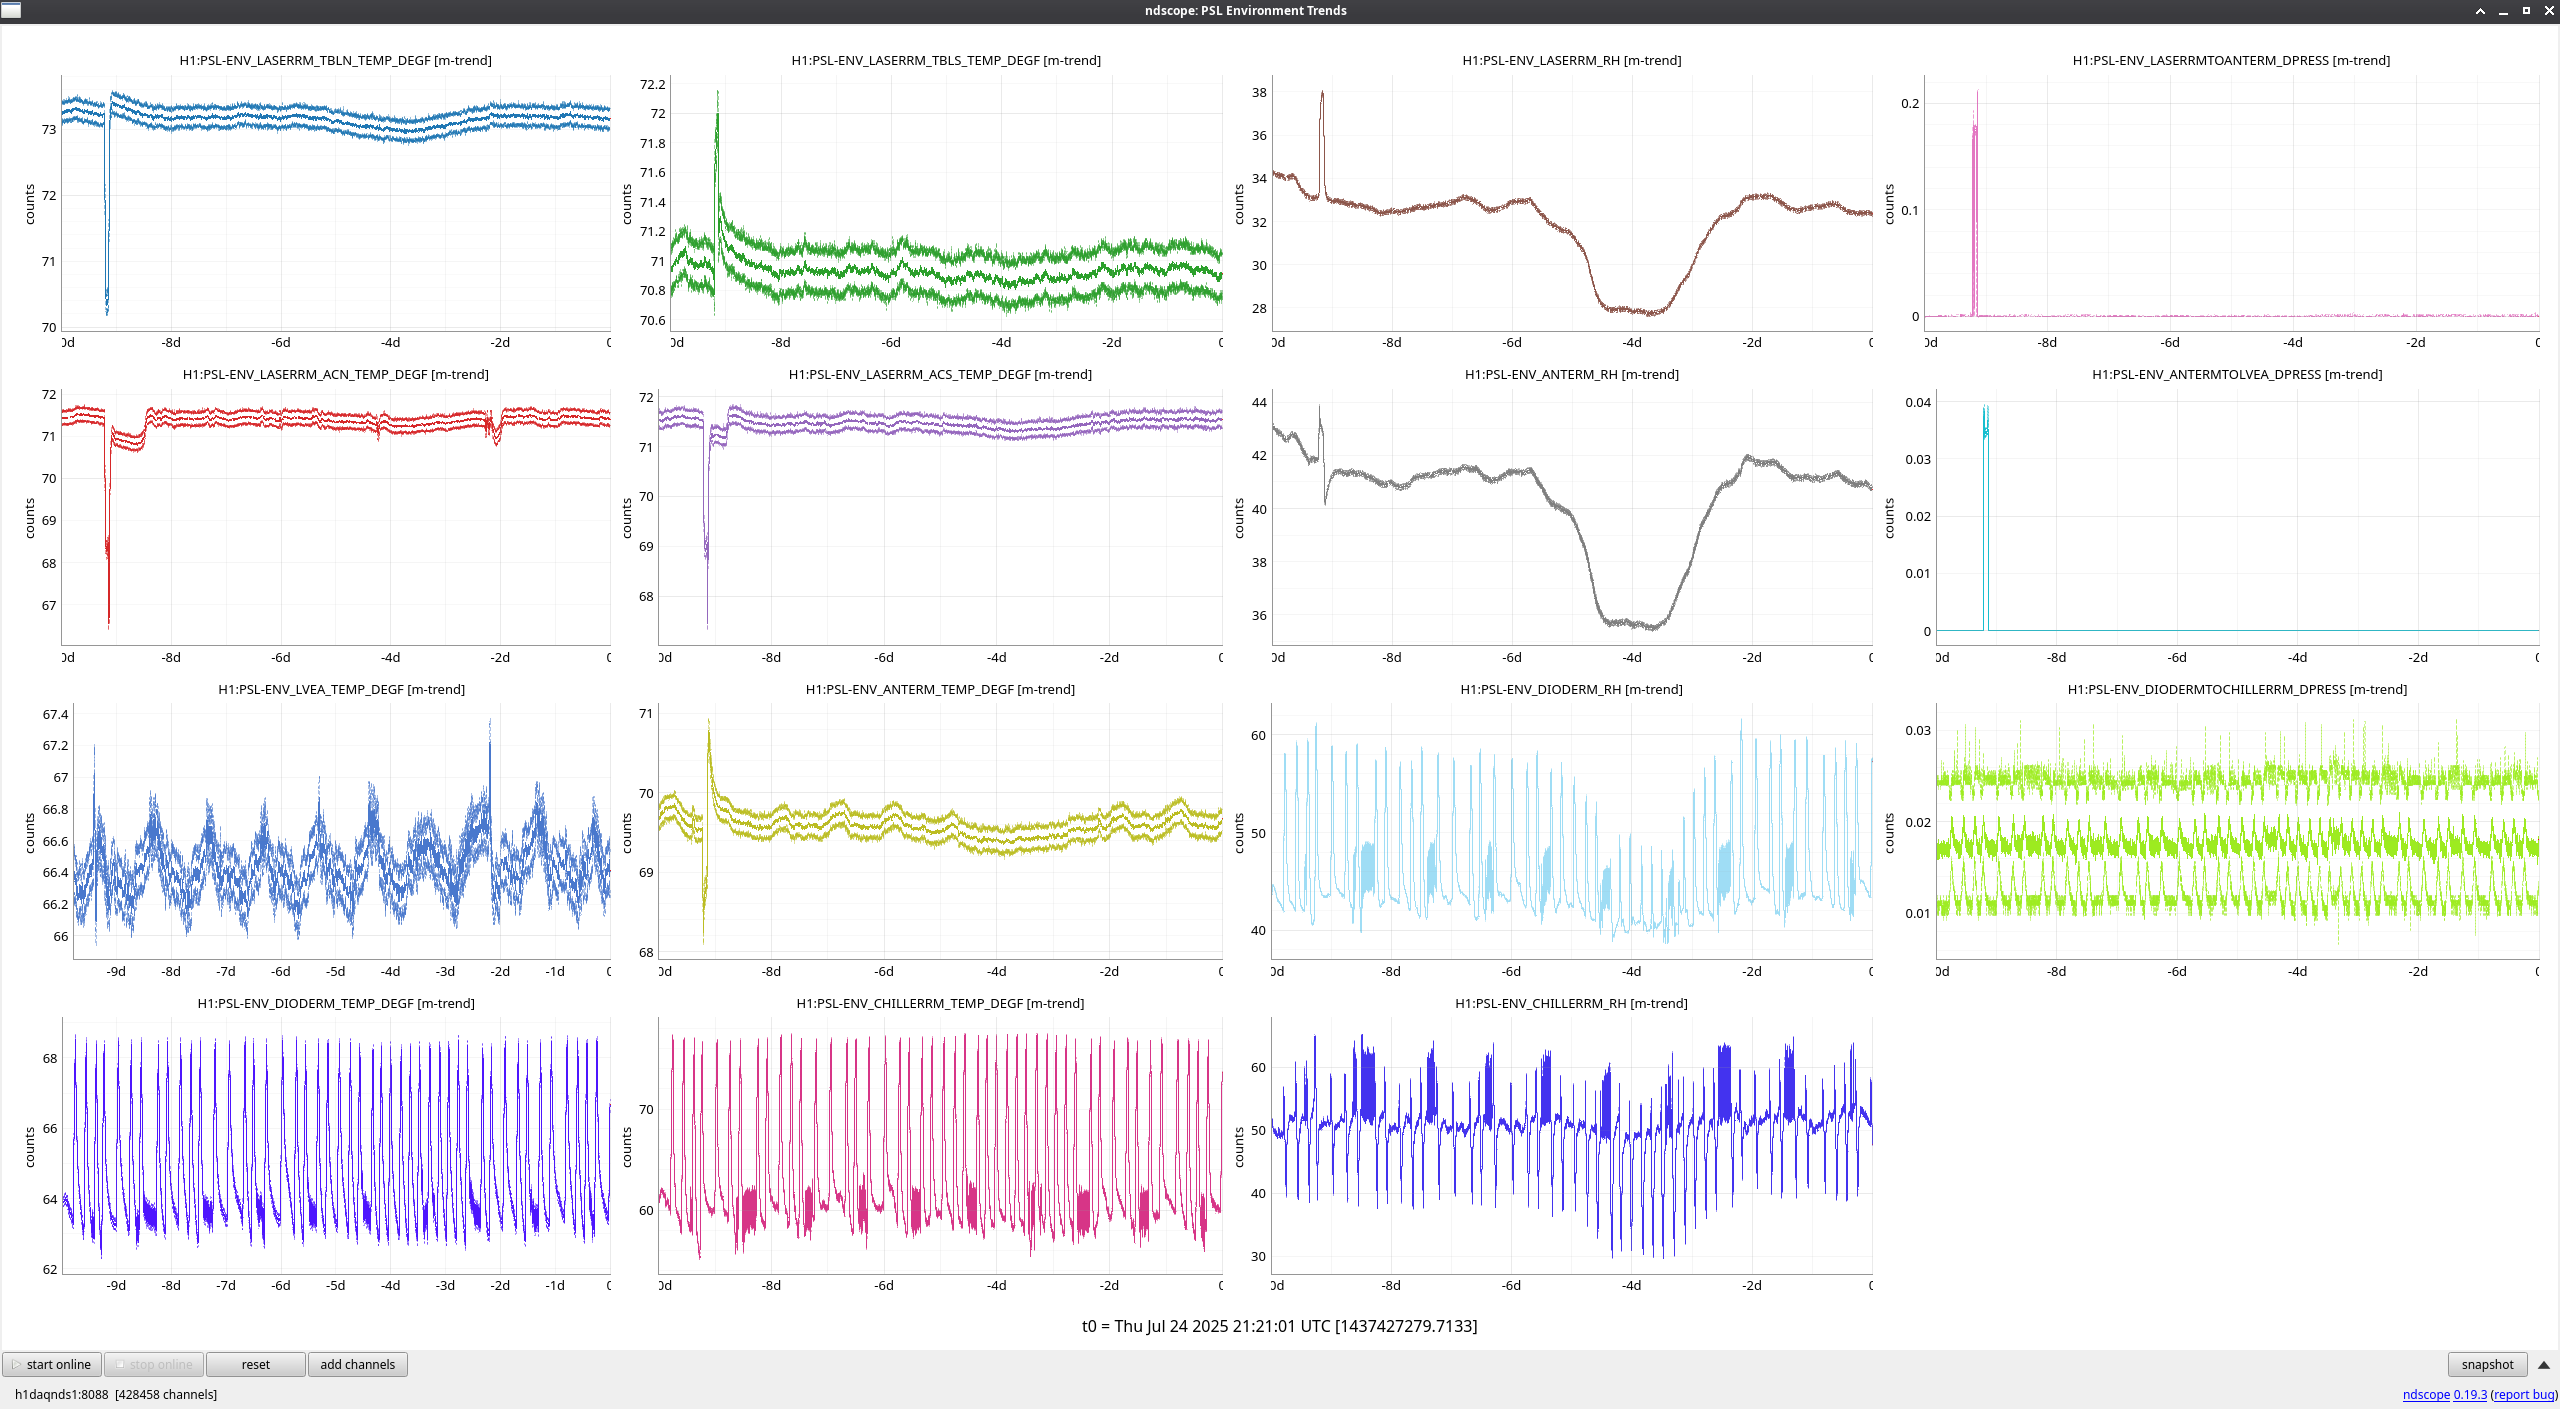
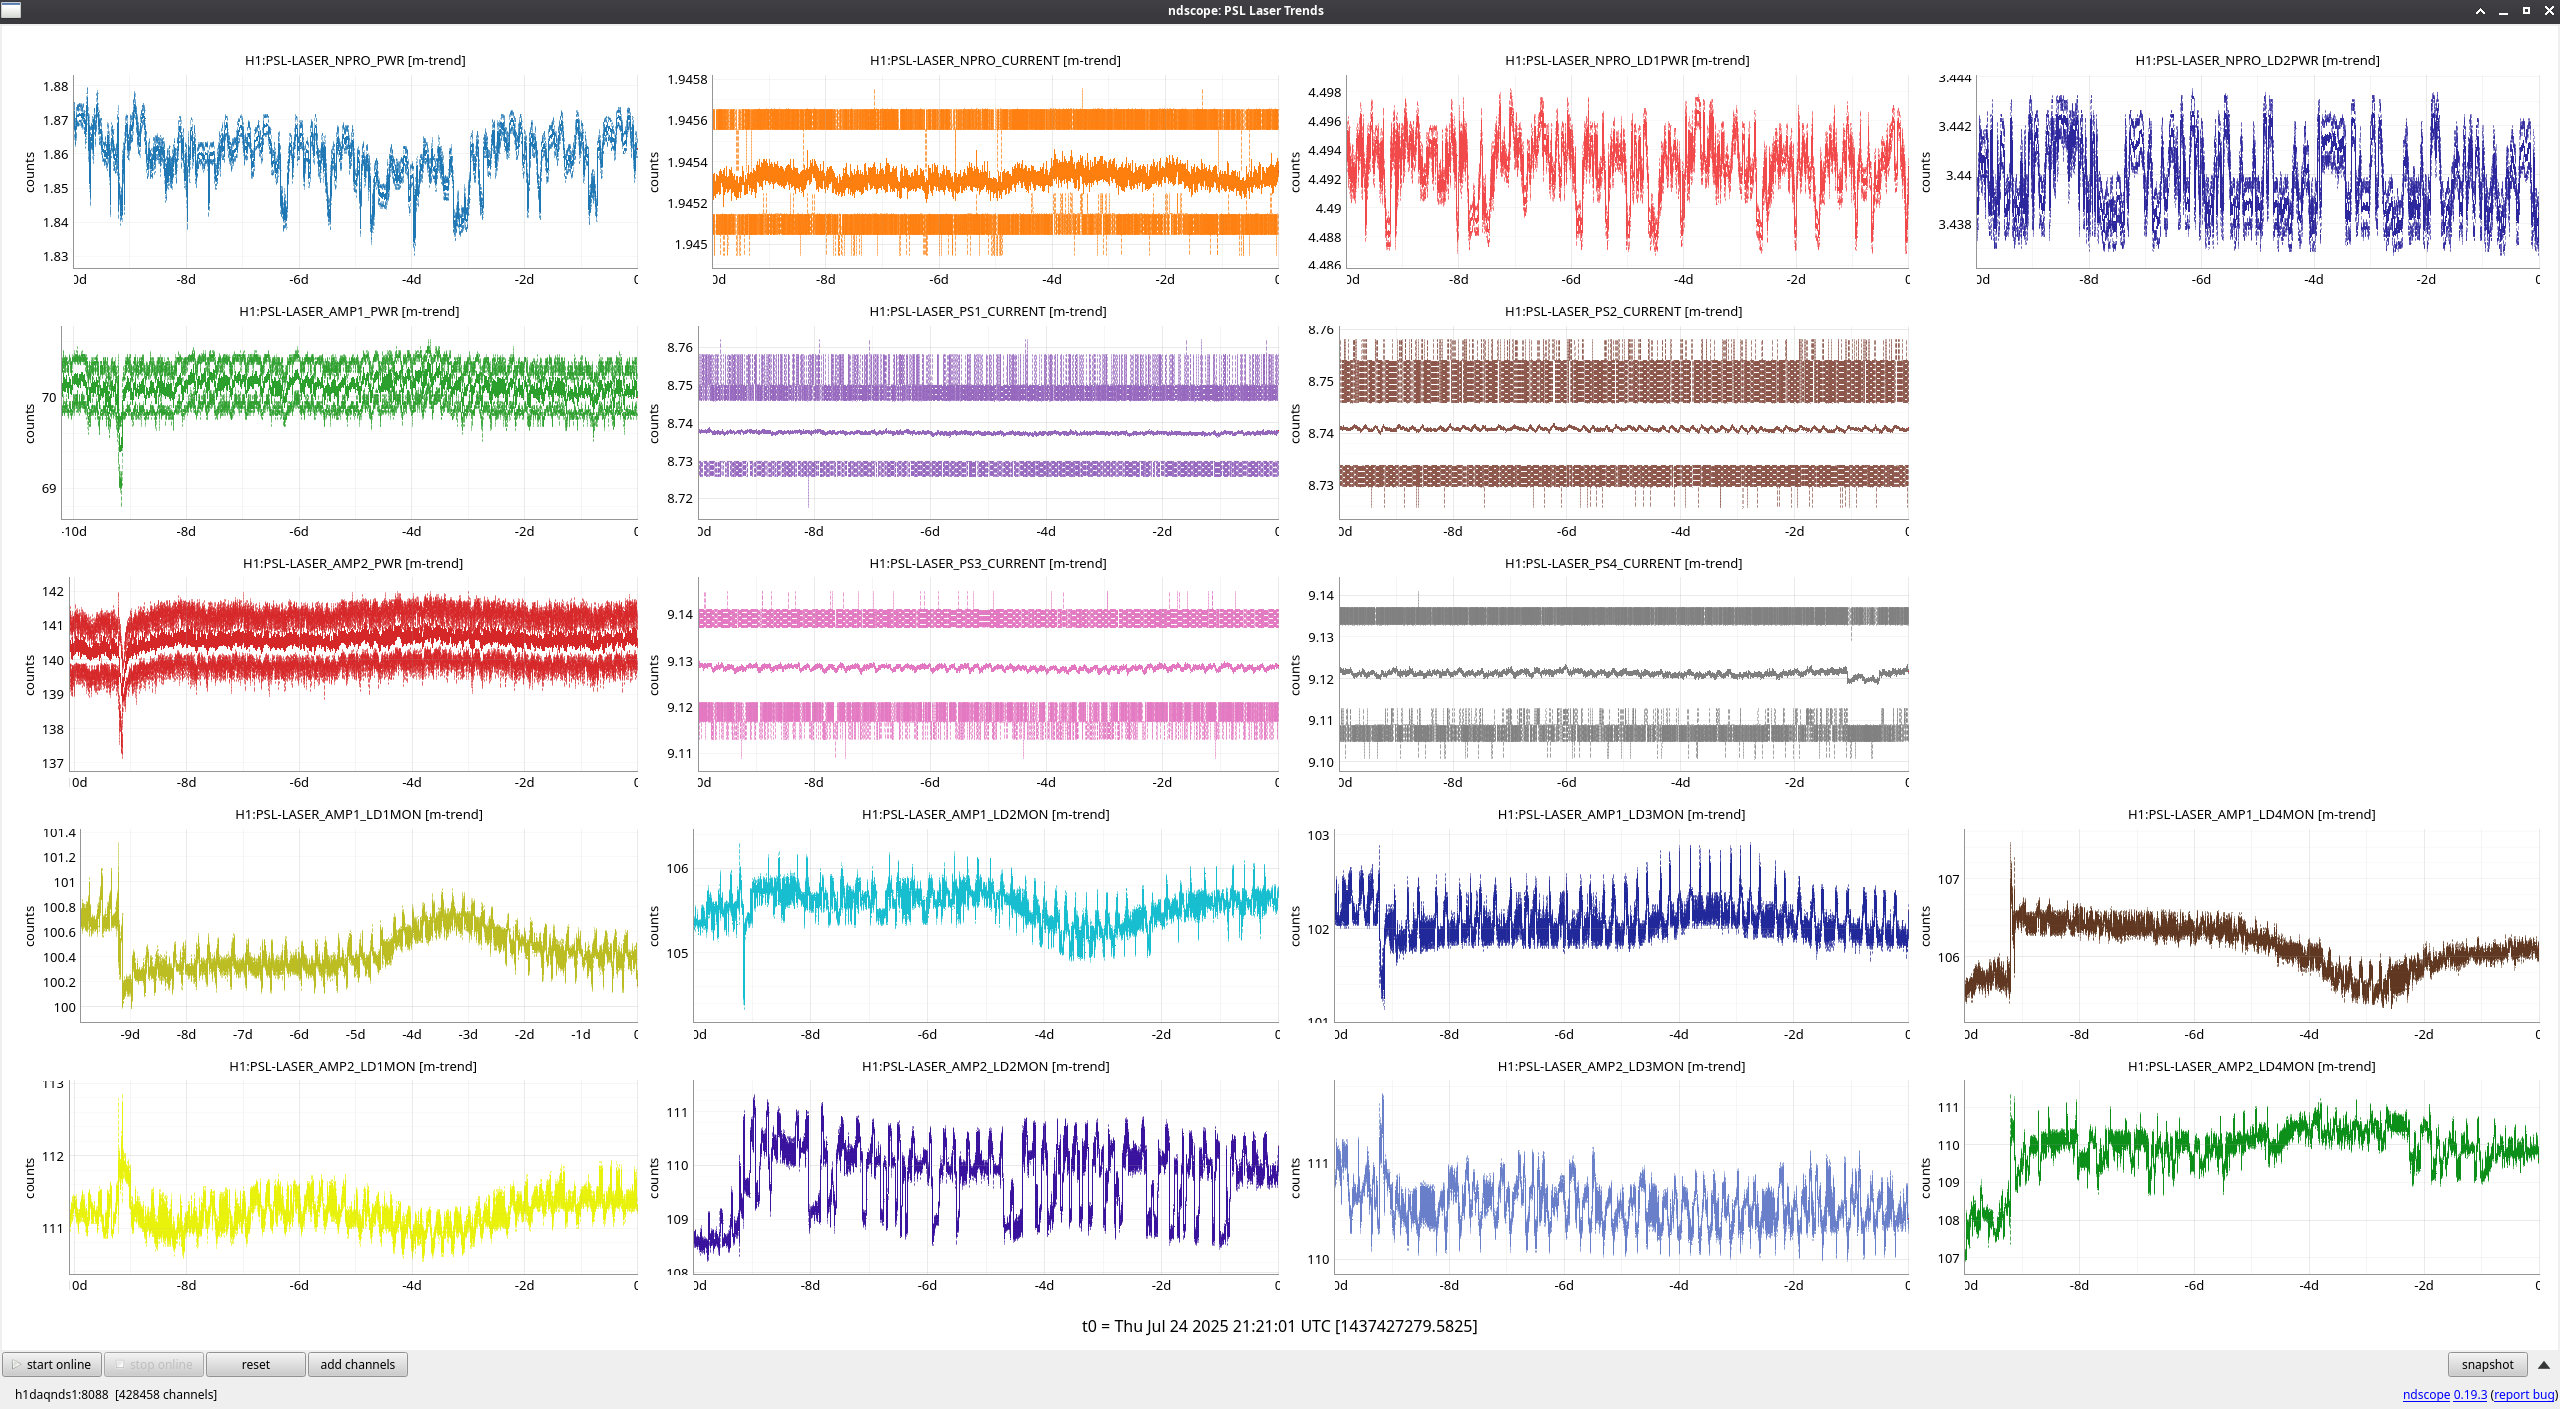
FAMIS 31095
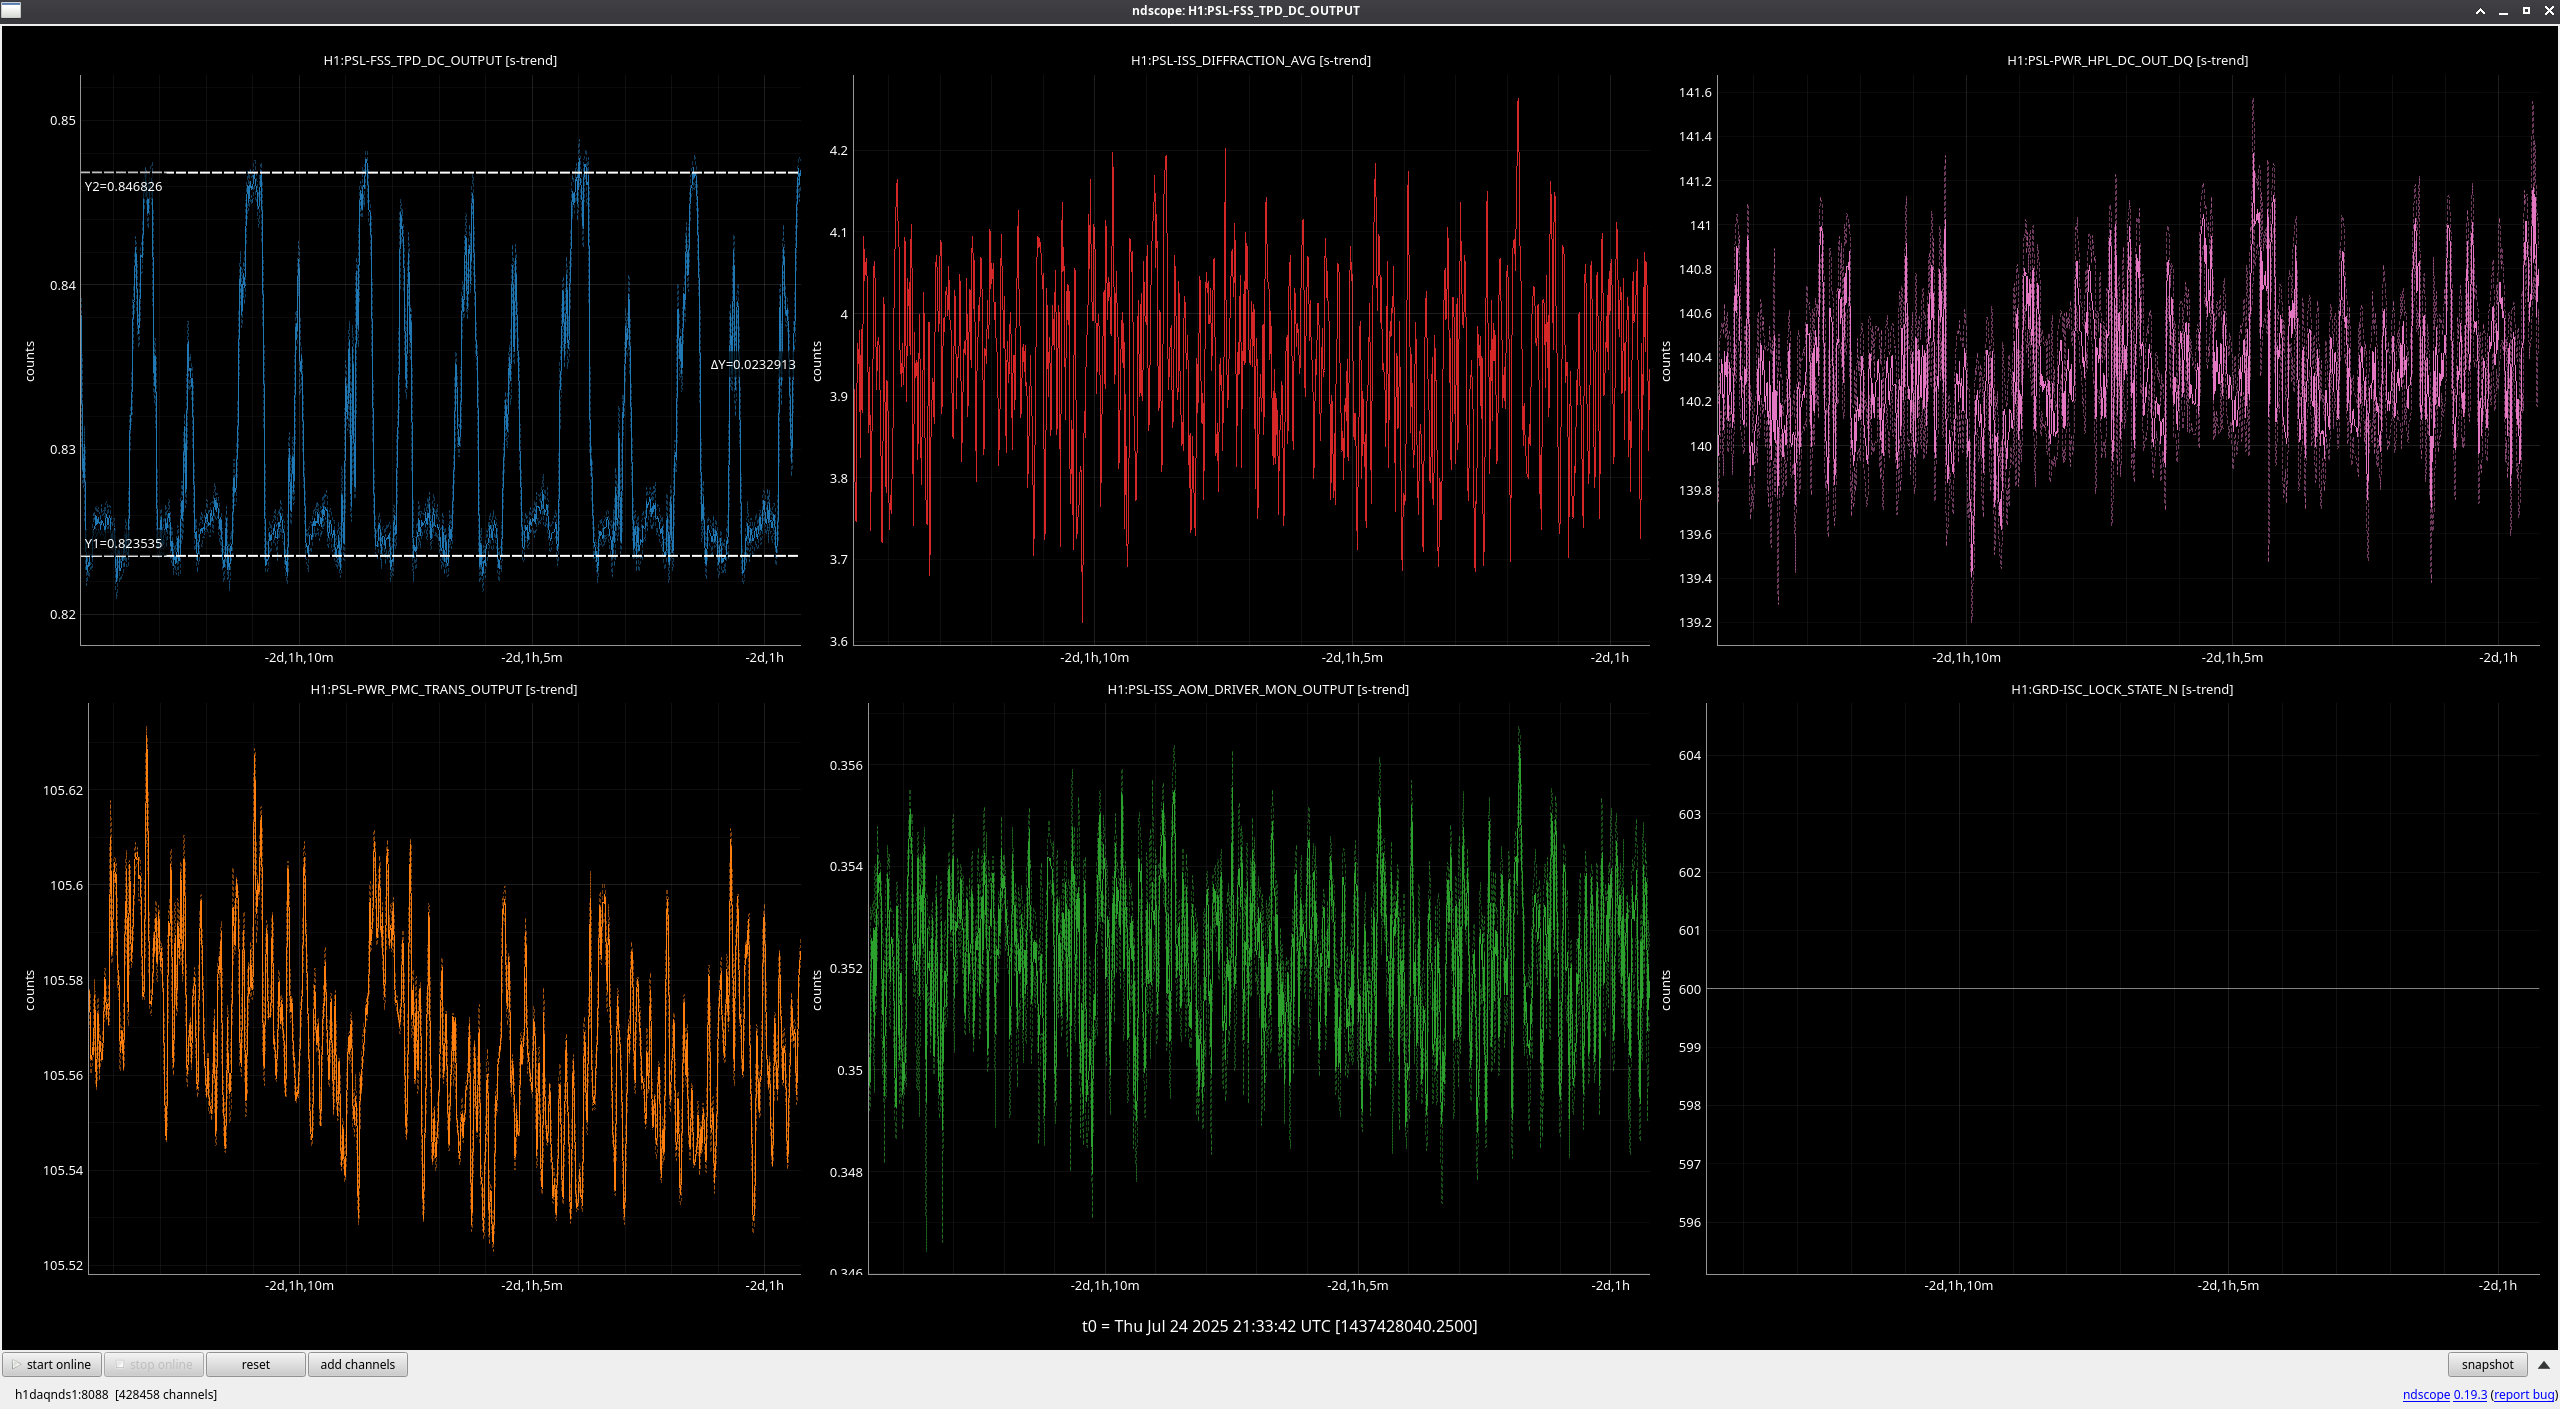
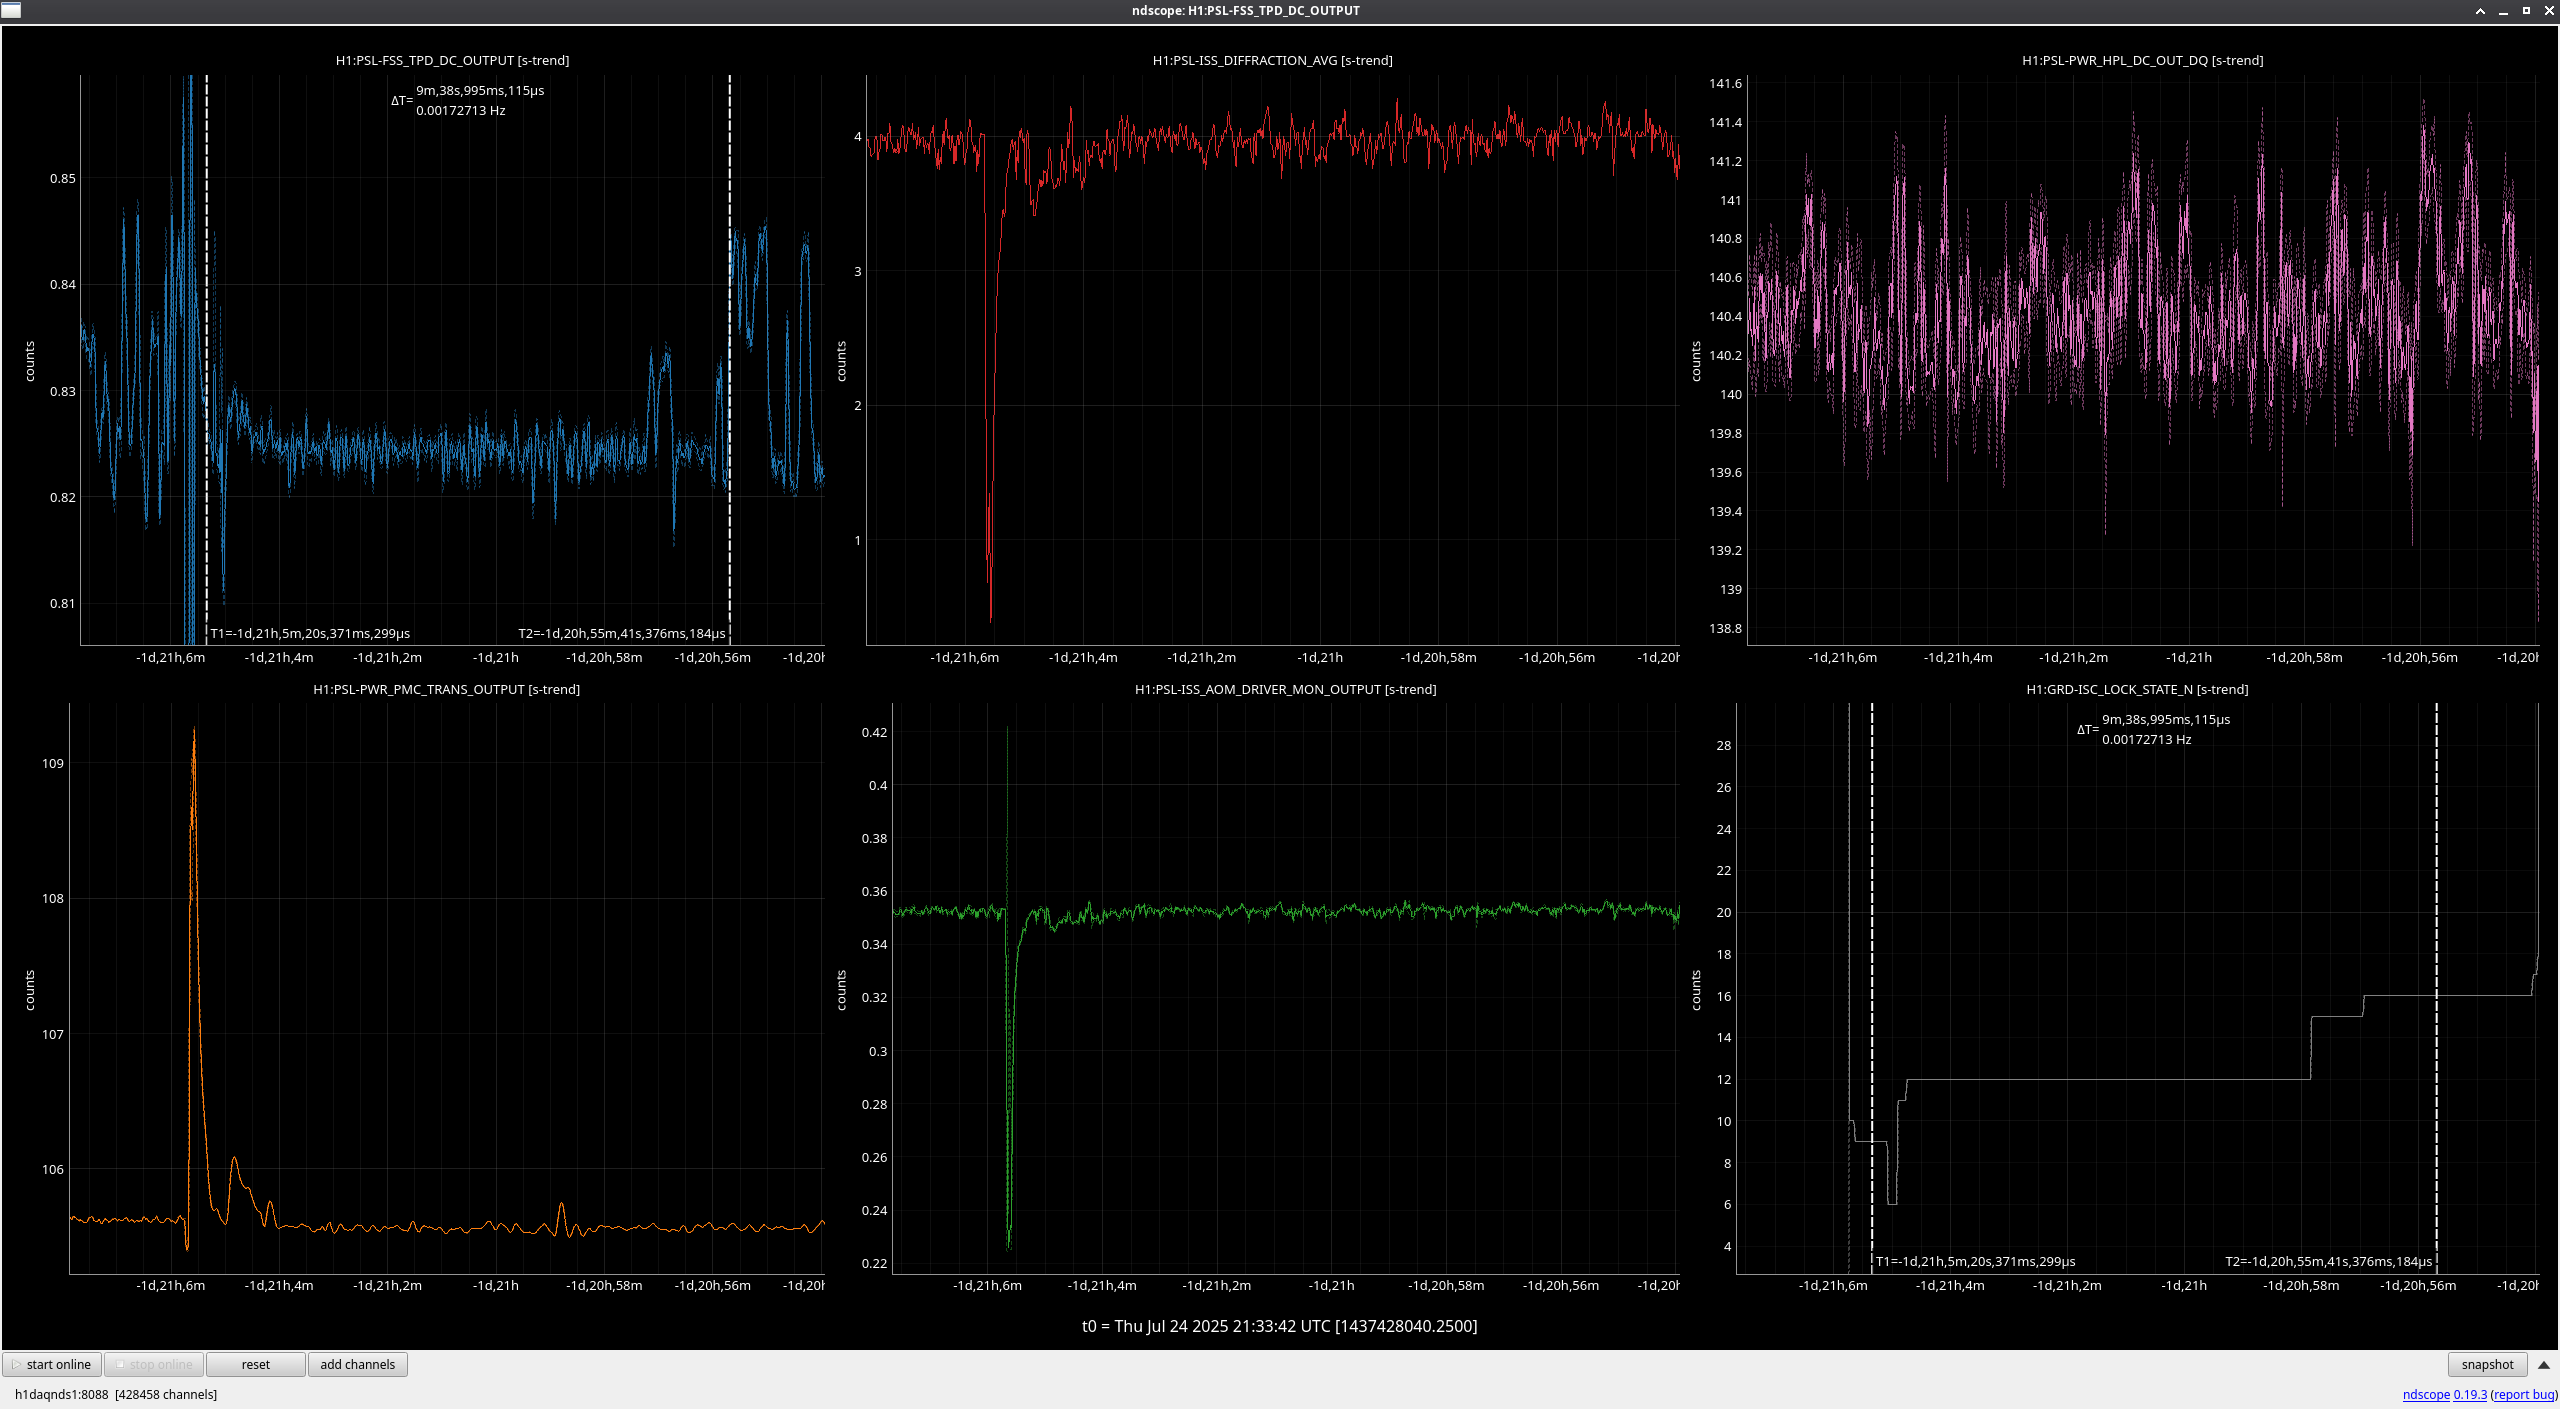
Late to this check this week, but not too much to report. Jason's incursion last week for an FSS tuneup (alog85769) is clearly seen, and generally things have been stable since. Only strangeness is a noisier FSS TPD signal as of about 2 days ago, which I looked a little closer into.
Zooming in on the FSS TPD signal during an observing period (see second to last attachment), these look to be brief jumps in power on the TPD on the order of 20-30mV that I don't see evidence of anywhere else; AMP2 output, PMC output, and ISS actuation all seem nominal during these times. These jumps look to be happening constantly any time the IFO is at or above the 'LOCKING_ALS' steps, and it was during this step during relocking after Tuesday maintenance when the jumps first started. The only thing that changed during Tuesday's maintenance period that might have an effect is the sat amp modifications to MC1 and MC3 (alog85922), possibly changing something about the IMC's feedback to the FSS? See final attachment for behavior while the IFO is unlocked and the FSS TPD signal goes quiet. I've been watching the RefCav REFL camera spot while these jumps happen, and I do notice a very slight shift of the spot, but not a change in shape. I'm not sure how to explain this behavior or why it would have started, but at least so far it hasn't seemed to be much of a "problem," although I'll be keeping an eye on it.

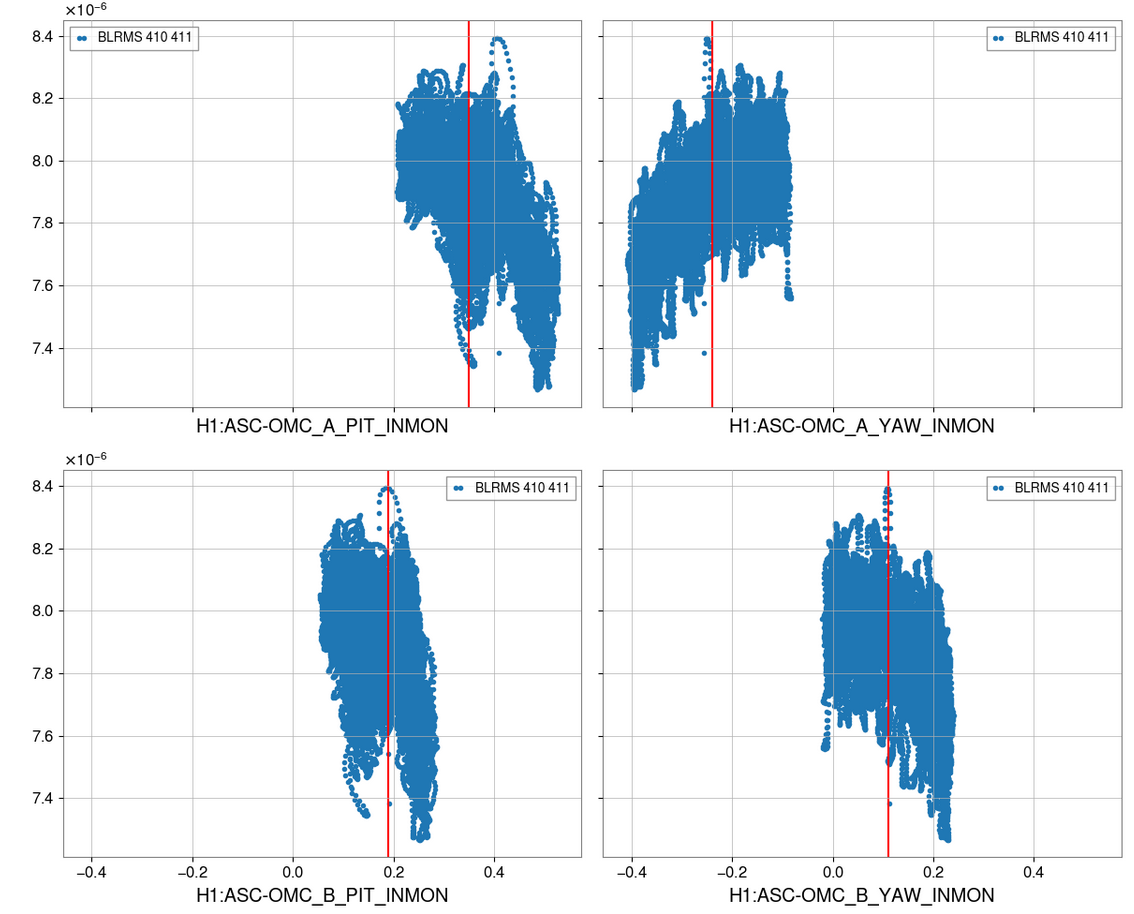
Summary: I didn't see any conclusive difference that showed we could get an improvement from a change in a particular direction. Since the optical gain moves around so much its hard to see the effect of small or quick changes. It might be worth doing a longer test were we step these offsets in sets of three different values per dof (3*4 steps) and do each for five mins (~ 1 hour).
I orginally was trying to use the results of our last injection (2025-06-16 20:41:15 UTC to2025-06-16 21:01:57 UTC ) to determine how to change the OMC ASC alignment.
Using /ligo/home/jennifer.wright/git/2025/OMC_Alignment/20250116_OMC_Alignment_EXC.xml we injected four low frequency lines into H1:OMC-ASC_{POS,ANG}_{X,Y}_EXC - these channels come after the filter banks (ASC-OMC_A_PIT_OFFSET, then ASC-OMC_B_PIT_OFFSET, then ASC-OMC_A_YAW_OFFSET, then ASC-OMC_B_YAW_OFFSET) where the nominal offsets are set. The injection is at four different frequencies (0.0113, 0.0107, 0.0097 and 0.0103 Hz).
The analysis then involves looking at the 410 Hz line height on the OMC DCPD SUM to interpret the effect on optical gain.
However it is not clear from this plot that the full range of phase space has been looked at - ie we have not changed the offset with a large enough amplitude to check their current position is optimal.
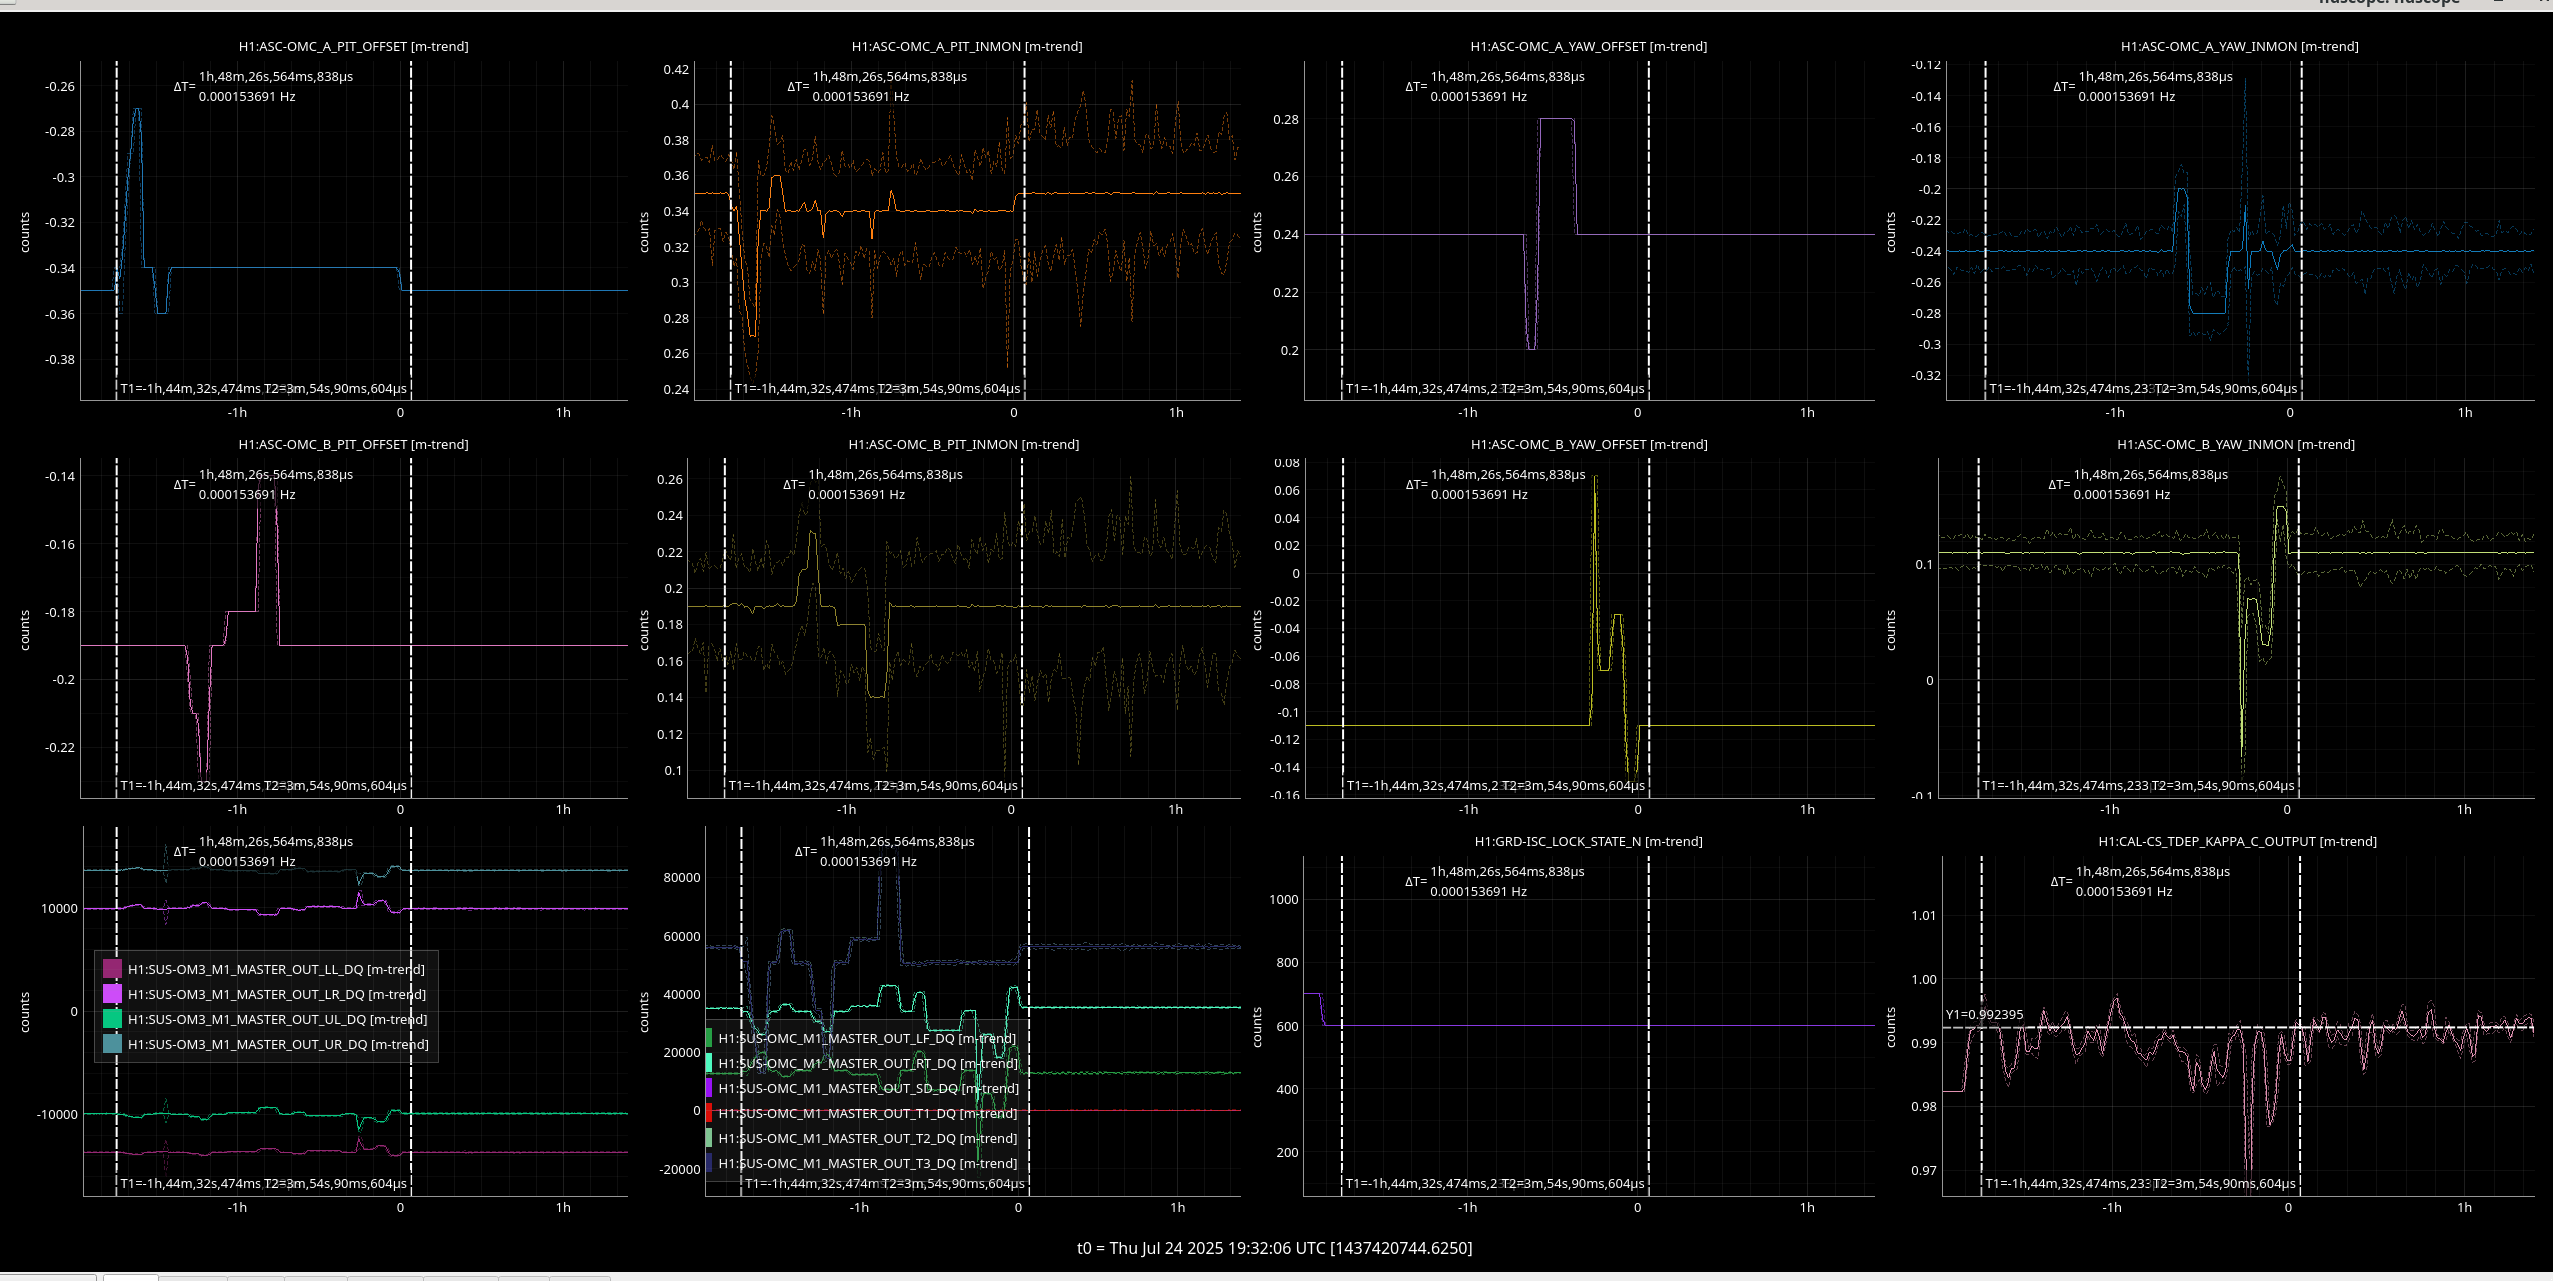
Thus today I stepped ASC-OMC_A_PIT_OFFSET, then ASC-OMC_B_PIT_OFFSET, then ASC-OMC_A_YAW_OFFSET, then ASC-OMC_B_YAW_OFFSET - these filter banks are before the ones used above in the model and are the ones where the offset for the QPDs is set. In the
Towards the last three measurements we realised that we need to do larger changes ~0.04 counts to see a change in kappa C then wait for 3-4 mins. On the long term trend none of these changes seemed to produce any meausurable gain, but it would be good to repeat this measurement with longer times spent at each step and perhaps go in slightly larger steps.
The ndscope template is in /ligo/home/jennifer.wright/git/2025/OMC_Alignment/20250724_change _offsets_by_hand.yaml
Jennie, Elenna,
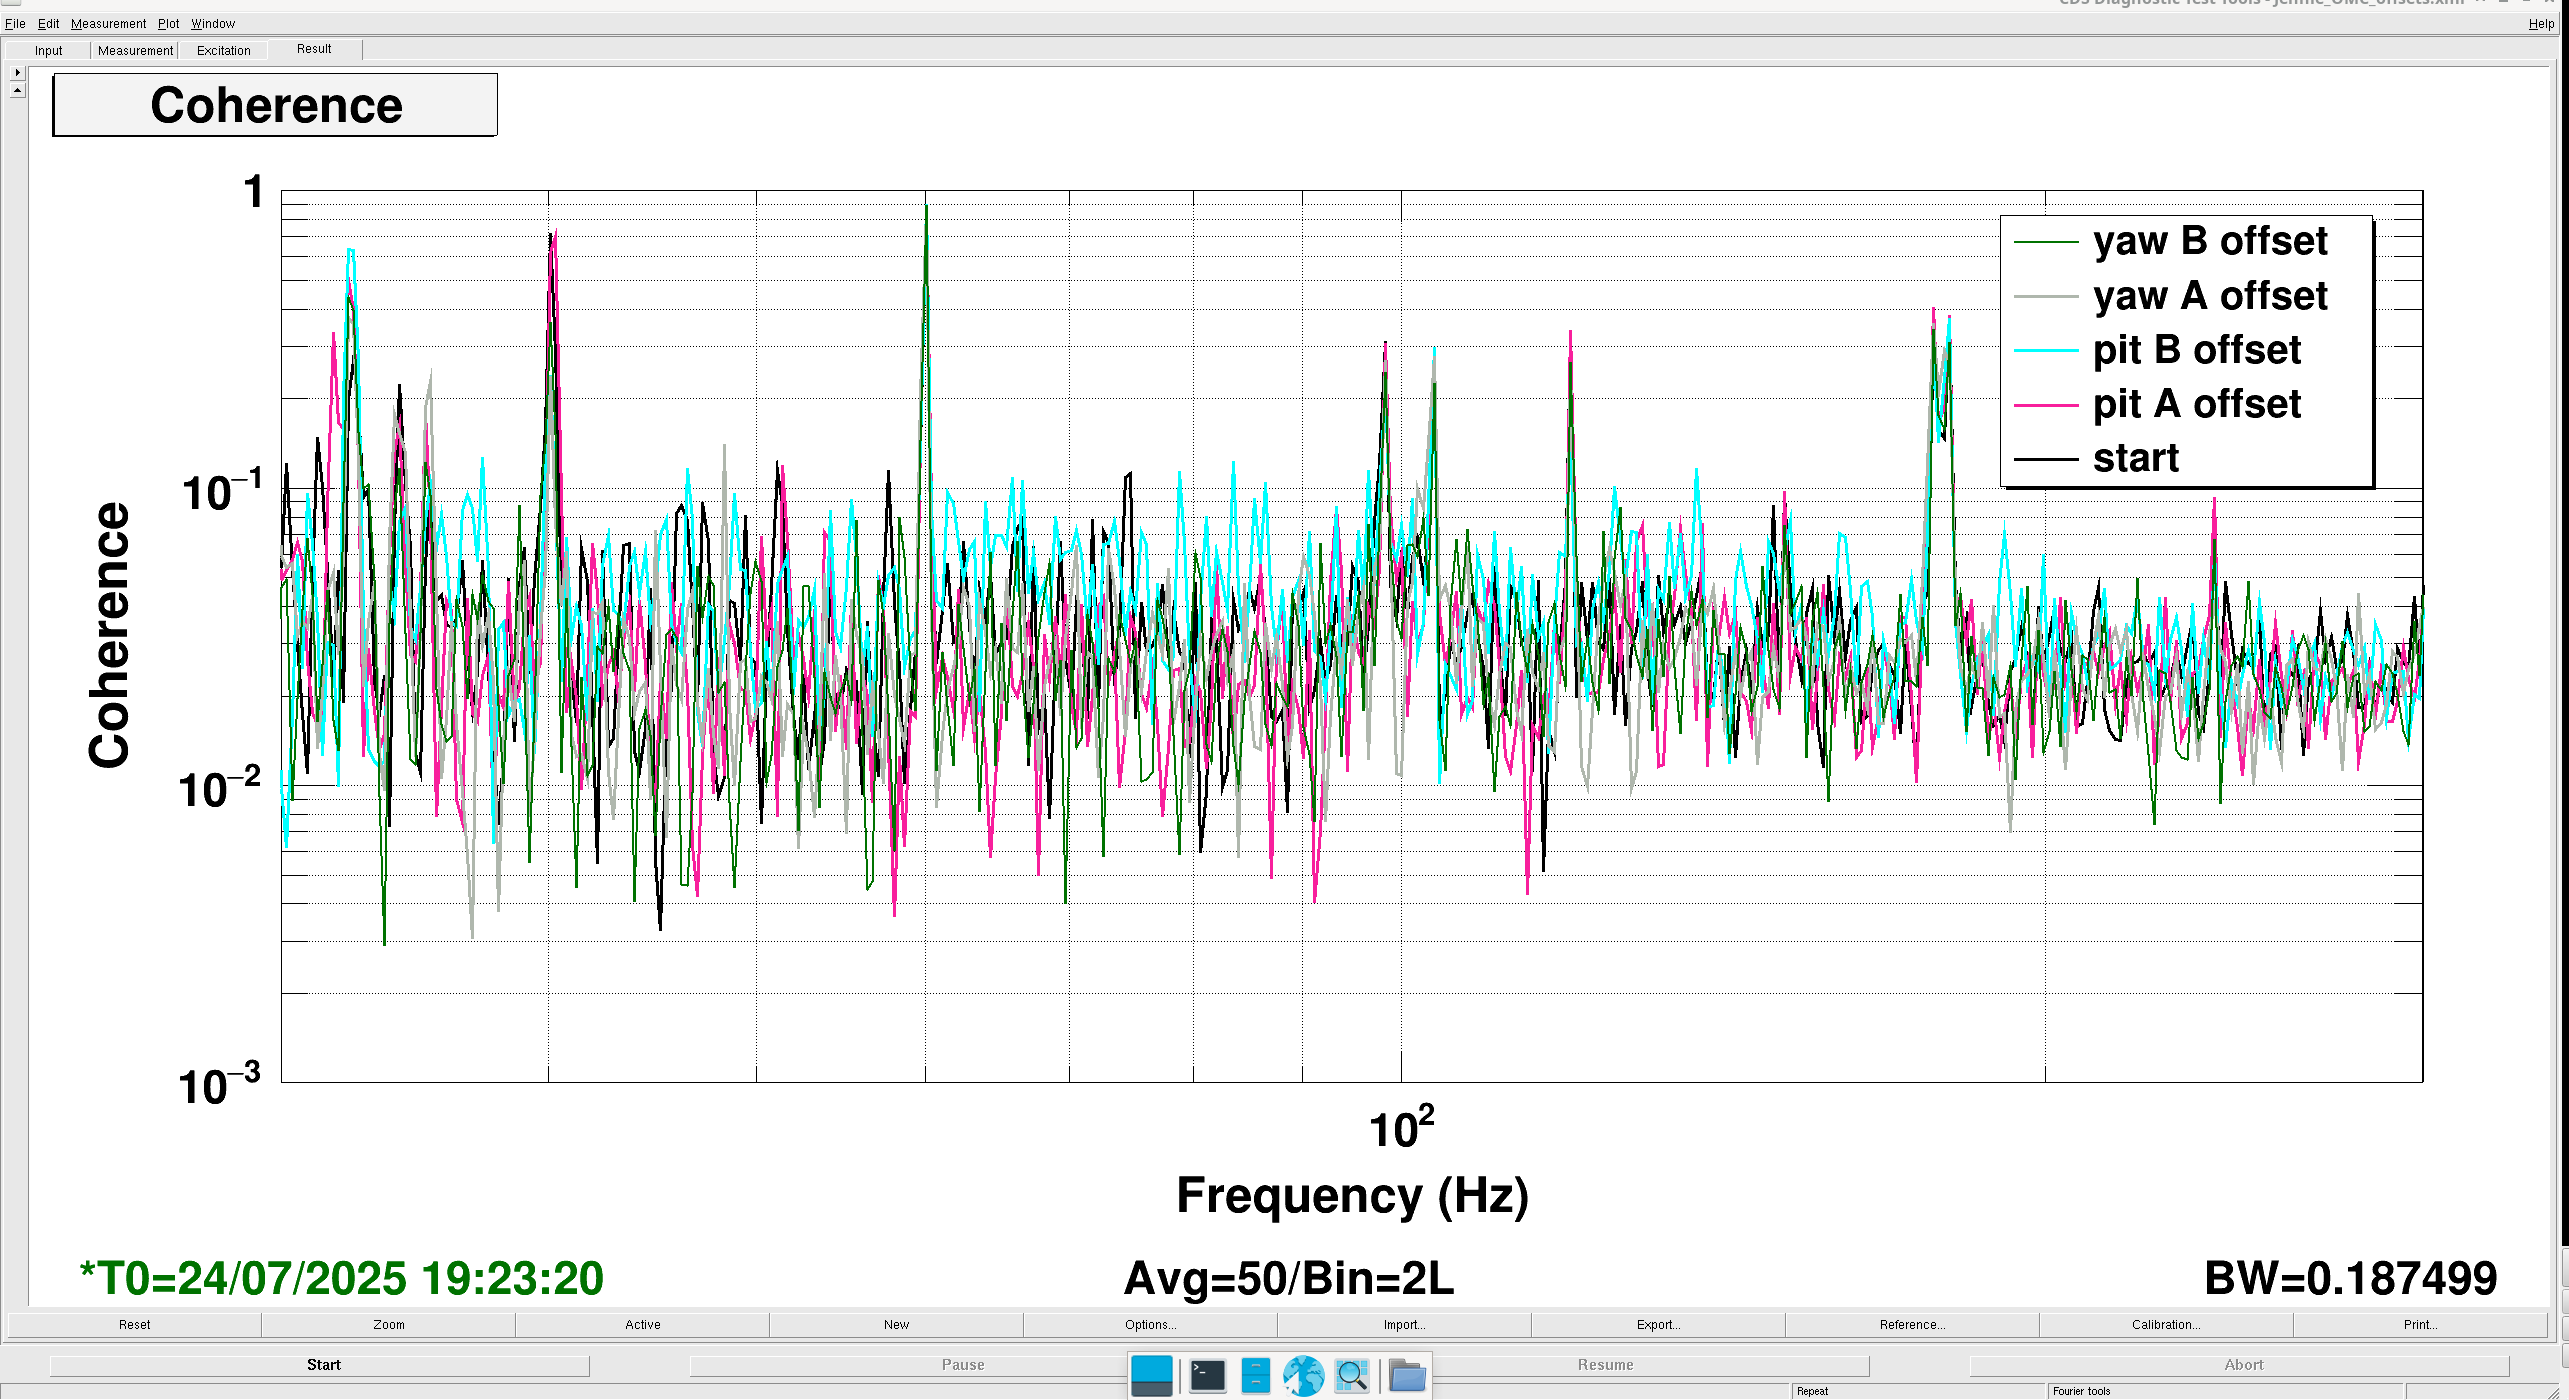
The other day Elenna noticed some coherence between DARM and the light reflected from the OMC (OMC-REFL_A_LF_OUT_DQ) and wondered if this implies our mode-matching or OMC alignment is bad.
So I took some times from above when one of the offsets was non-nominal and we compared the coherence between these times, since it shows some small change maybe there is still some tuning we could do of these offsets to recover some optical gain.
The measurement is saved in /ligo/home/jennifer.wright/git/2025/OMC_Alignment/Jennie_OMC_offsets.xml
Each was around 3 minutes long apart from the starting measurement which we took from a quiet time before the measurements.
The measurement times are:
nominal settings: 16:29:21 UTC
PITCH A: 17:54:11:UTC
PITCH B: 18:39:57 UTC
YAW A :18:58:10 UTC
YAW B :19:23:20 UTC
Looking just in the last 10 days where we feel we've been having more locklosses:
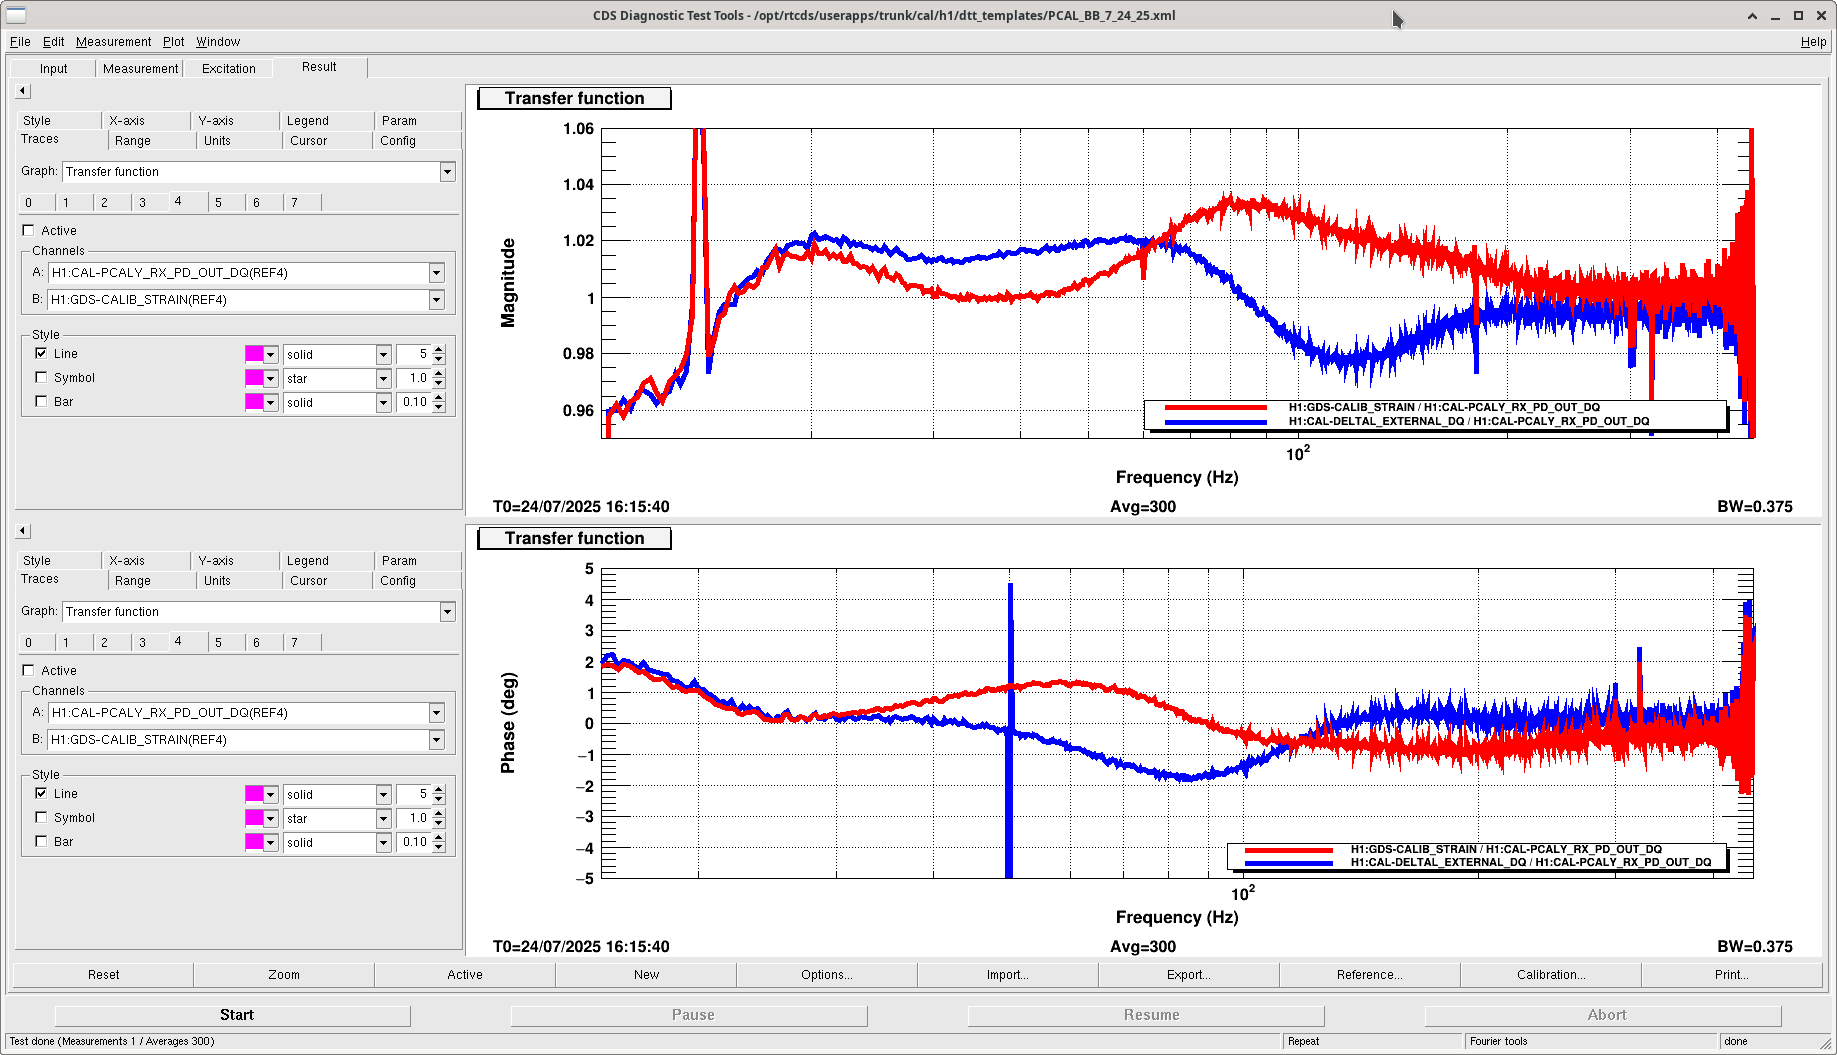
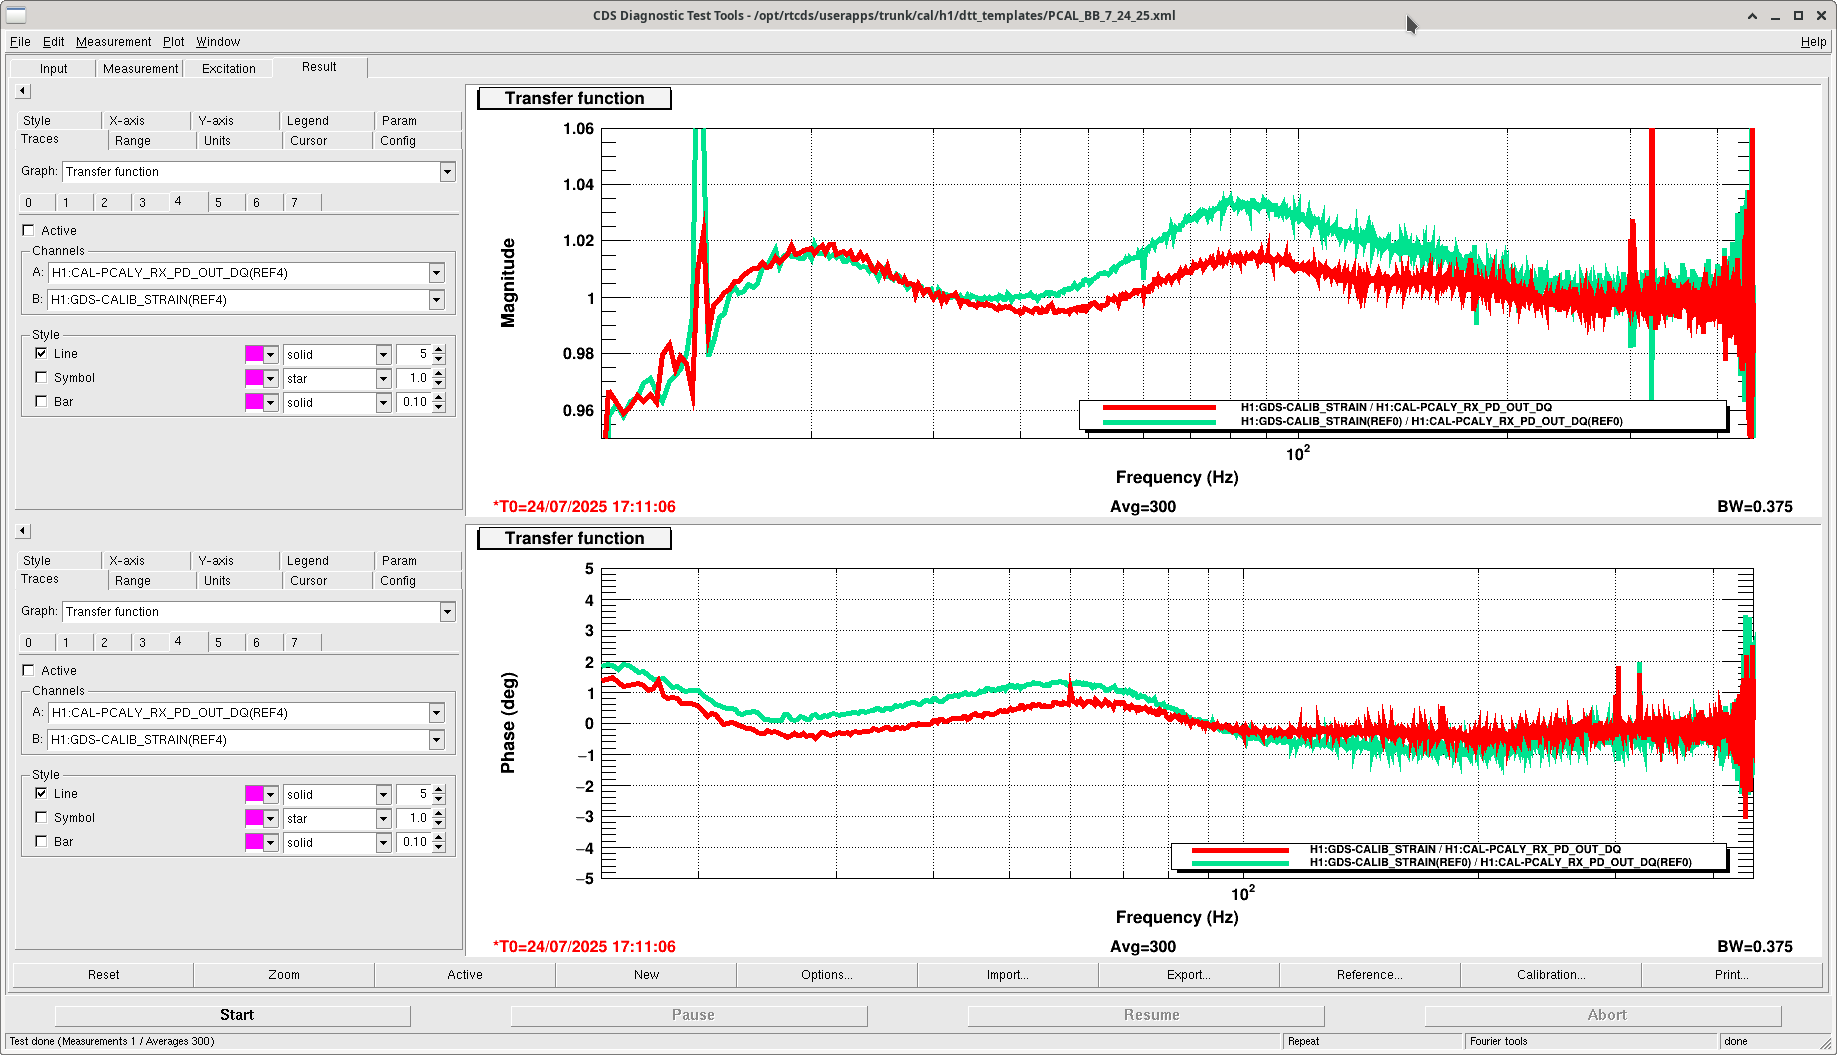
I lowered the L2 calibration line height by a factor of 2.2- the measurement uncertainty was around 0.0007, and our target is 0.002. Now the uncertainty seems to lie around 0.0016. I updated the guardian and SDF with the new injection amplitude- 3.5.
Ran a broad band (171106UTC), then a simulines. This was after running a serparate bb and start of a simulines that I had to bail out of because I had not gone back to NLN_CAL_MEAS. This allowed Elenna and Sheila to decide on something else and we reran after they made some changes.
Simulines start:
PDT: 2025-07-24 10:16:43.573765 PDT
UTC: 2025-07-24 17:16:43.573765 UTC
GPS: 1437412621.573765
Simulines end:
PDT: 2025-07-24 10:40:03.824053 PDT
UTC: 2025-07-24 17:40:03.824053 UTC
GPS: 1437414021.824053
Files:
2025-07-24 17:40:03,654 | INFO | File written out to: /ligo/groups/cal/H1/measurements/DARMOLG_SS/DARMOLG_SS_20250724T1
71644Z.hdf5
2025-07-24 17:40:03,661 | INFO | File written out to: /ligo/groups/cal/H1/measurements/PCALY2DARM_SS/PCALY2DARM_SS_2025
0724T171644Z.hdf5
2025-07-24 17:40:03,666 | INFO | File written out to: /ligo/groups/cal/H1/measurements/SUSETMX_L1_SS/SUSETMX_L1_SS_2025
0724T171644Z.hdf5
2025-07-24 17:40:03,670 | INFO | File written out to: /ligo/groups/cal/H1/measurements/SUSETMX_L2_SS/SUSETMX_L2_SS_2025
0724T171644Z.hdf5
2025-07-24 17:40:03,675 | INFO | File written out to: /ligo/groups/cal/H1/measurements/SUSETMX_L3_SS/SUSETMX_L3_SS_2025
0724T171644Z.hdf5
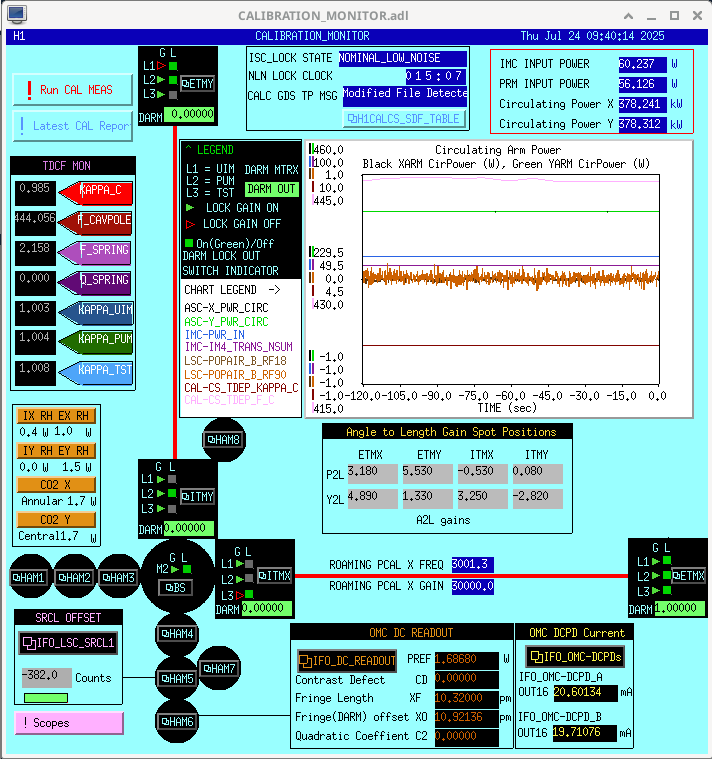
I (with help and input from Sheila and Joe B) pushed a new calibration today before this report was run.
First, we tried pushing the 20250628T190643Z report, but again that "failed" because the broadband showed a higher uncertainty than expected, again. The kappa C value also dropped from 0.993 before the push to 0.985 after the push and TDCF burn in. We puzzled over this for a bit, until I brought up that maybe this report is too out of date to be useful. We also had to make minor ring heater changes to avoid PIs just after this report had been generated. Sheila trended the optical gain and saw that it did decrease by about 1% after we changed the ring heater.
So, I took a look at the report from 20250719T225835Z, and it looked very promising. The sensing function fit residual showed it was much more flat than the 6/28 report. I pushed this report next, and after burn in kappa C returned to be about 0.993. The broadband also showed this was a better calibration. We think this is improved, and we will stick with this calibration!
Open questions: why is the error still at 2% at 20 Hz? Can we improve the optical gain further?
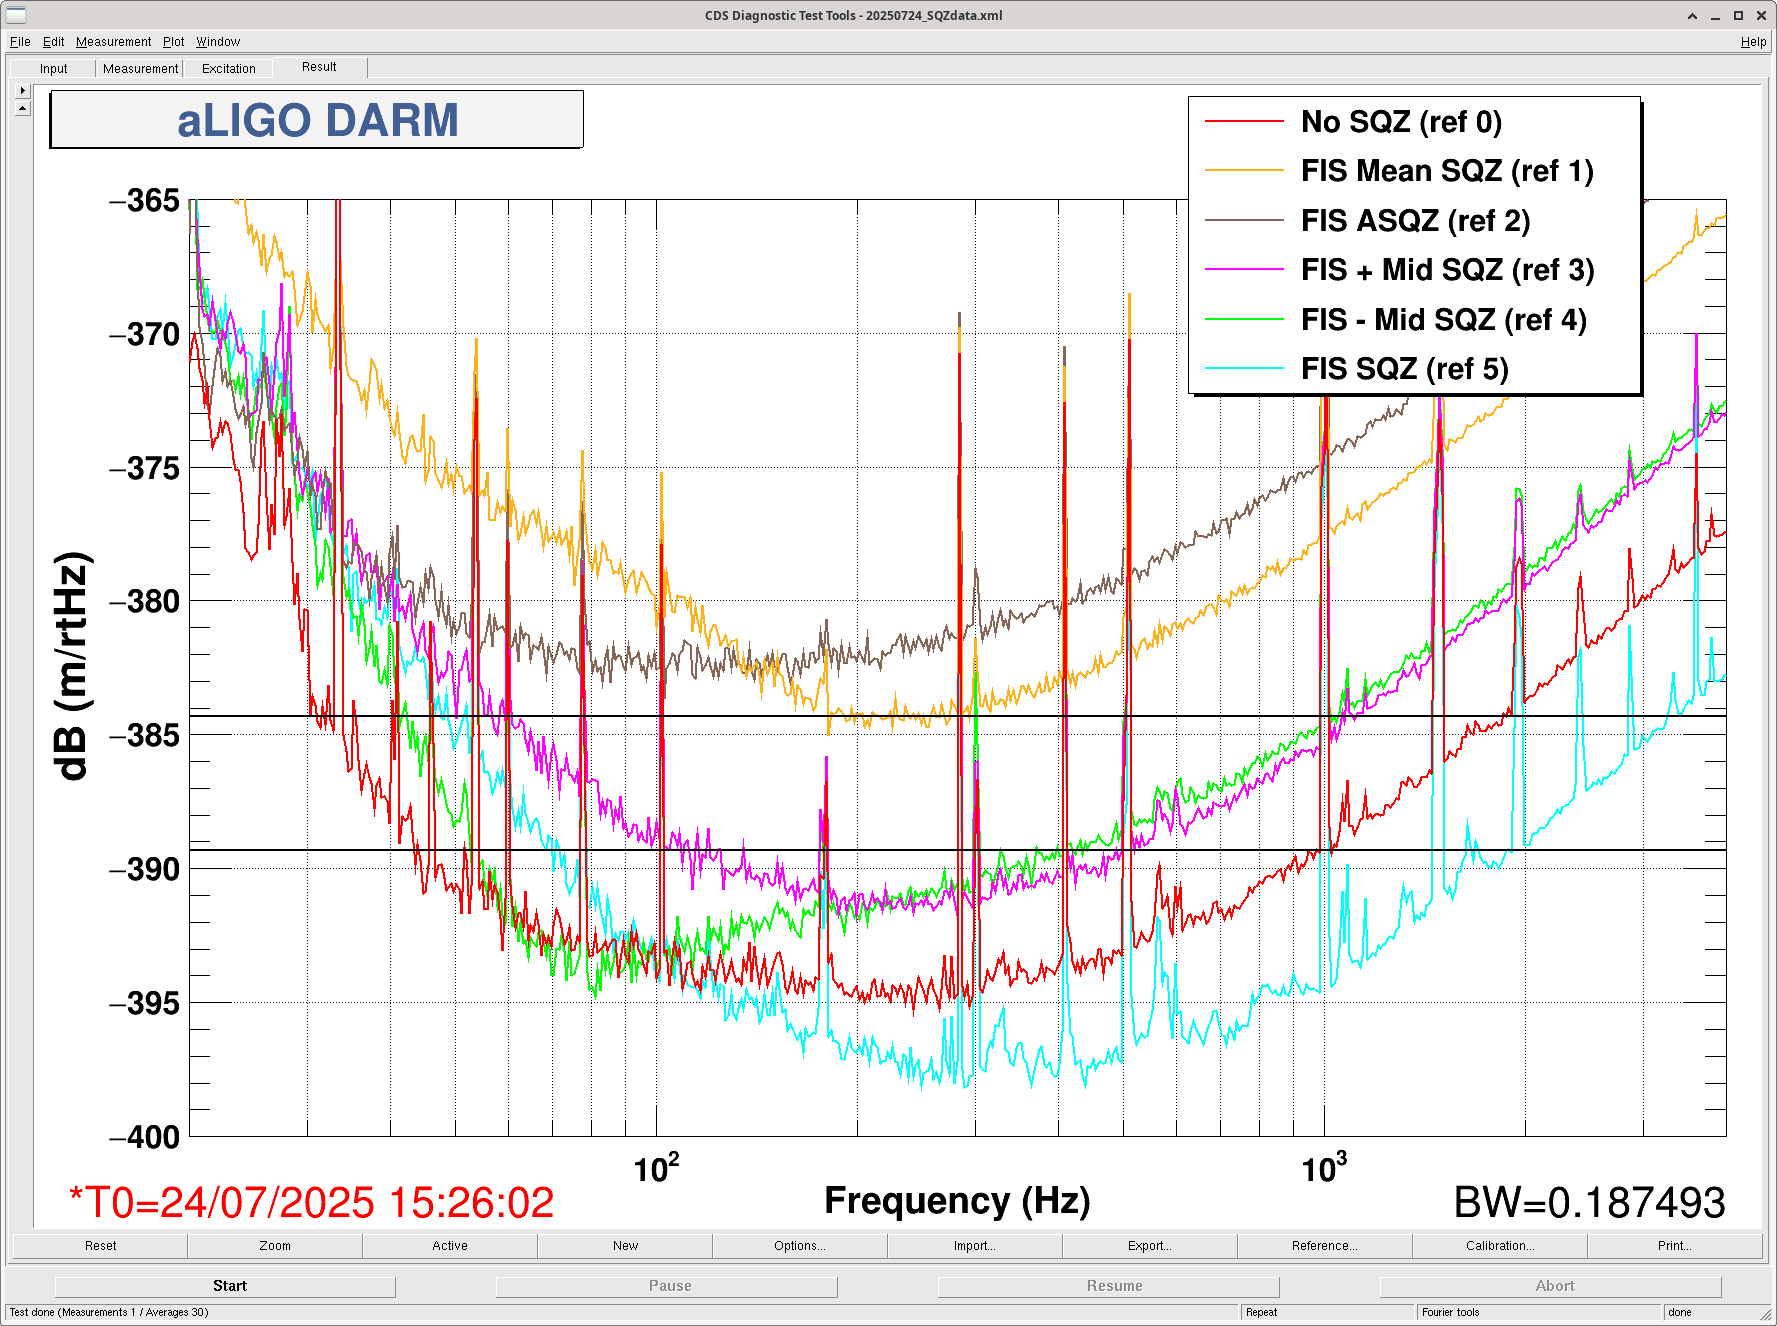
Sheila, Camilla
/ligo/home/camilla.compton/sqz/templates/dtt/20250724_SQZdata.xml screenshot attached and /ligo/home/sheila.dwyer/Noise_Budget_repos/quantumnoisebudgeting/data_files/higher_order_modes_sqzdataset.xml screenshot attached.| Type | Time (UTC) | Angle | DTT Ref in SQZ | DTT ref in HOM |
| No SQZ | 15:20:00 -15:37:00 | N/A | ref 0 | ref 0,1 |
| FIS Mean SQZ (no ADF) | 15:44:30 - 15:49:30 | N/A | ref 1 | ref 2,3 |
| FIS ASQZ | 15:52:30 - 15:55:30 | (+)245 | ref 2 | ref 4,5 |
| FIS Mid + SQZ | 15:57:00 - 16:00:00 | (-) 260 | ref 3 | ref 6,7 |
| FIS Mid - SQZ | 16:30:00 - 16:03:30 | (-) 110 | ref 4 | ref 8,9 |
| FIS SQZ (tuned for high freq) | 16:06:00 - 16:09:00 | (-) 150 | ref 5 | ref 10,11 |
| OPO Setpoint | Amplified Max | Amplified Min | UnAmp | Dark | NLG | OPO Gain | Note |
| 80uW | 0.09708 | 0.002293 | 0.007017 | -2.58e-5 | 13.8 | -8 | With changing OPO temp |
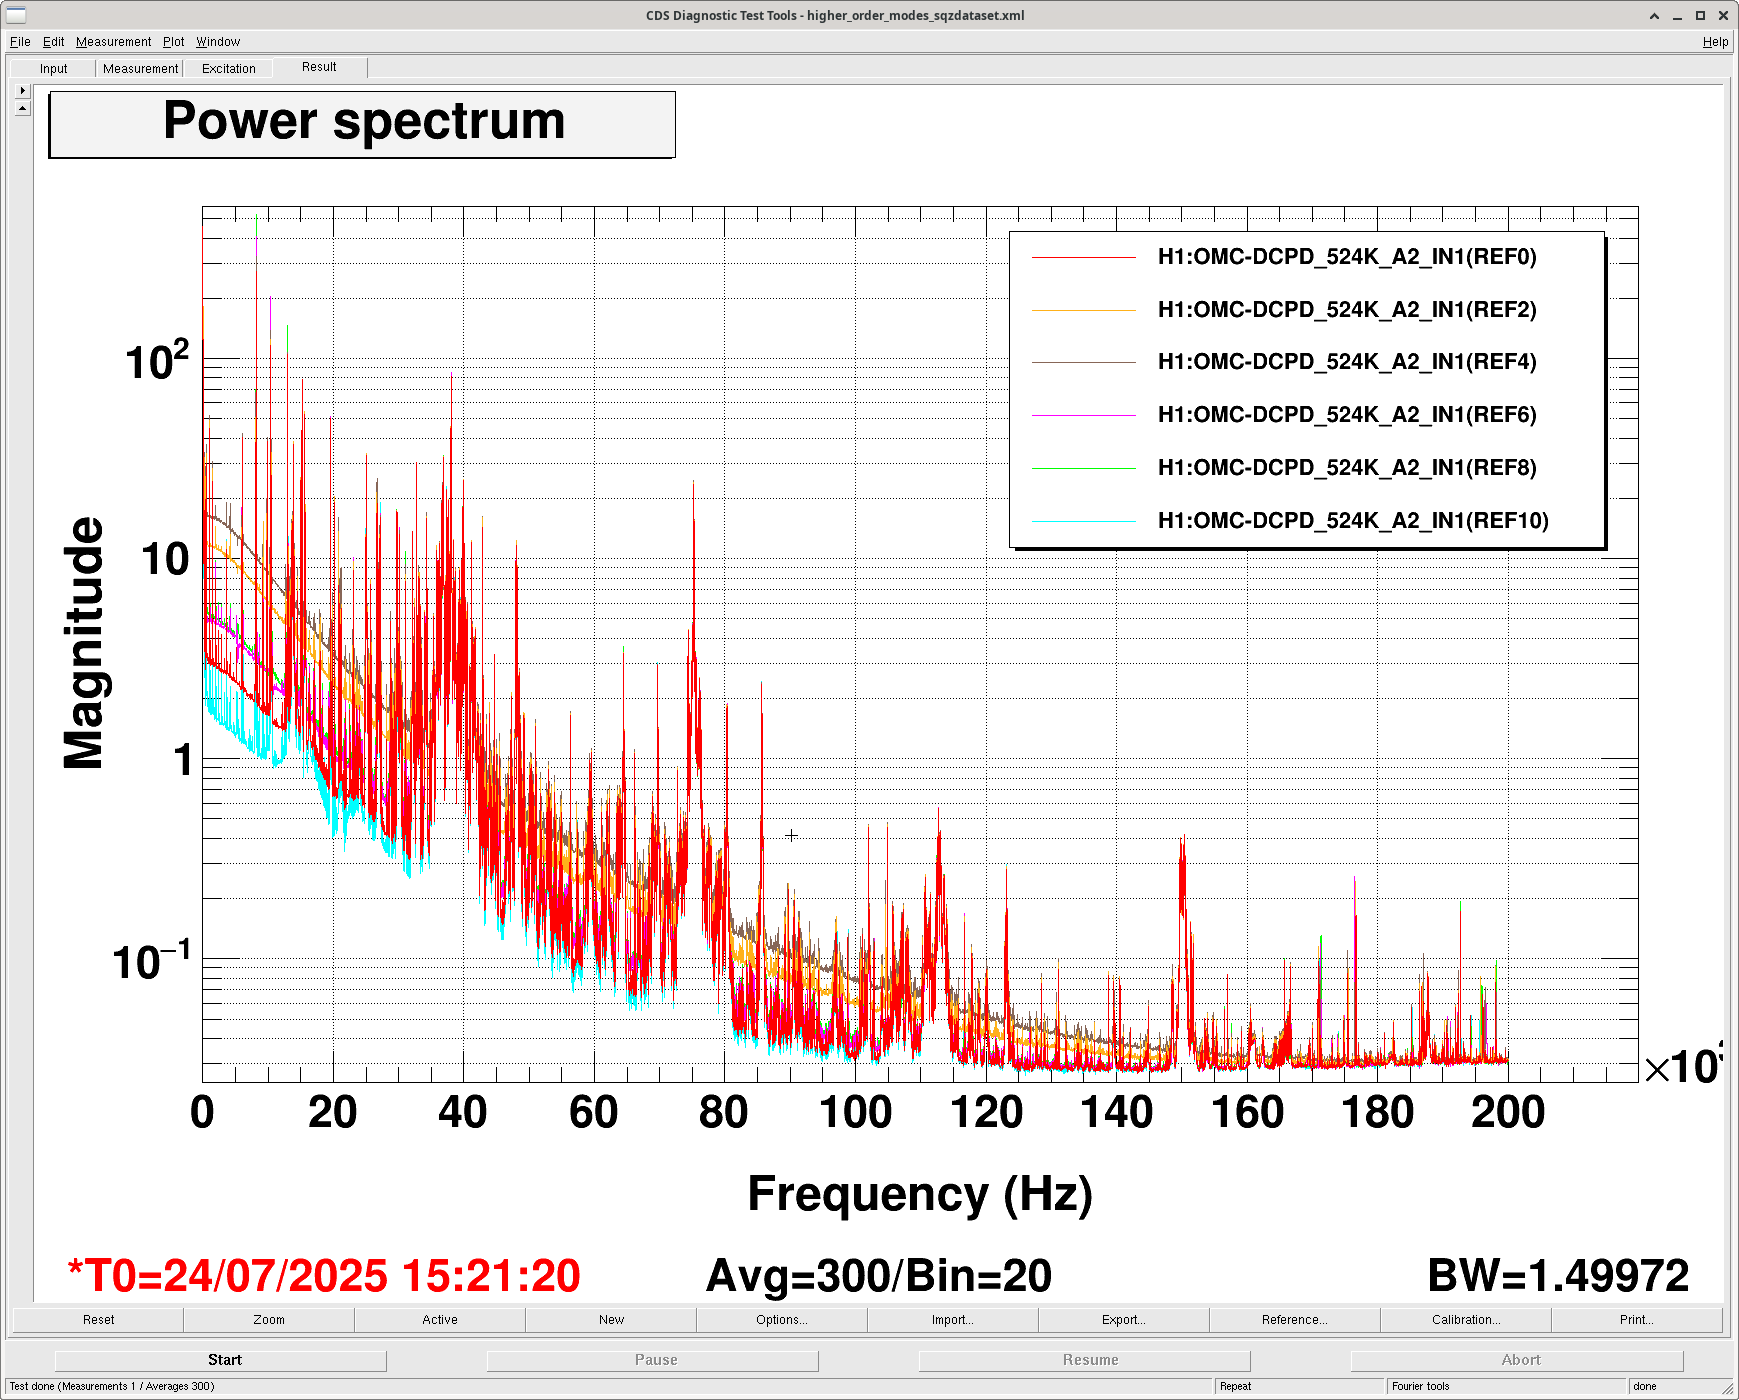
Sheila and Matt point out that the HOM at 5kHz and 10kHz are clear to see, see attached.

TITLE: 07/24 Day Shift: 1430-2330 UTC (0730-1630 PST), all times posted in UTC
STATE of H1: Observing at 153Mpc
OUTGOING OPERATOR: Ryan S
CURRENT ENVIRONMENT:
SEI_ENV state: CALM
Wind: 4mph Gusts, 1mph 3min avg
Primary useism: 0.02 μm/s
Secondary useism: 0.06 μm/s
QUICK SUMMARY: Locked for 13 hours. Temps look good, no alarms, calm environment. Planned calibration and commissioning time today from 1500-1930UTC (0800-1230PT).
TITLE: 07/24 Eve Shift: 2330-0500 UTC (1630-2200 PST), all times posted in UTC
STATE of H1: Observing at 148Mpc
INCOMING OPERATOR: Ryan S
SHIFT SUMMARY: One lockloss with an automated recovery. We've been locked for 3.5 hours.
LOG: NO log.
These are the remainder of the noise comparison plots for before and after the sat amp swaps for TMSX and ETMX M0/R0/L1. These swaps were done for TMSX, ETMX M0/R0/L1, MC2, and PR2 on July 15 (85770). I posted noise comparison plots for MC2 and PR2 (85786), but we didn't yet have a good 'after' time where End X wasn't in maintenance, going through an earthquake, or moving stuff around for relocking. Now we have had a good time stretch, so here are the results:
Note: For ETMX L1, there are no DAMP channels, so instead I looked at the WIT_{L,P,Y} channels. Not sure how accurate these are. The edits to make this possible in the script /ligo/svncommon/SusSVN/sus/trunk/Common/MatlabTools/damp_regression_compare.m have been svn'd as r12483
TMSX
Results
/ligo/svncommon/SusSVN/sus/trunk/TMTS/H1/TMSX/SAGM1/Results/allDampRegressCompare_H1SUSTMSX_M1_NoiseComparison_1435150628vs1437199319-1200.pdf
r12479
Data
/ligo/svncommon/SusSVN/sus/trunk/TMTS/H1/TMSX/SAGM1/Data/dampRegress_H1SUSTMSX_M1_1435150628_1200.mat
/ligo/svncommon/SusSVN/sus/trunk/TMTS/H1/TMSX/SAGM1/Data/dampRegress_H1SUSTMSX_M1_1437199319_1200.mat
r12479
ETMX
M0
Results
/ligo/svncommon/SusSVN/sus/trunk/QUAD/H1/ETMX/SAGM0/Results/allDampRegressCompare_H1SUSETMX_M0_NoiseComparison_1435060998vs1436769334-1200.pdf
r12480
Data
/ligo/svncommon/SusSVN/sus/trunk/QUAD/H1/ETMX/SAGM0/Data/dampRegress_H1SUSETMX_M0_1435060998_1200.mat
/ligo/svncommon/SusSVN/sus/trunk/QUAD/H1/ETMX/SAGM0/Data/dampRegress_H1SUSETMX_M0_1436769334_1200.mat
r12480
R0
Results
/ligo/svncommon/SusSVN/sus/trunk/QUAD/H1/ETMX/SAGR0/Results/allDampRegressCompare_H1SUSETMX_R0_NoiseComparison_1435060998vs1436769334-1200.pdf
r12841
Data
/ligo/svncommon/SusSVN/sus/trunk/QUAD/H1/ETMX/SAGR0/Data/dampRegress_H1SUSETMX_R0_1435060998_1200.mat
/ligo/svncommon/SusSVN/sus/trunk/QUAD/H1/ETMX/SAGR0/Data/dampRegress_H1SUSETMX_R0_1436769334_1200.mat
r12481
L1
Results
/ligo/svncommon/SusSVN/sus/trunk/QUAD/H1/ETMX/SAGL1/Results/allDampRegressCompare_H1SUSETMX_L1_NoiseComparison_1435060998vs1436769334-1200.pdf
r12482
Data
/ligo/svncommon/SusSVN/sus/trunk/QUAD/H1/ETMX/SAGL1/Data/dampRegress_H1SUSETMX_L1_1435060998_1200.mat
/ligo/svncommon/SusSVN/sus/trunk/QUAD/H1/ETMX/SAGL1/Data/dampRegress_H1SUSETMX_L1_1436769334_1200.mat
r12482
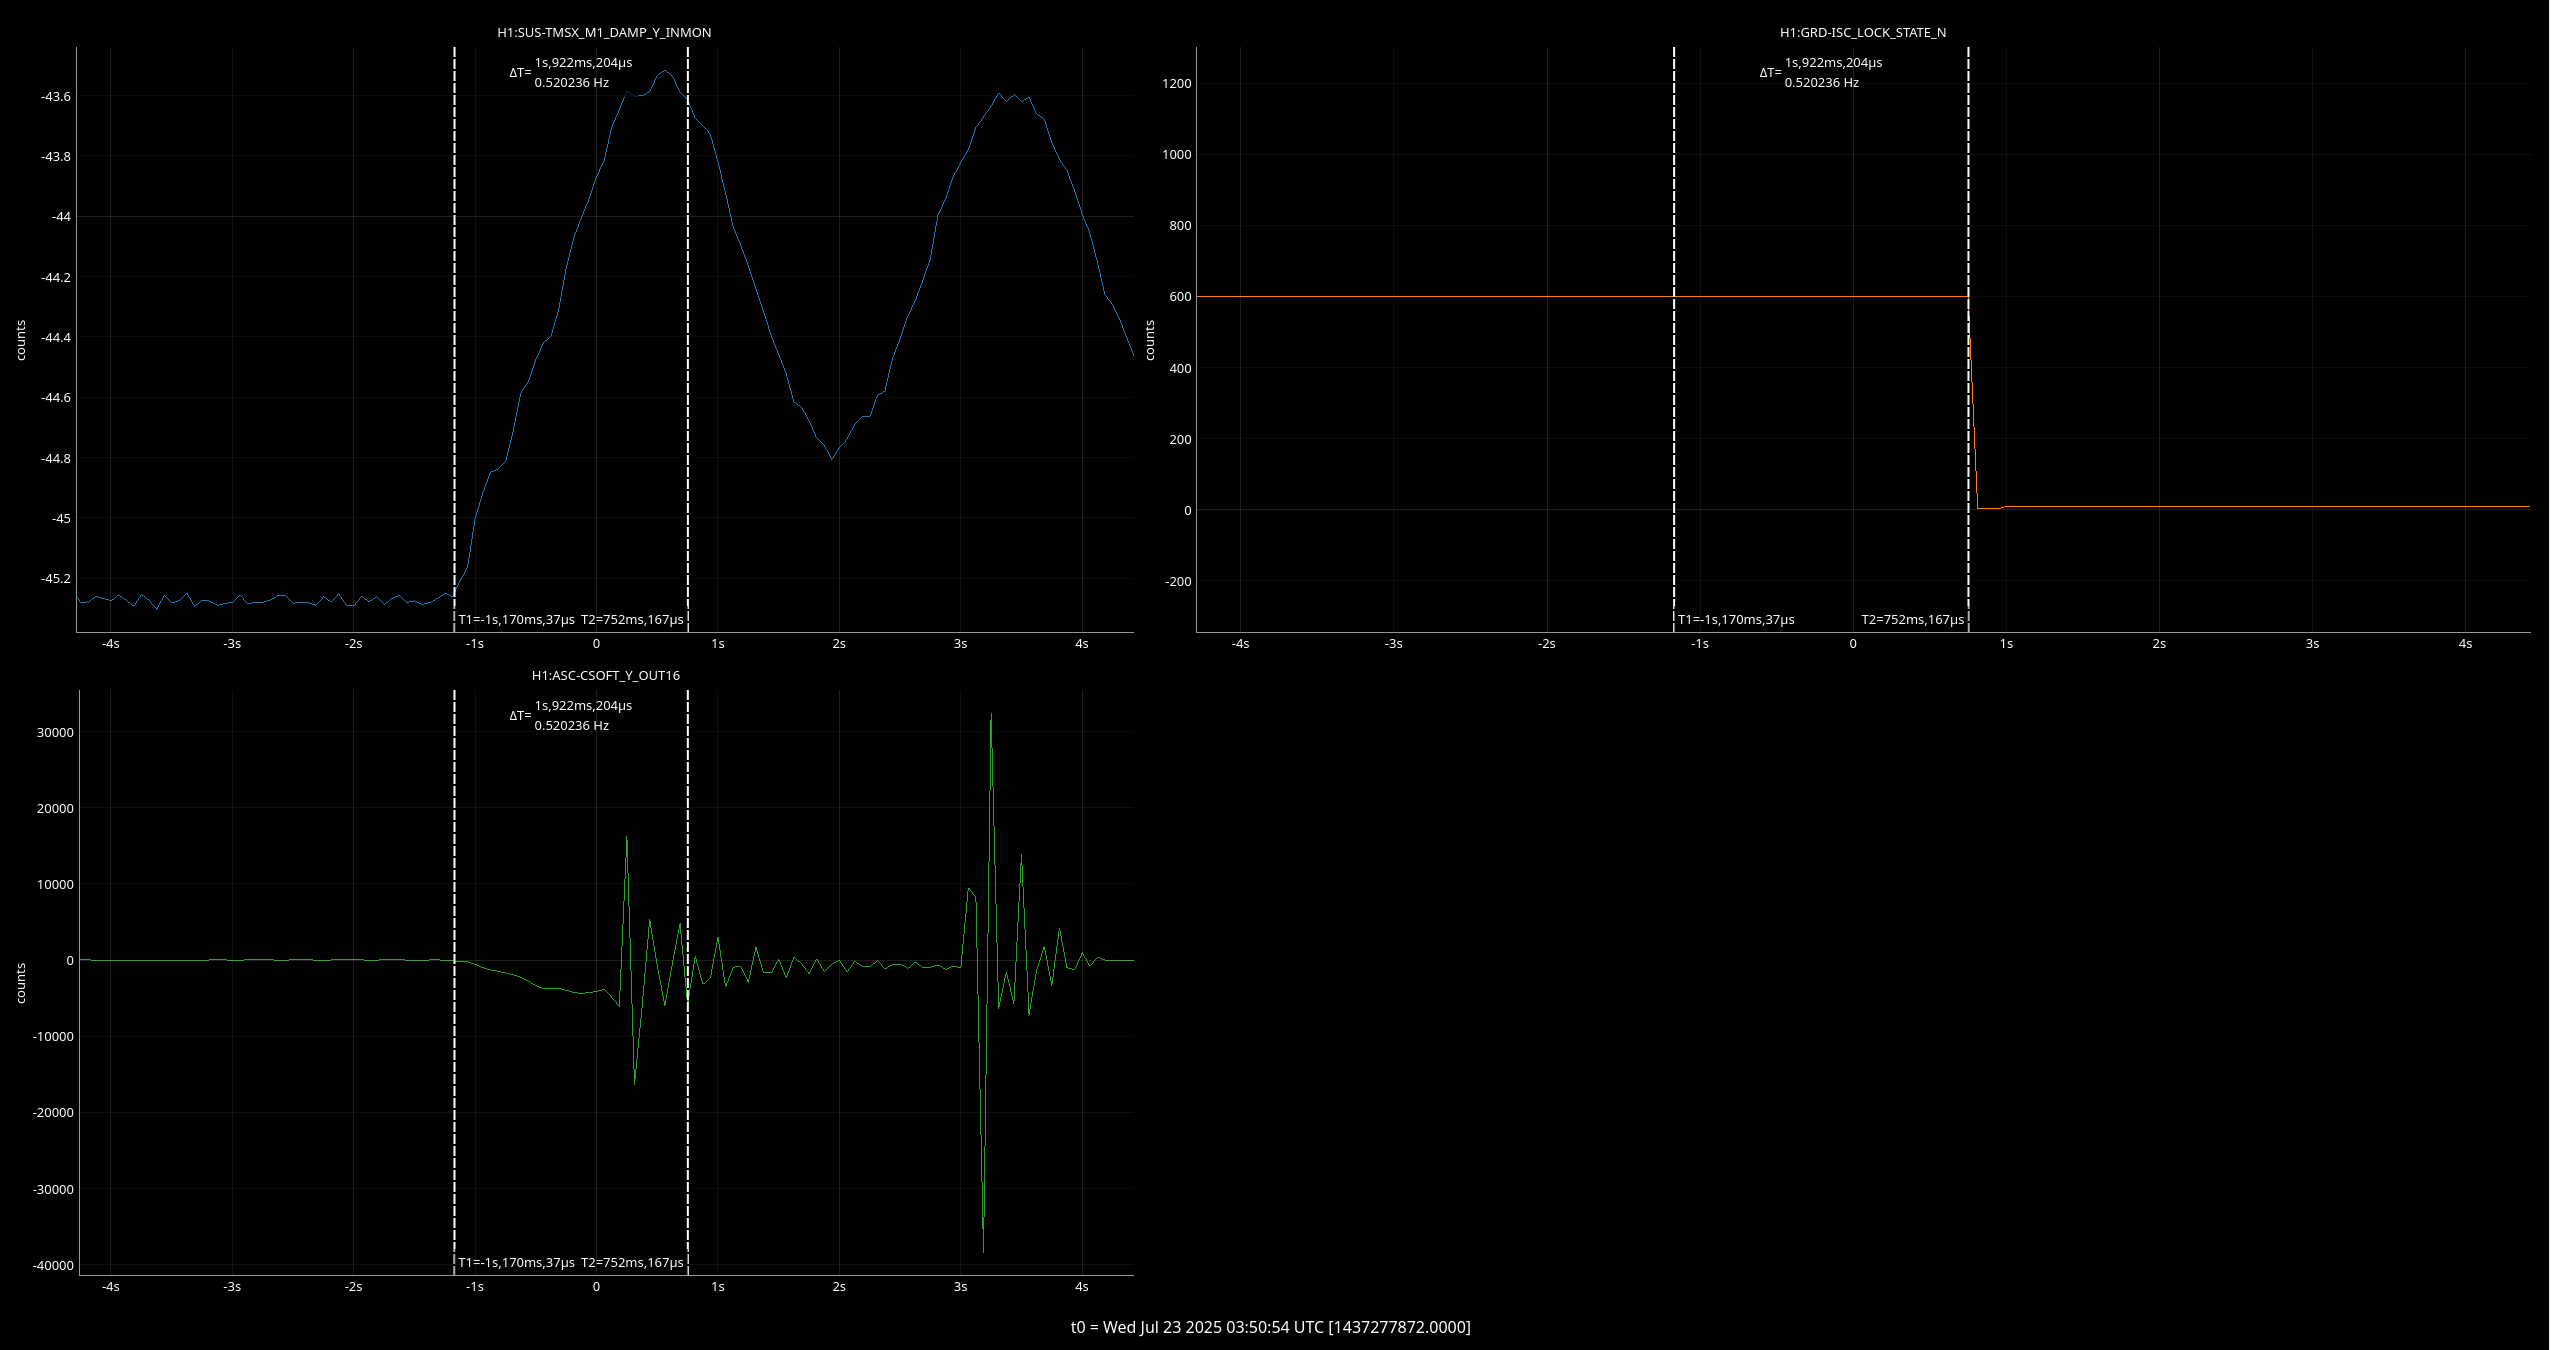
00:08 UTC lockloss after only 4 minutes, wiggle in PR_GAIN right before we lost lock
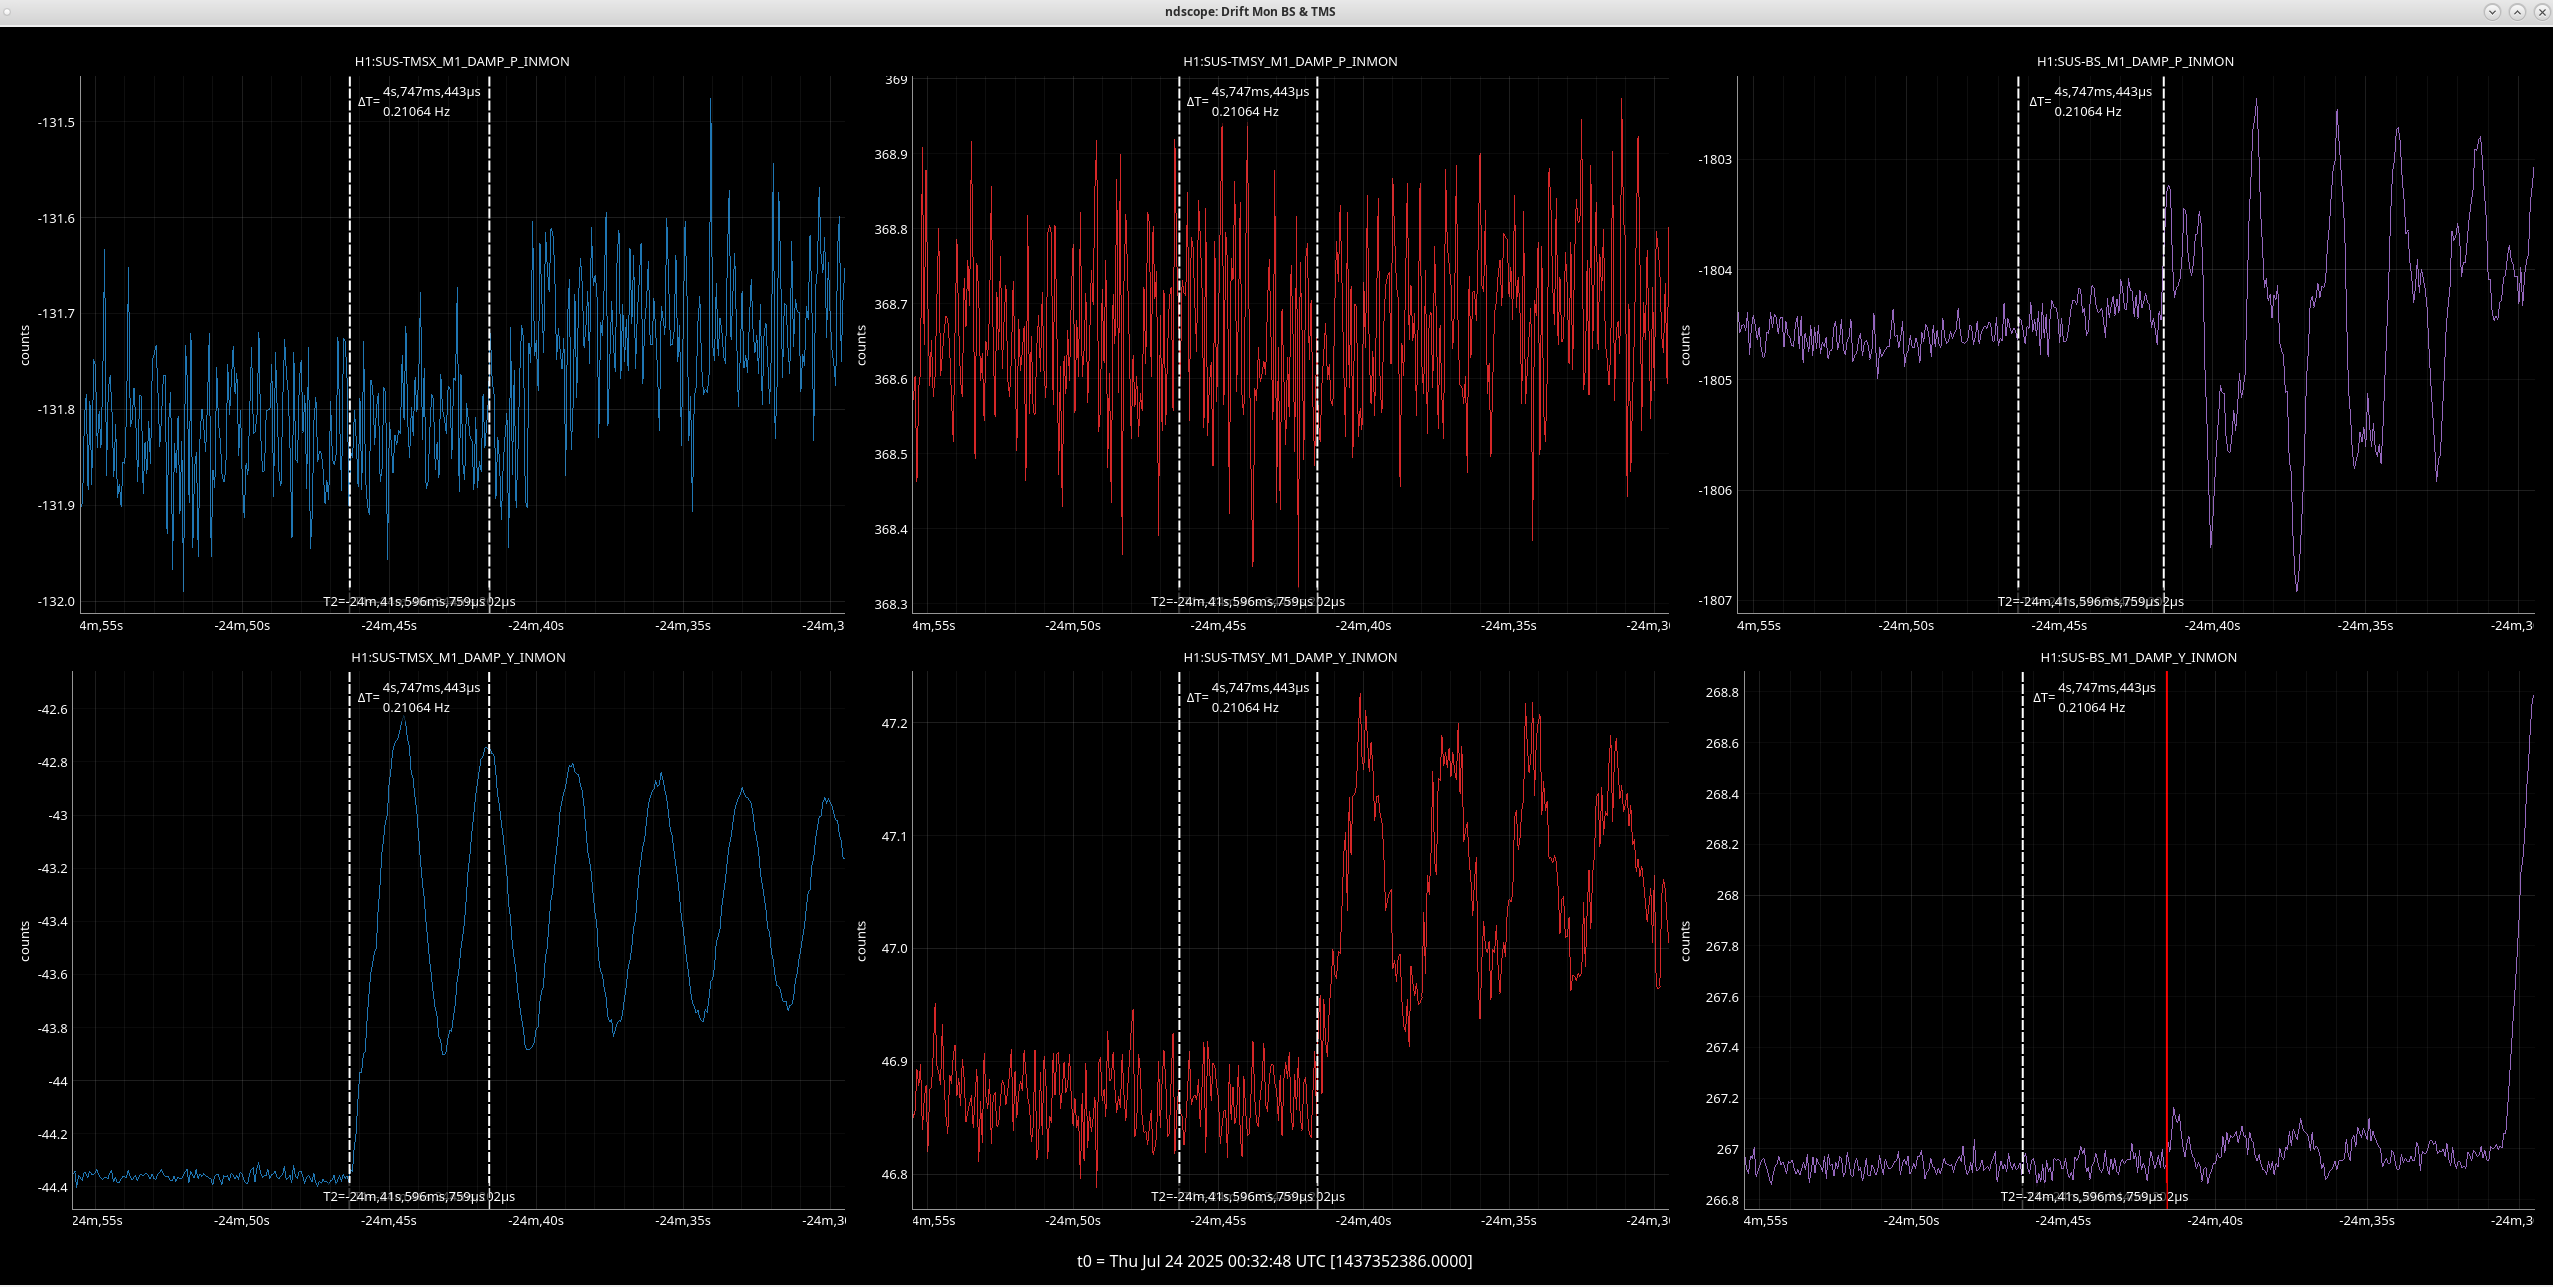
PRC2 and CSOFT Yaw stepped out right before the LL. TMSX_Y started to oscillate 4 seconds before the LL, PM1_Y had an excursion ~3 seconds before the LL.
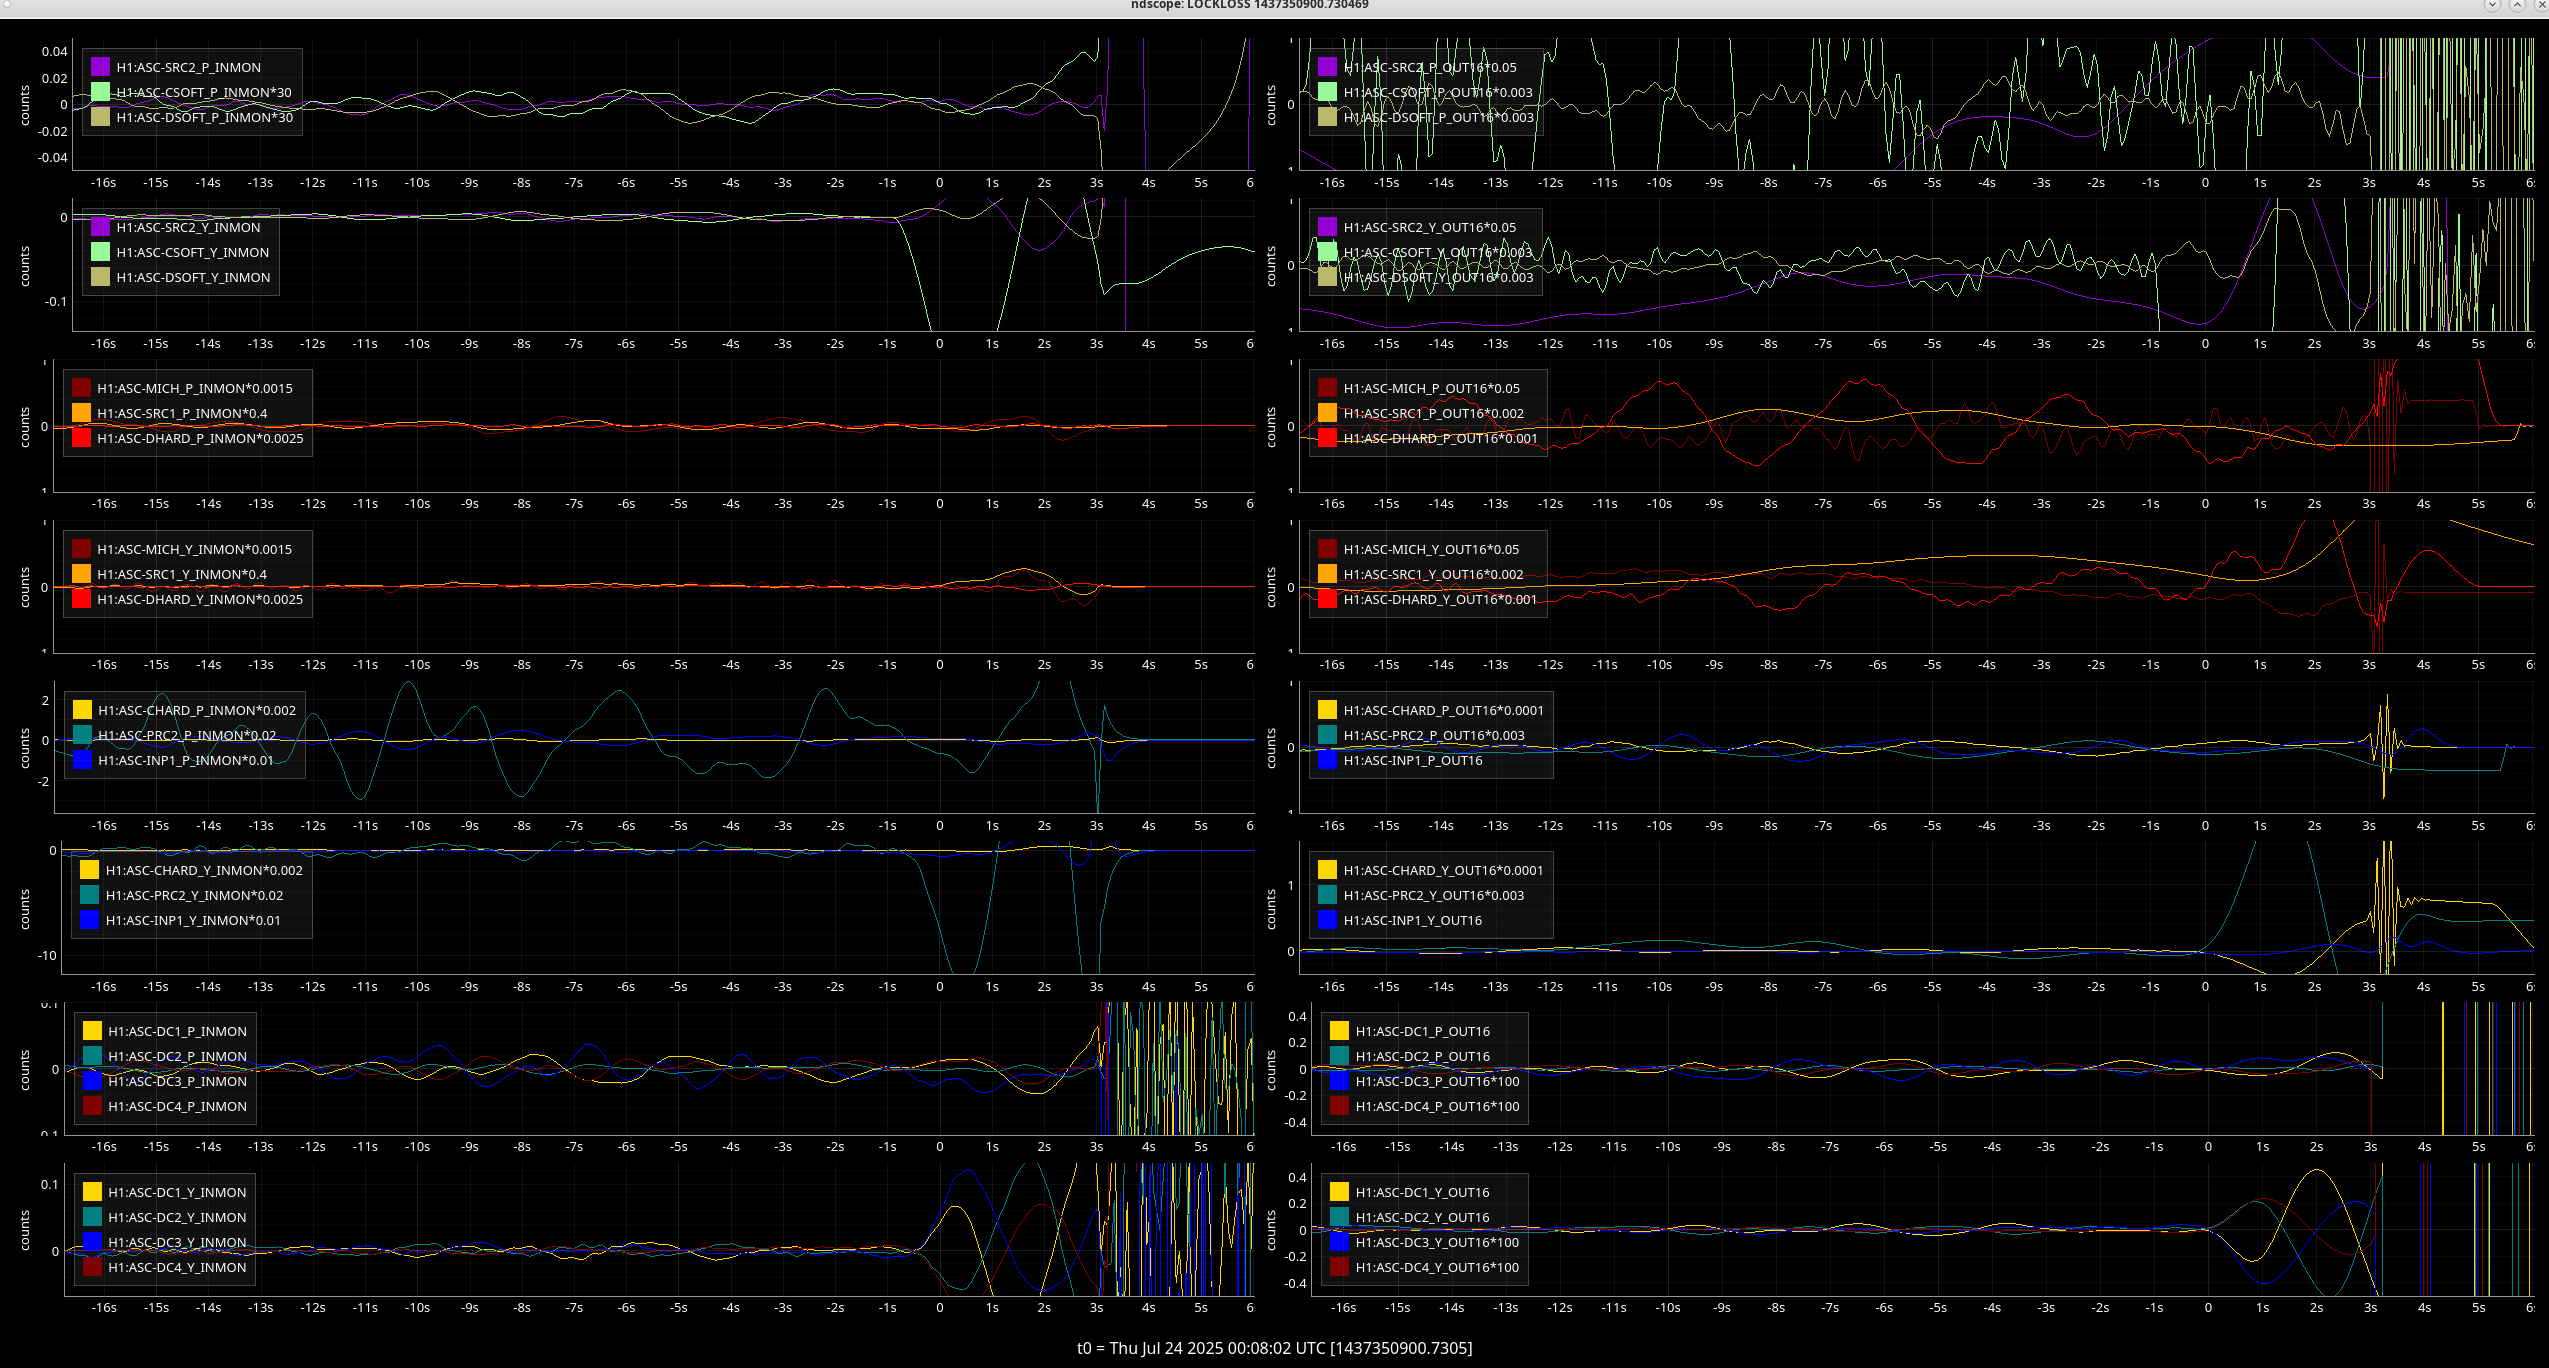
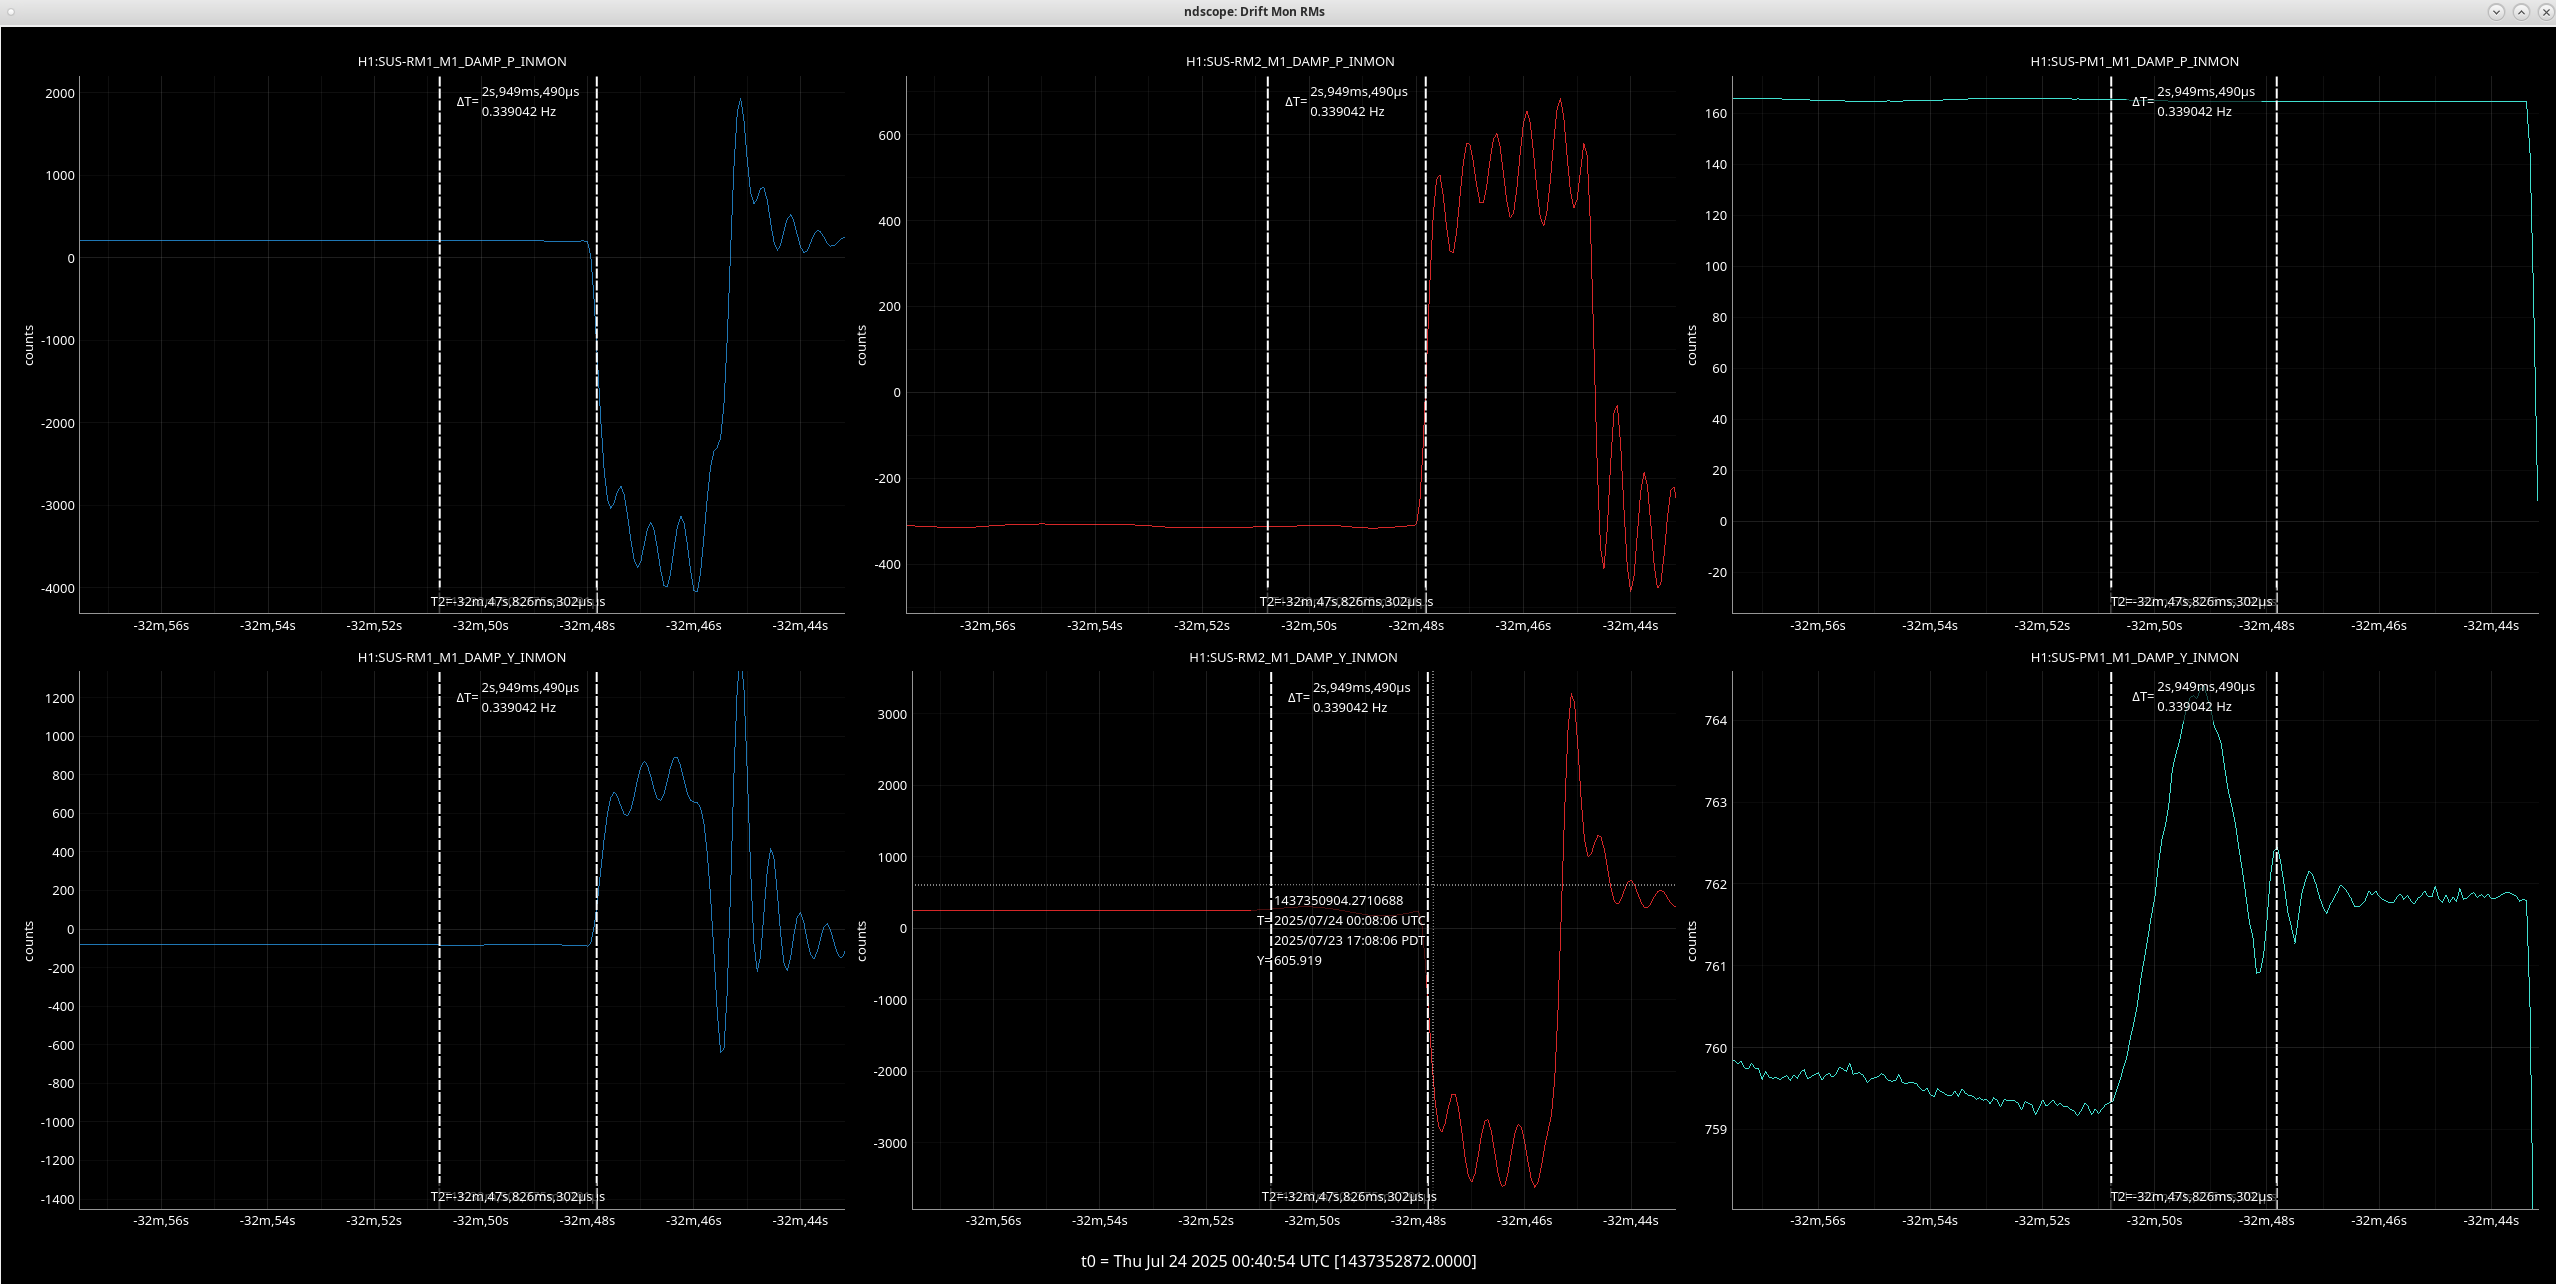
Looking at all the suspicious things together, it looks like TMSX_Y started moving first before any of the ASC loops? Only ~100ms before CSOFT started moving.
Writting this down for tomorow because we may have to repeat this at some point. We'd like to get a cross correlation measurement to high frequency when the IFO has been thermalized for 4+ hous. Tomorow we can do this earlier in the lock if need be to make sure that everything works.
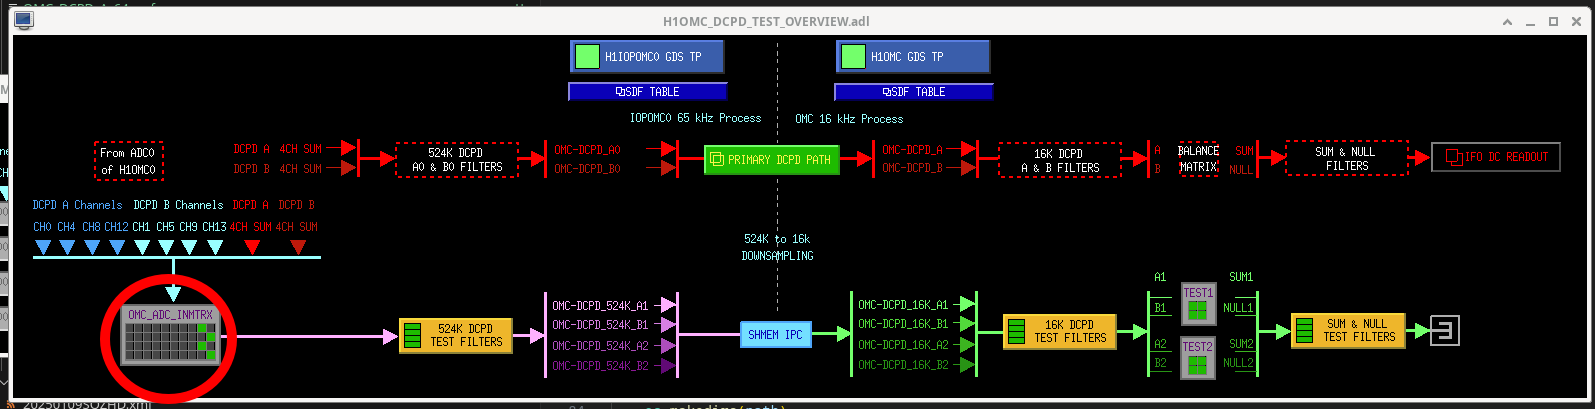
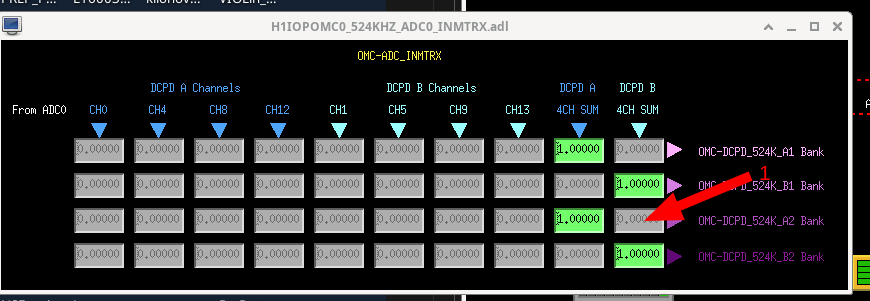
From sitemap OMC > DCPD TEST (at the bottom of list), open the INMTRX circled here, add a 1 where shown here
Take SQZ_MANAGER to NO_SQUEEZING
cd /ligo/home/sheila.dwyer/Noise_Budget_repos/quantumnoisebudgeting
open dtt template in /data_files/higher_order_modes.xml run it at roughly the same time that you run this script adapted from Elena 85817
conda activate labutils
python get_OMCDCPS_524kHz.py
save the dtt template when finished.
Side note, it seems that we can only access two of these 524kHz test points with the script, and also only two at a time with dtt. So we will use dtt to save the sum spectra and the script to save the inidividual PDs.
The python script wouldn't run at first, narrowed it down to the channels it uses. Since these are test points, they were already opened by something else and so the script couldn't use it. I had to clear the test points, via "diag -l -c" then "tpclear 179 *" then it would run. The script and dtt were run at 821PT and saved in the same template.
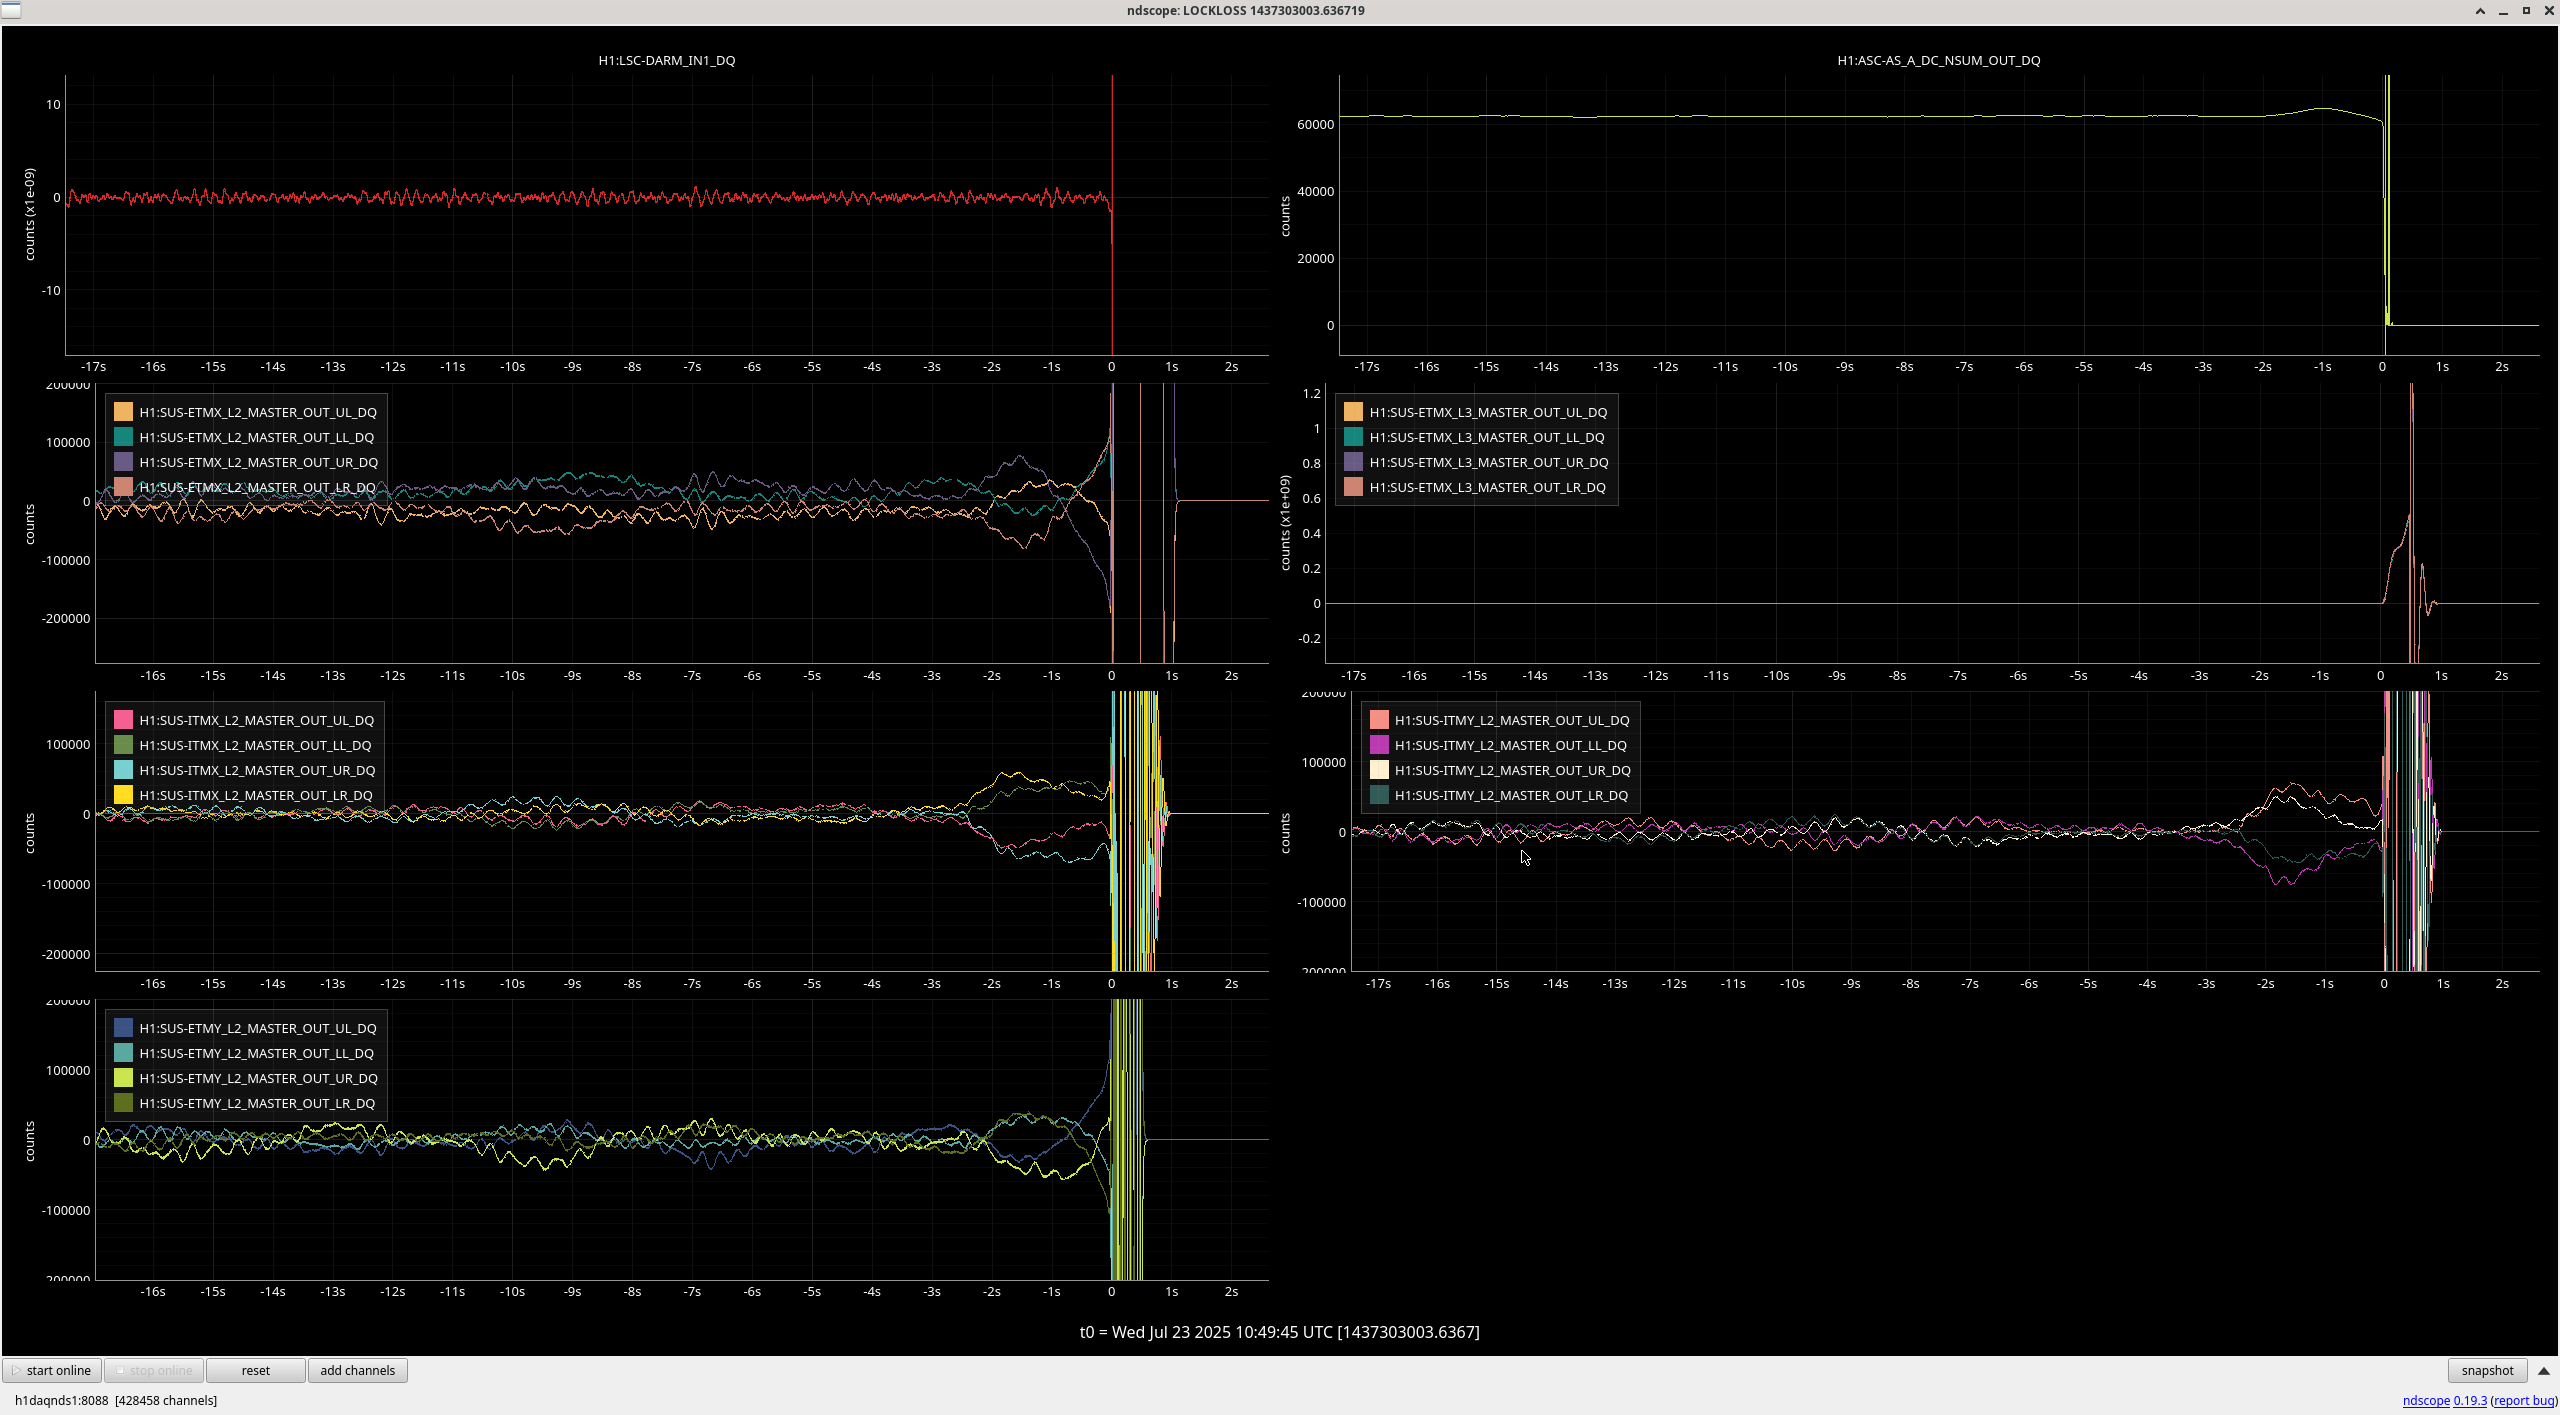
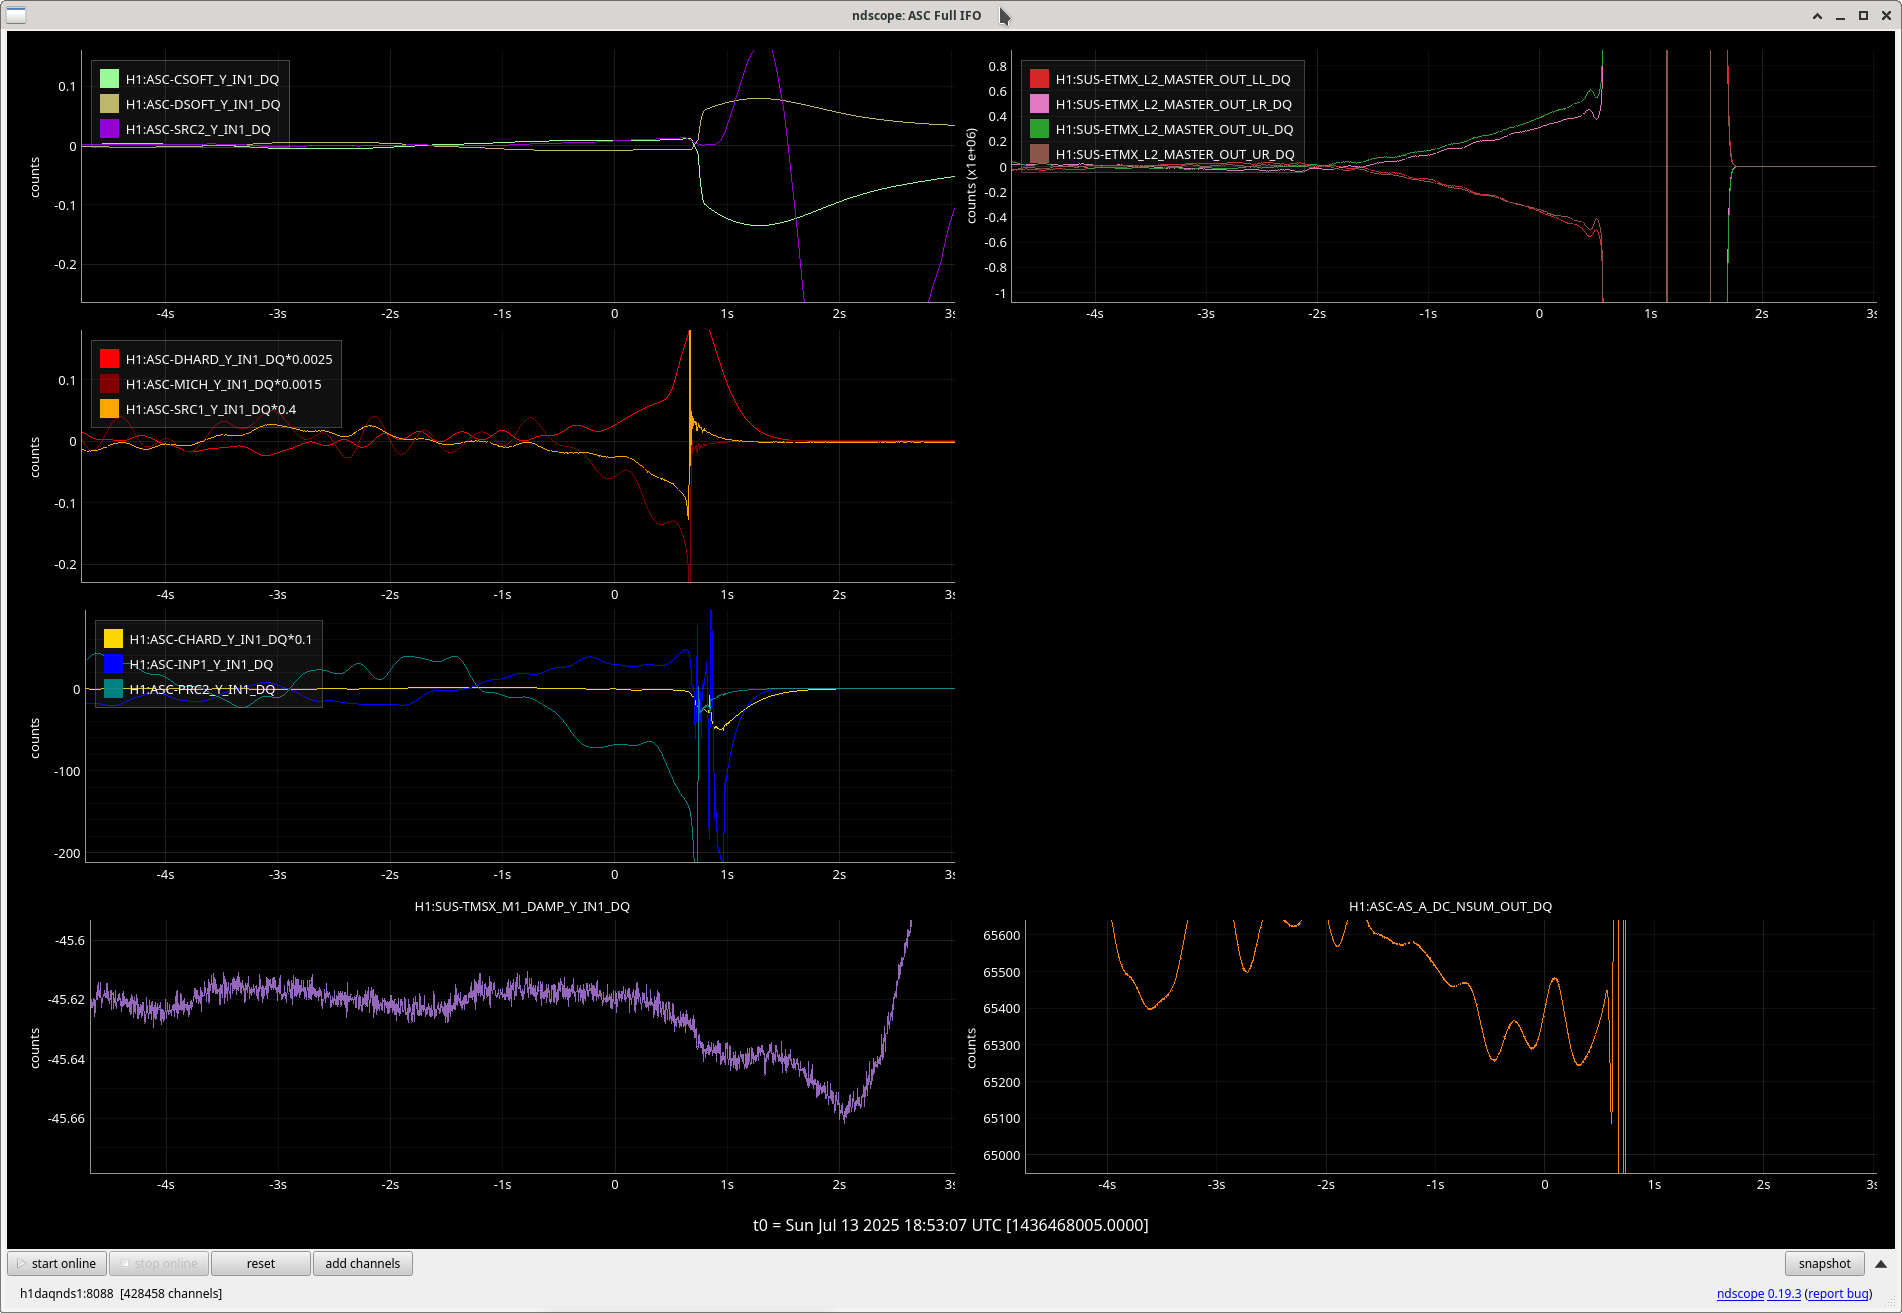
In 85846 on Friday 18th, Elenna notes a lockloss after YAW ASC excursion, we have been having very short locks and I see evidence of two more of these yaw excursion in the last 24 hours:
Seen in CSOFT, SRC1, PRC2 and mainly on the L2 stage of quads. In the last 1-2 seconds before LL.
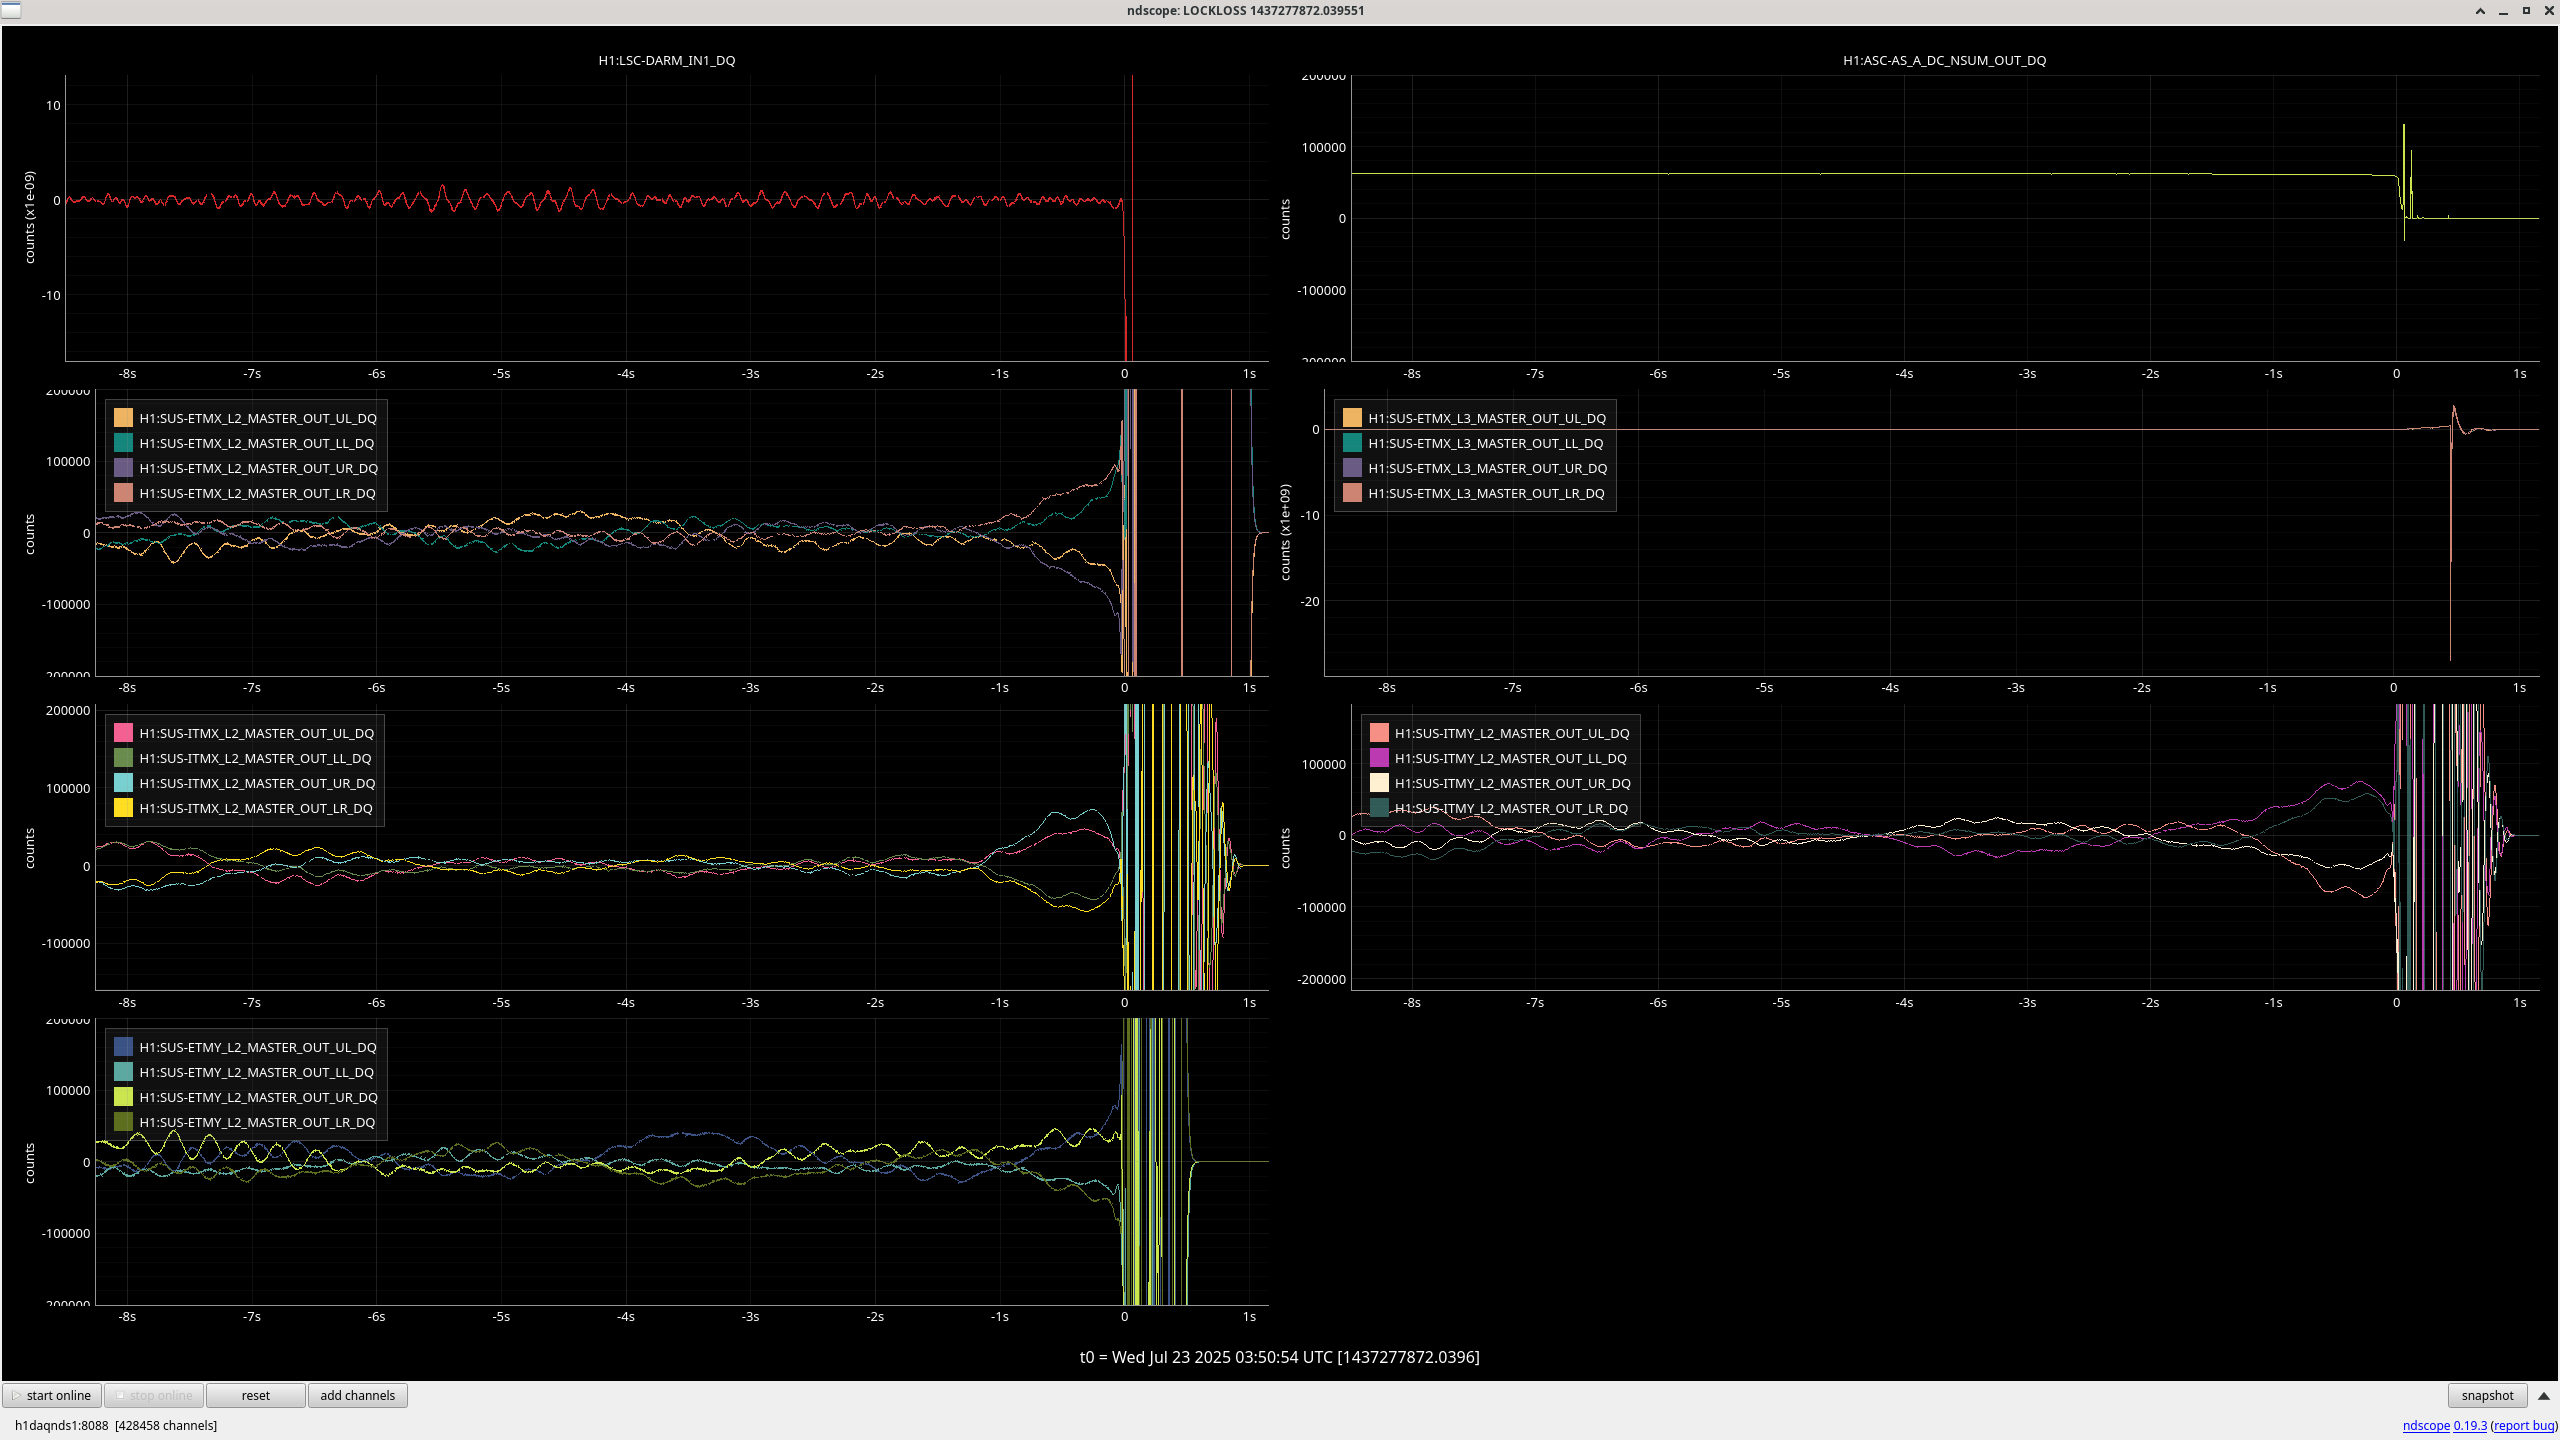
The lockloss that Ryan S. reports as being from a sitewide power glitch in this alog had a similar behavior in the suspension channels and yaw loops. Apparently the power glitch that caused the lockloss also tripped the HEPI pumps, but I'm not sure how that relates to the control loop behavior. I'm not sure if this is useful to link with these other locklosses or not.
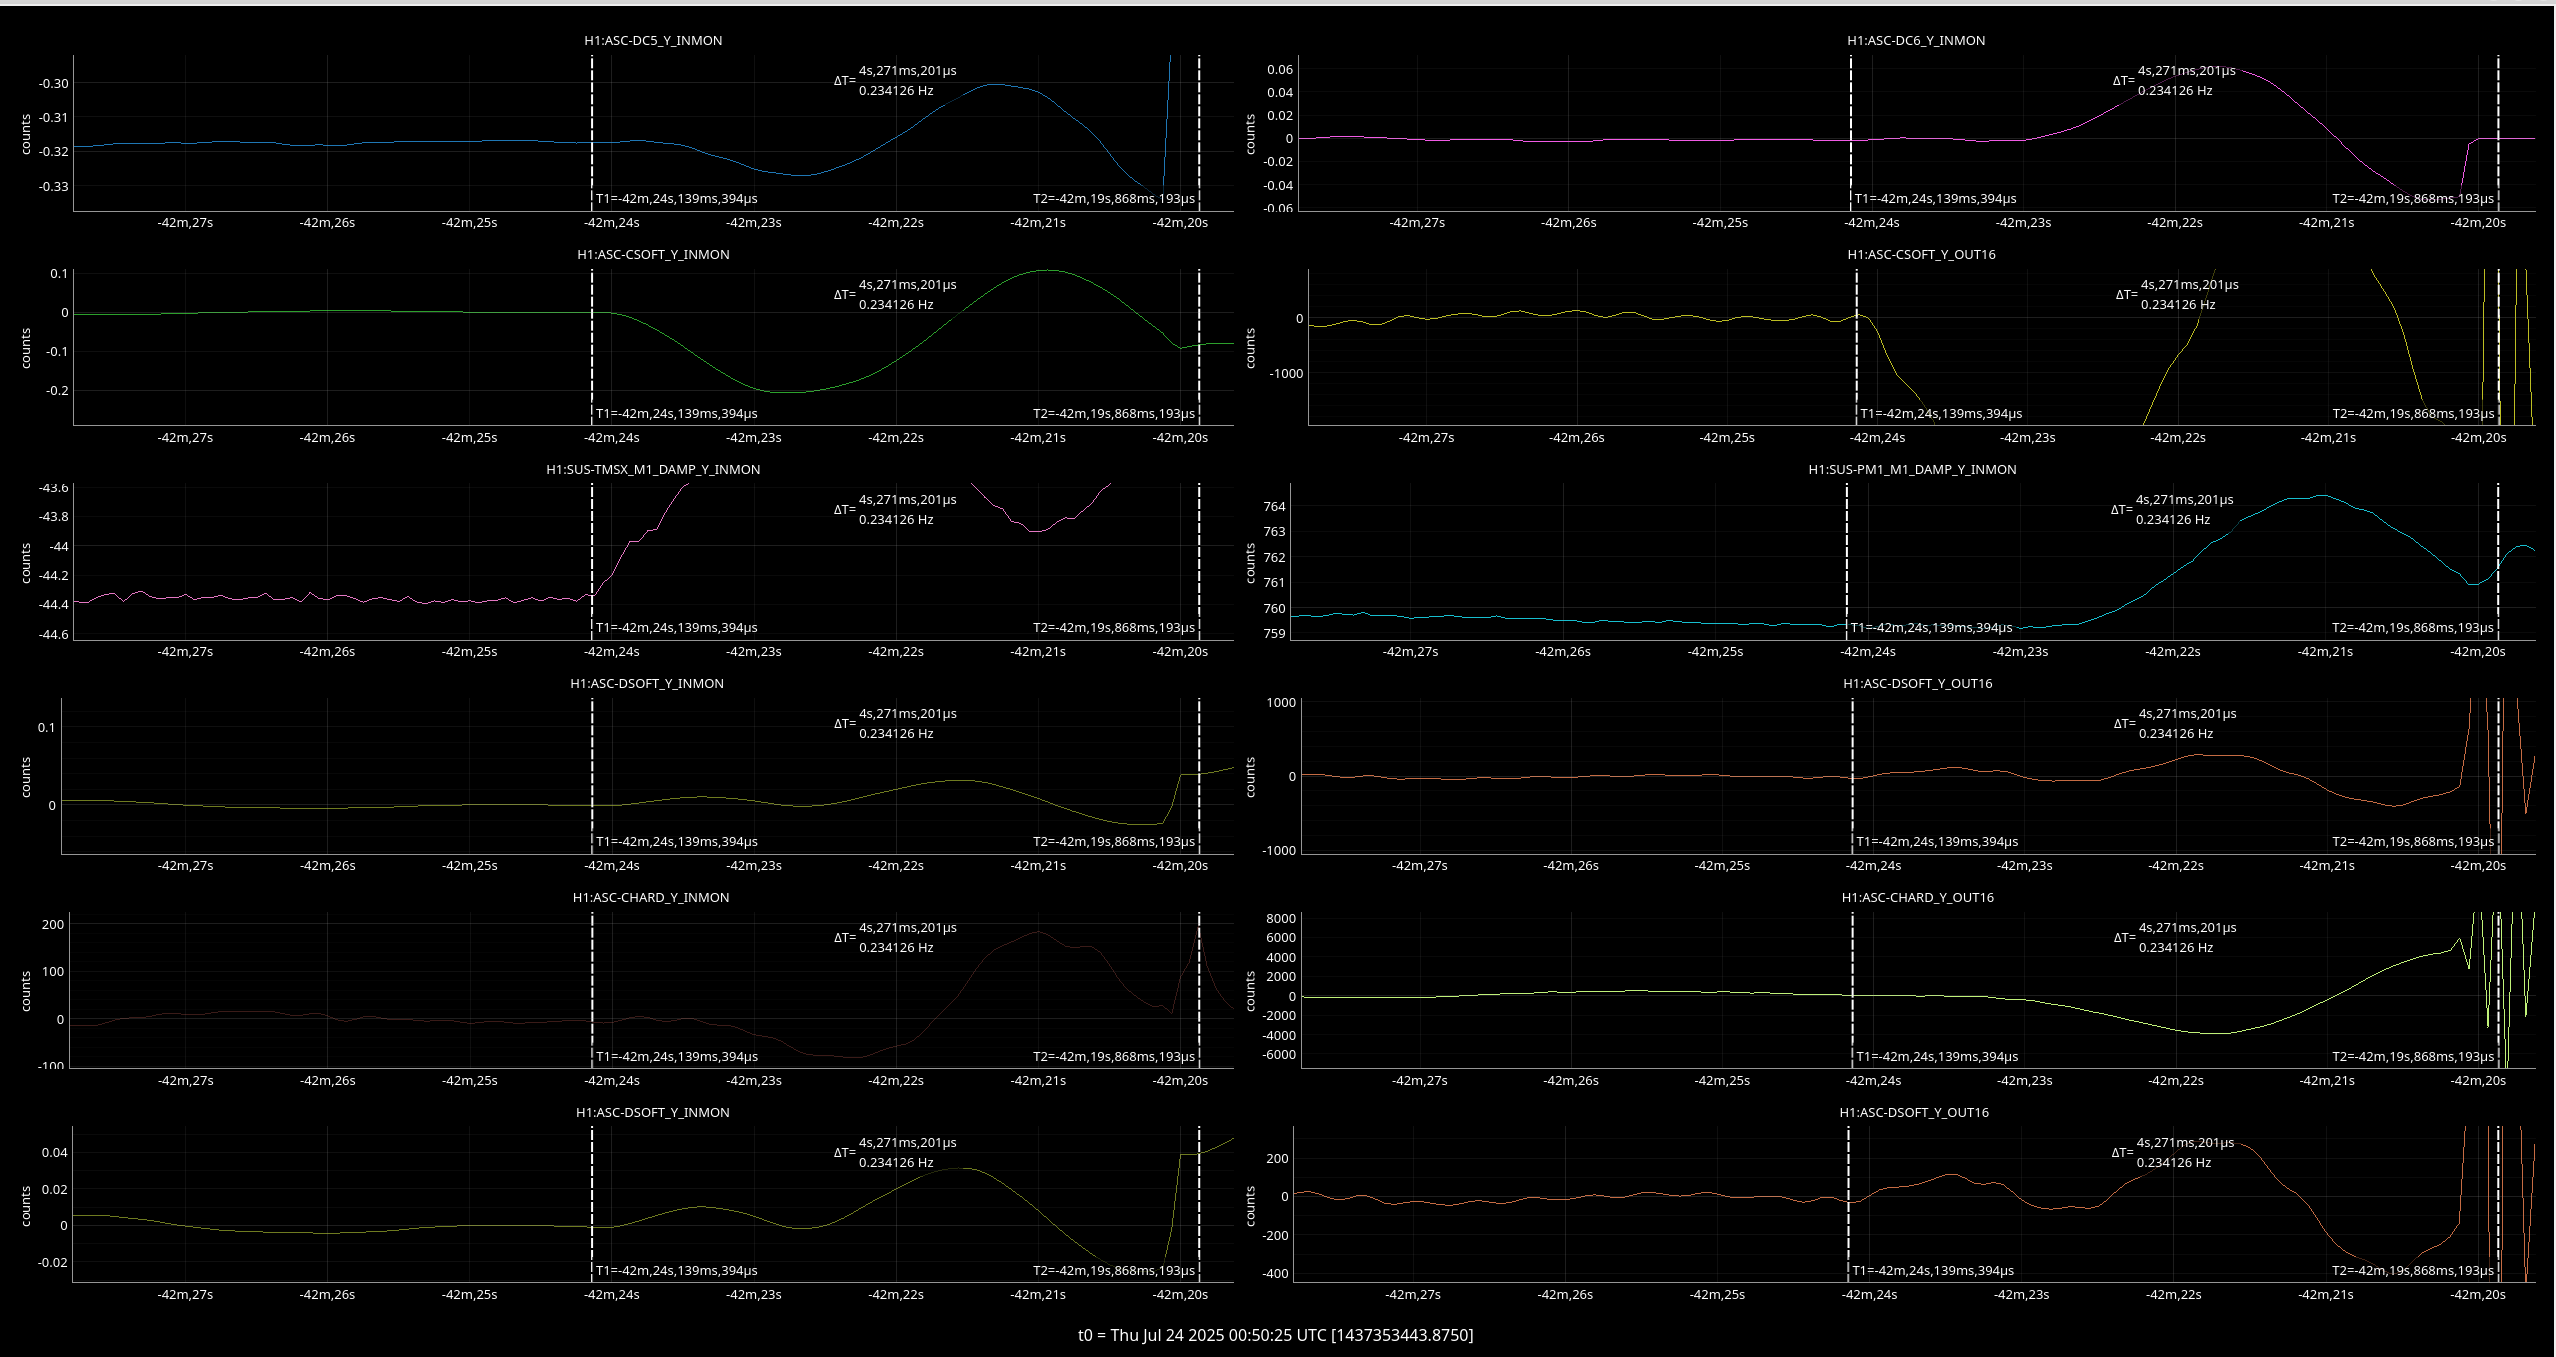
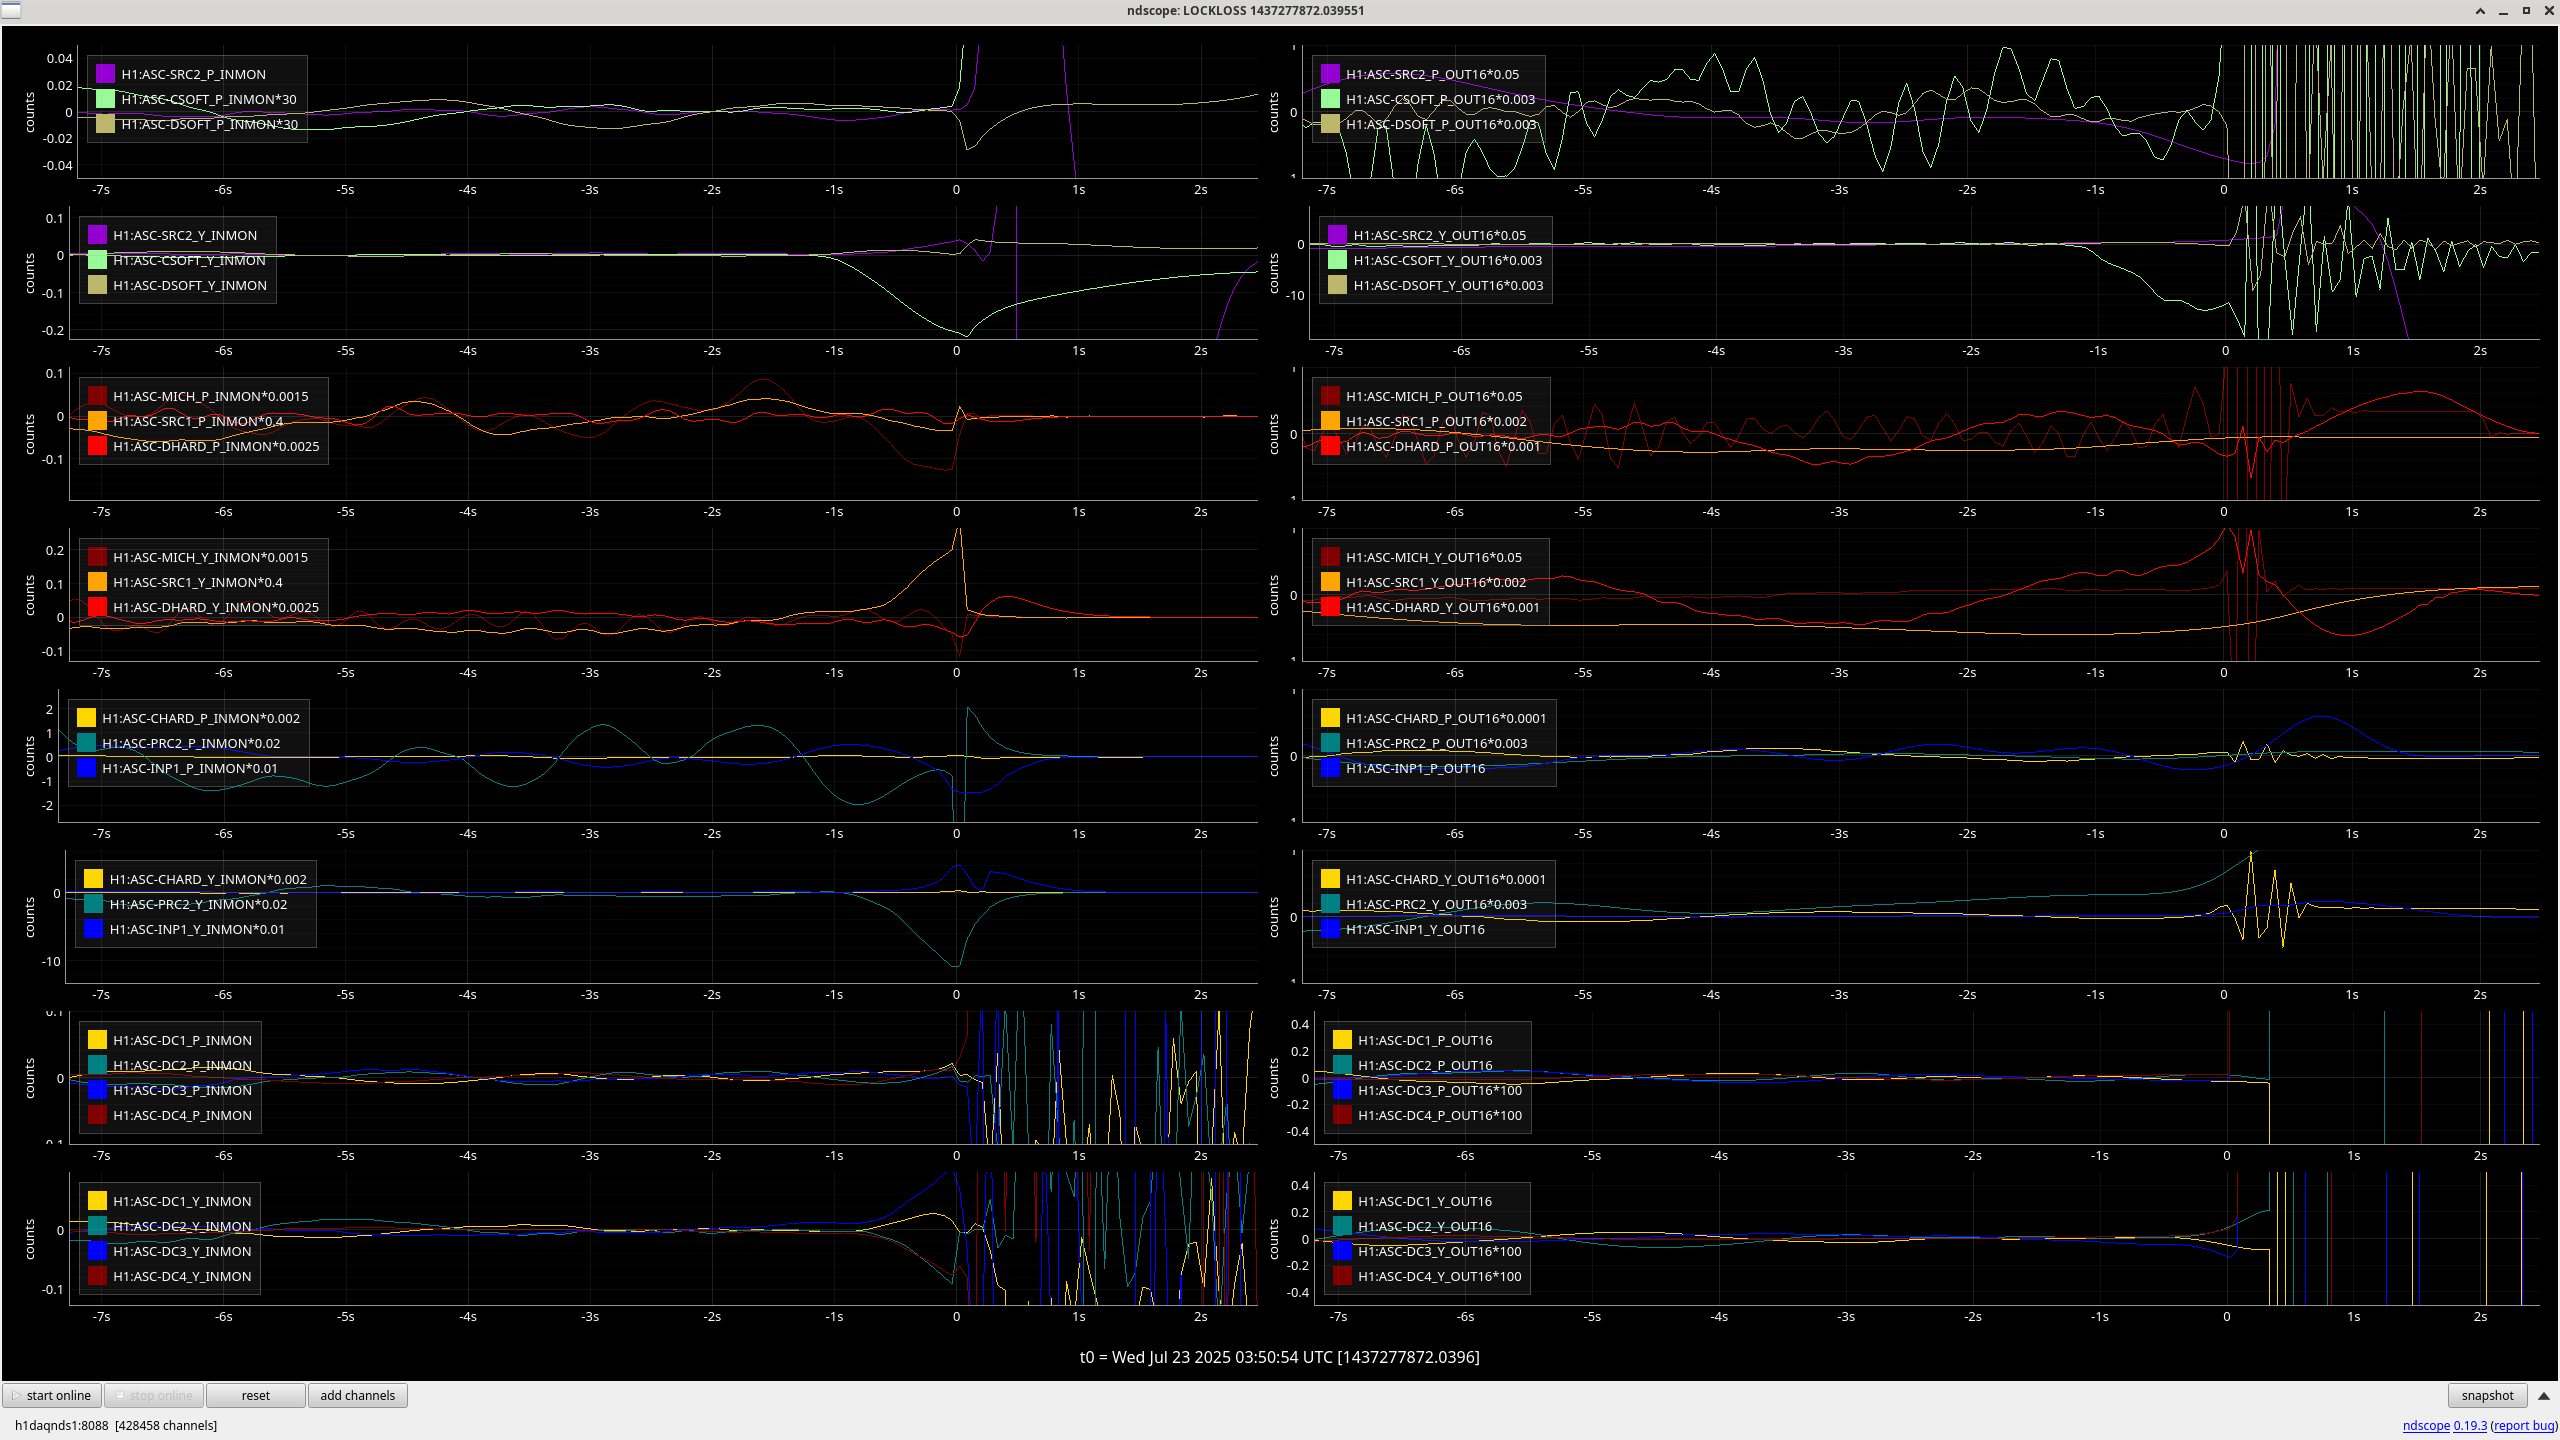
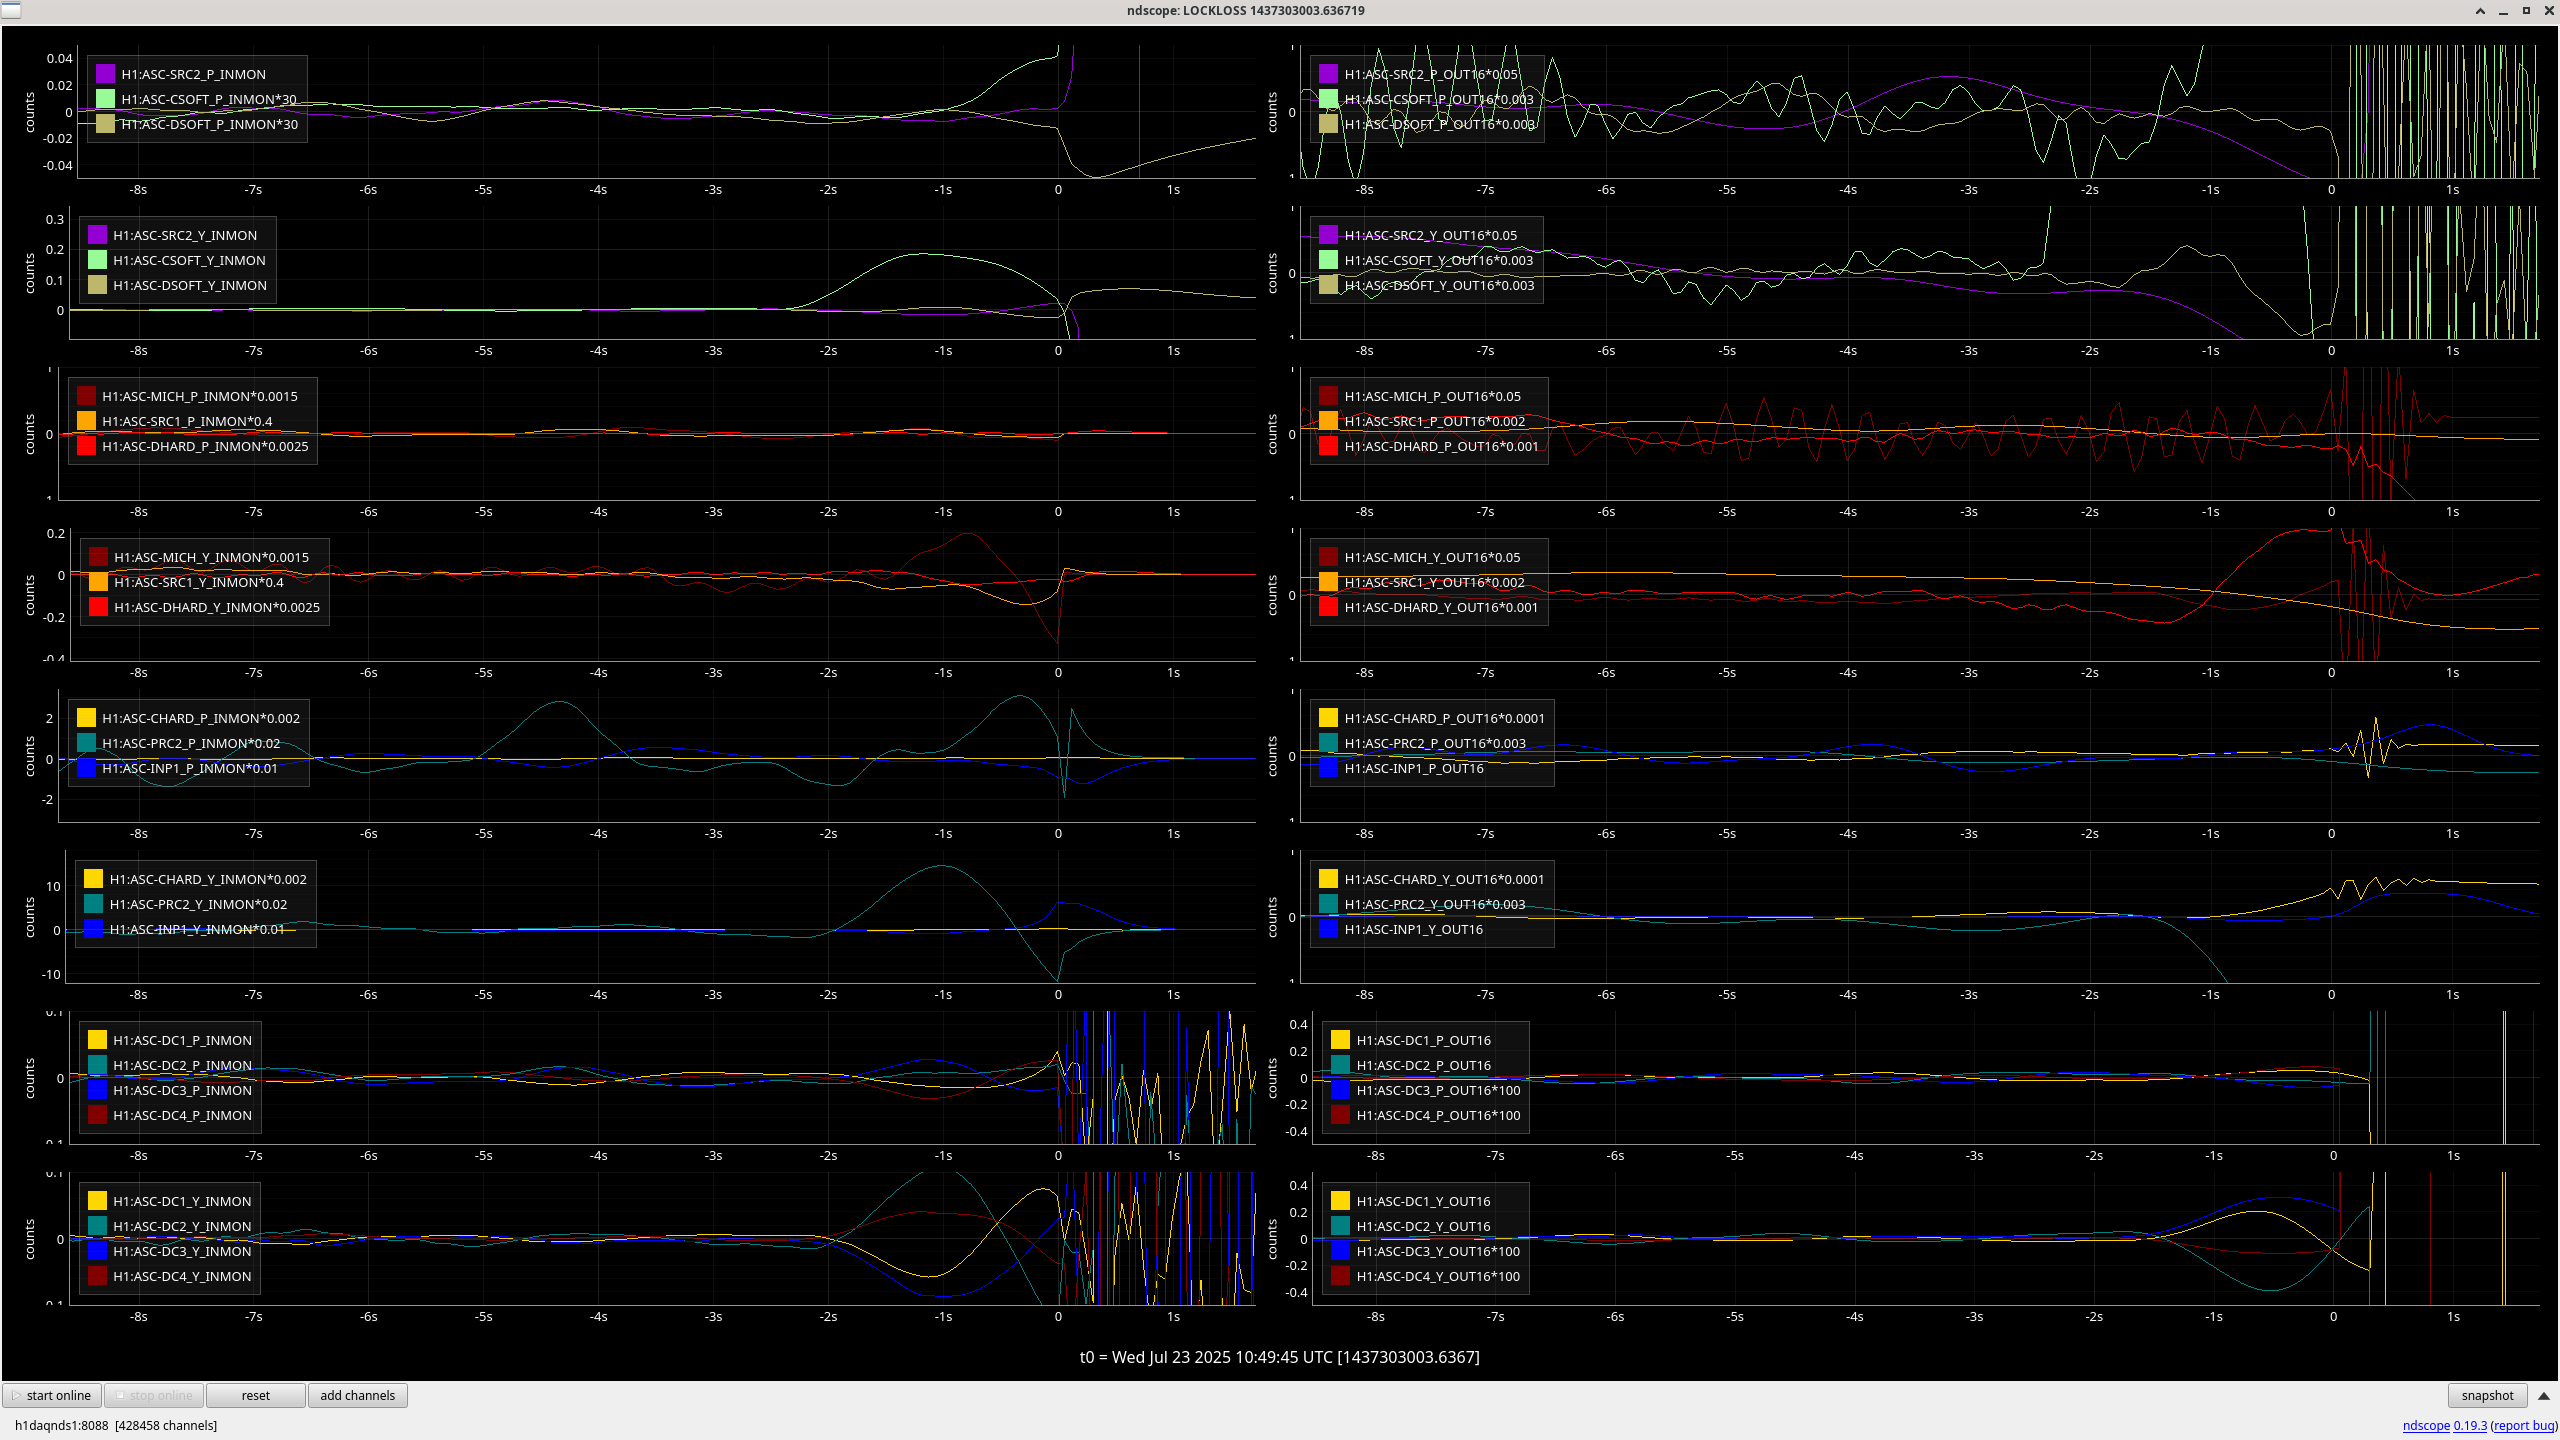
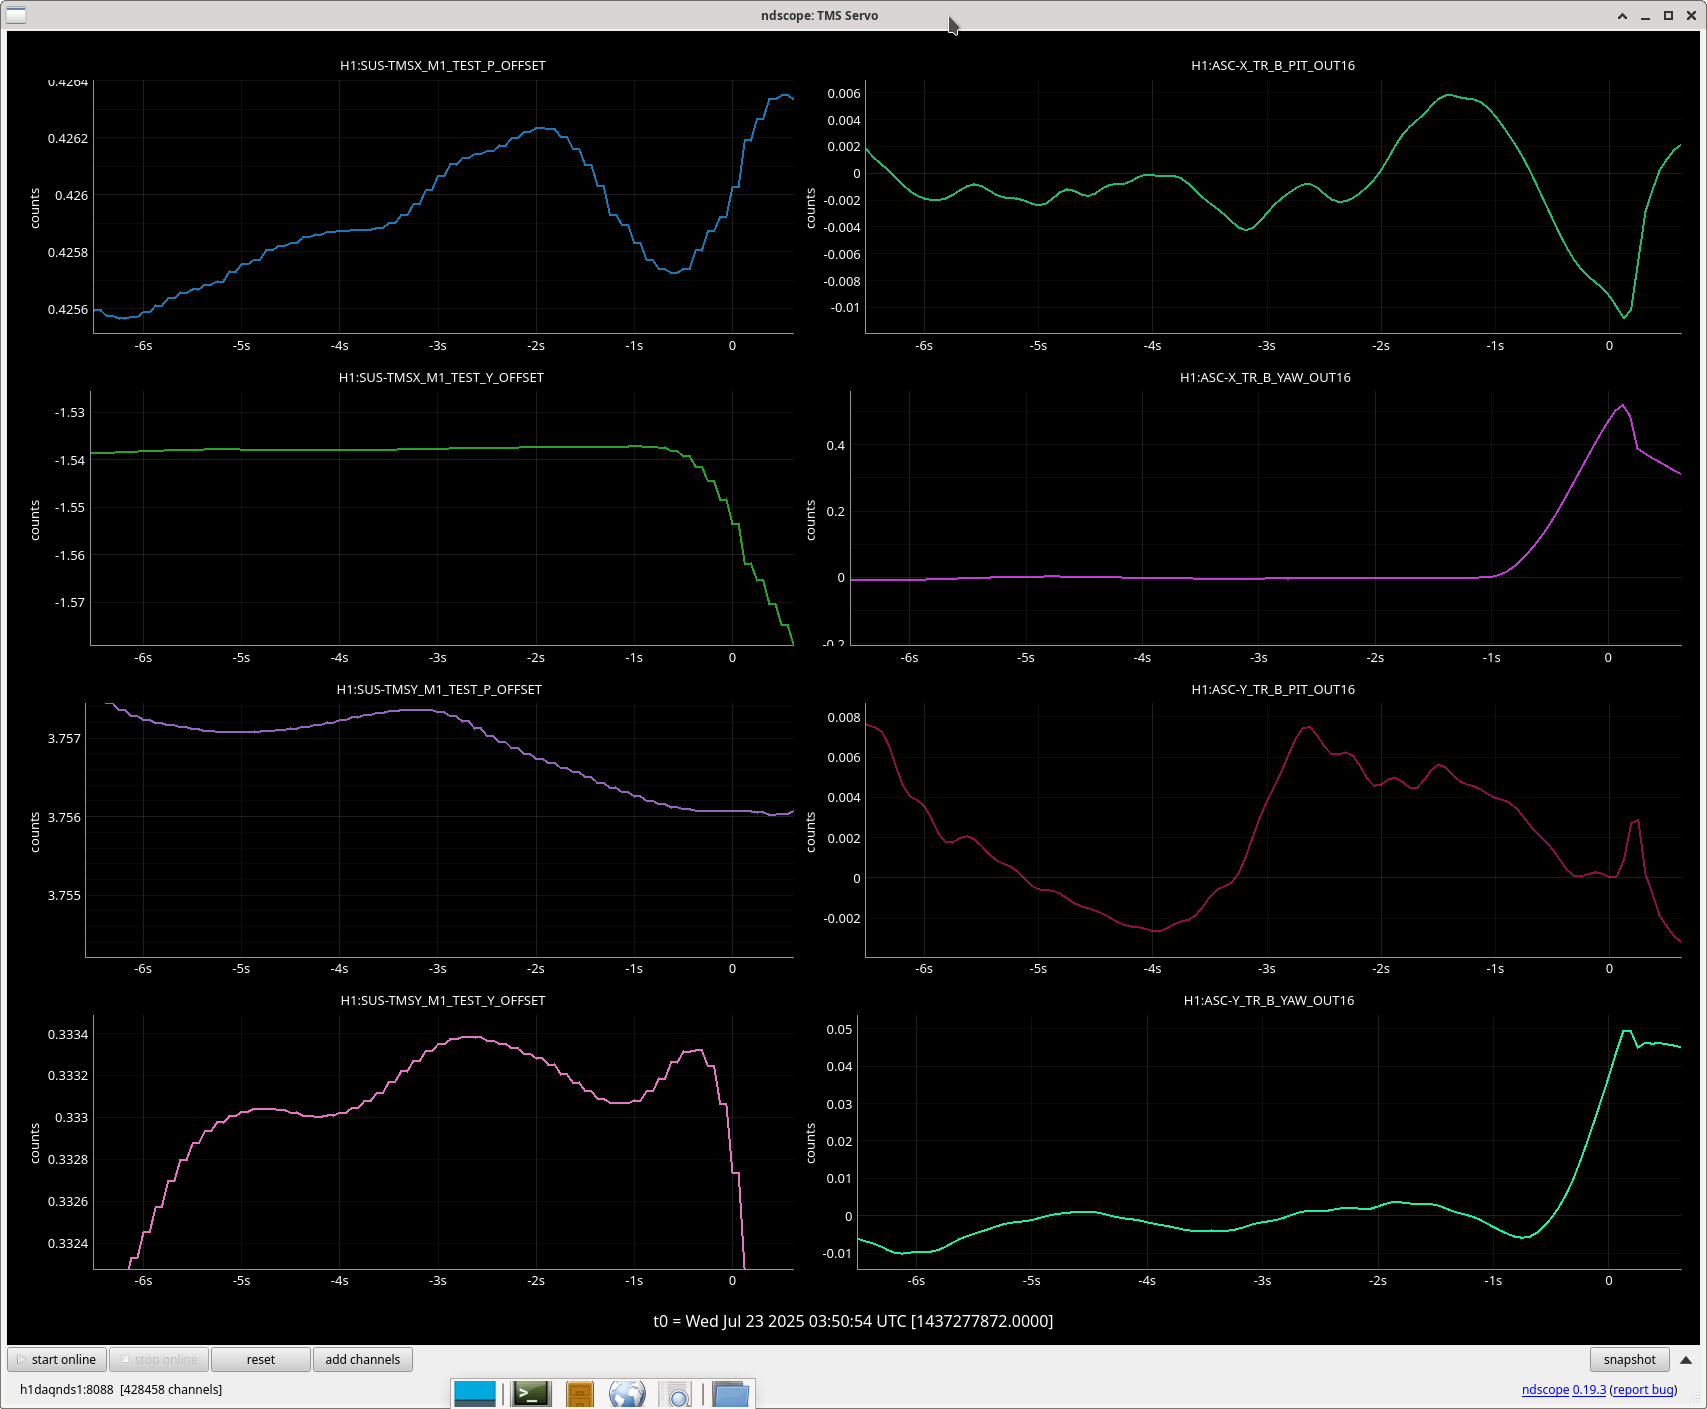
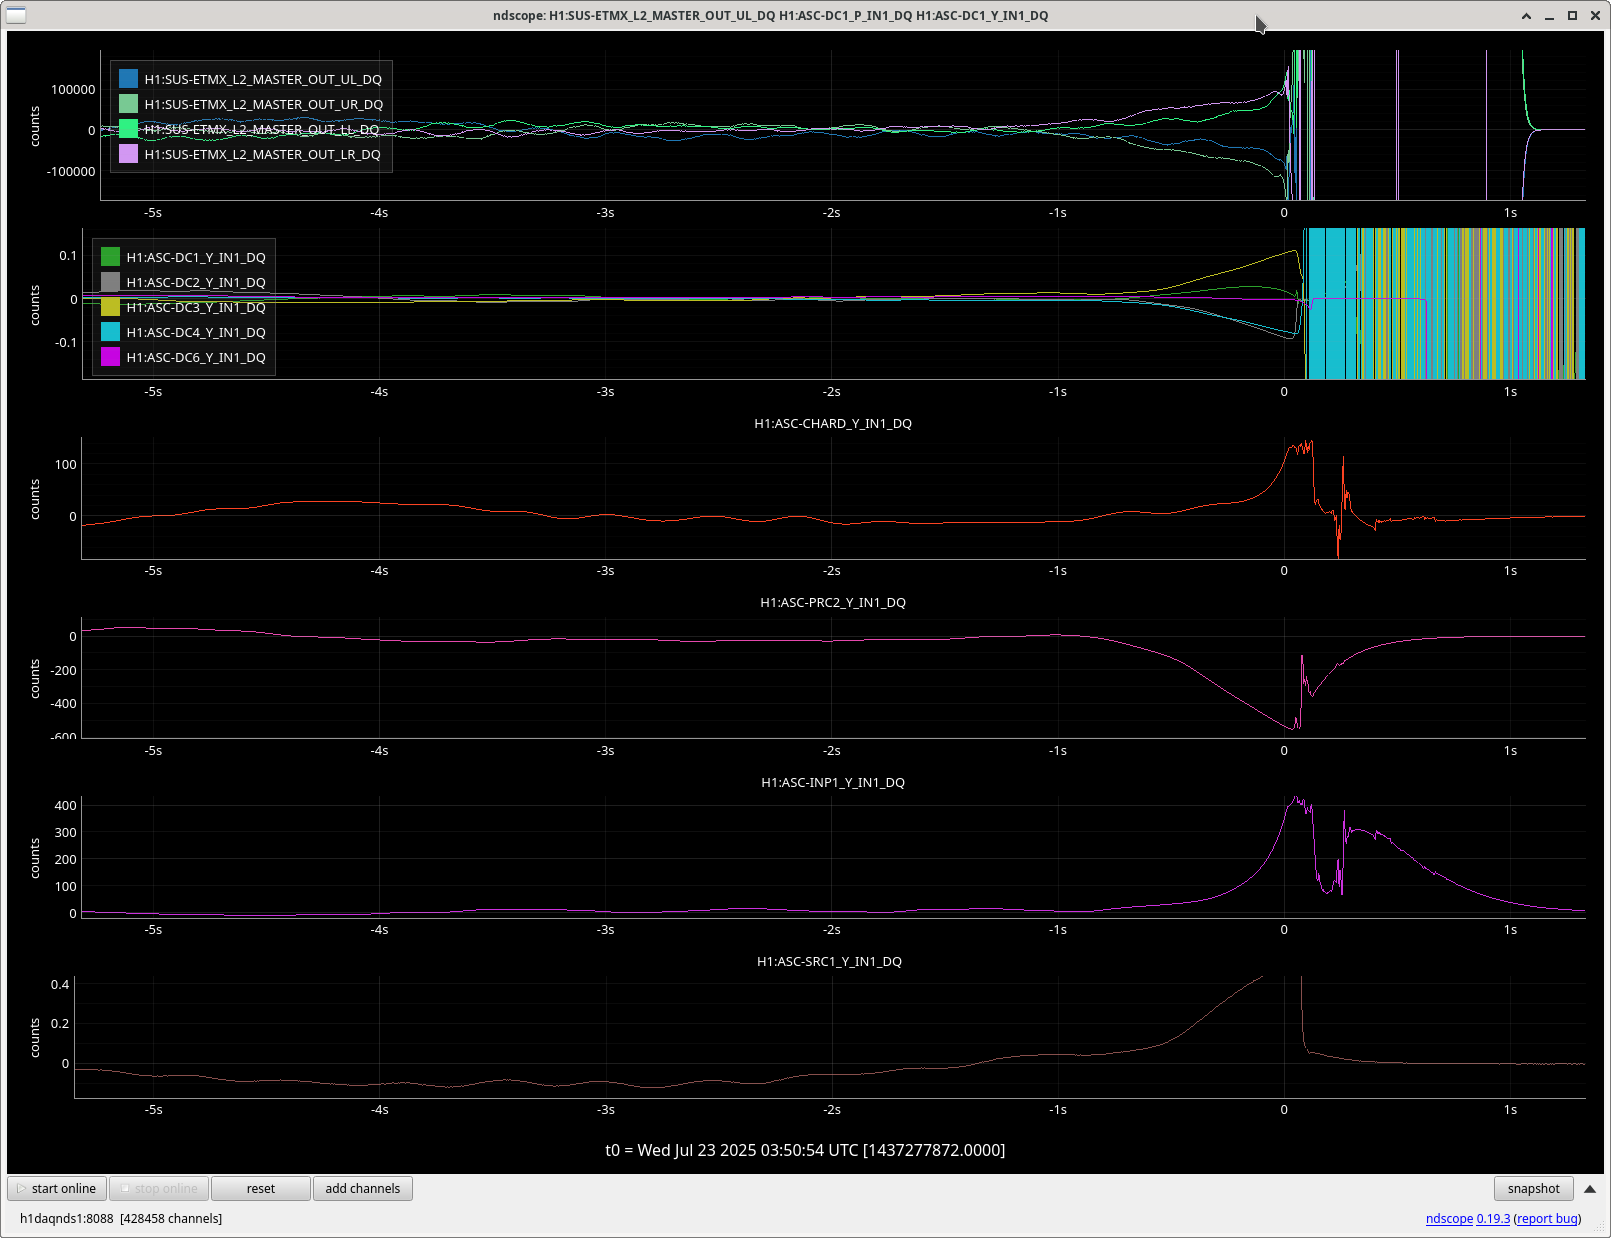
Generally, every yaw ASC loops sees this behavior, but it's hard to tell what is moving first, or the most, since the channels are not calibrated into useful units. As a note, the soft loops are not DC coupled, so I imagine they are just following the other loops. Our lockloss scopes plot the very slow ASC channels, so here is a faster plot of some of the ASC channels before one of these locklosses. The centering loop signals are moving away from zero, but not large enough that the beam is at the edge of the WFS.
I broke out my old TMS servo scope to see if we are being pulled off the TMS QPDs. Clearly the X TR B yaw signal is increasing, but it may be because it's trying to follow a large movement in the hard loops. TMS X yaw moves about 1 urad before the lockloss as well.
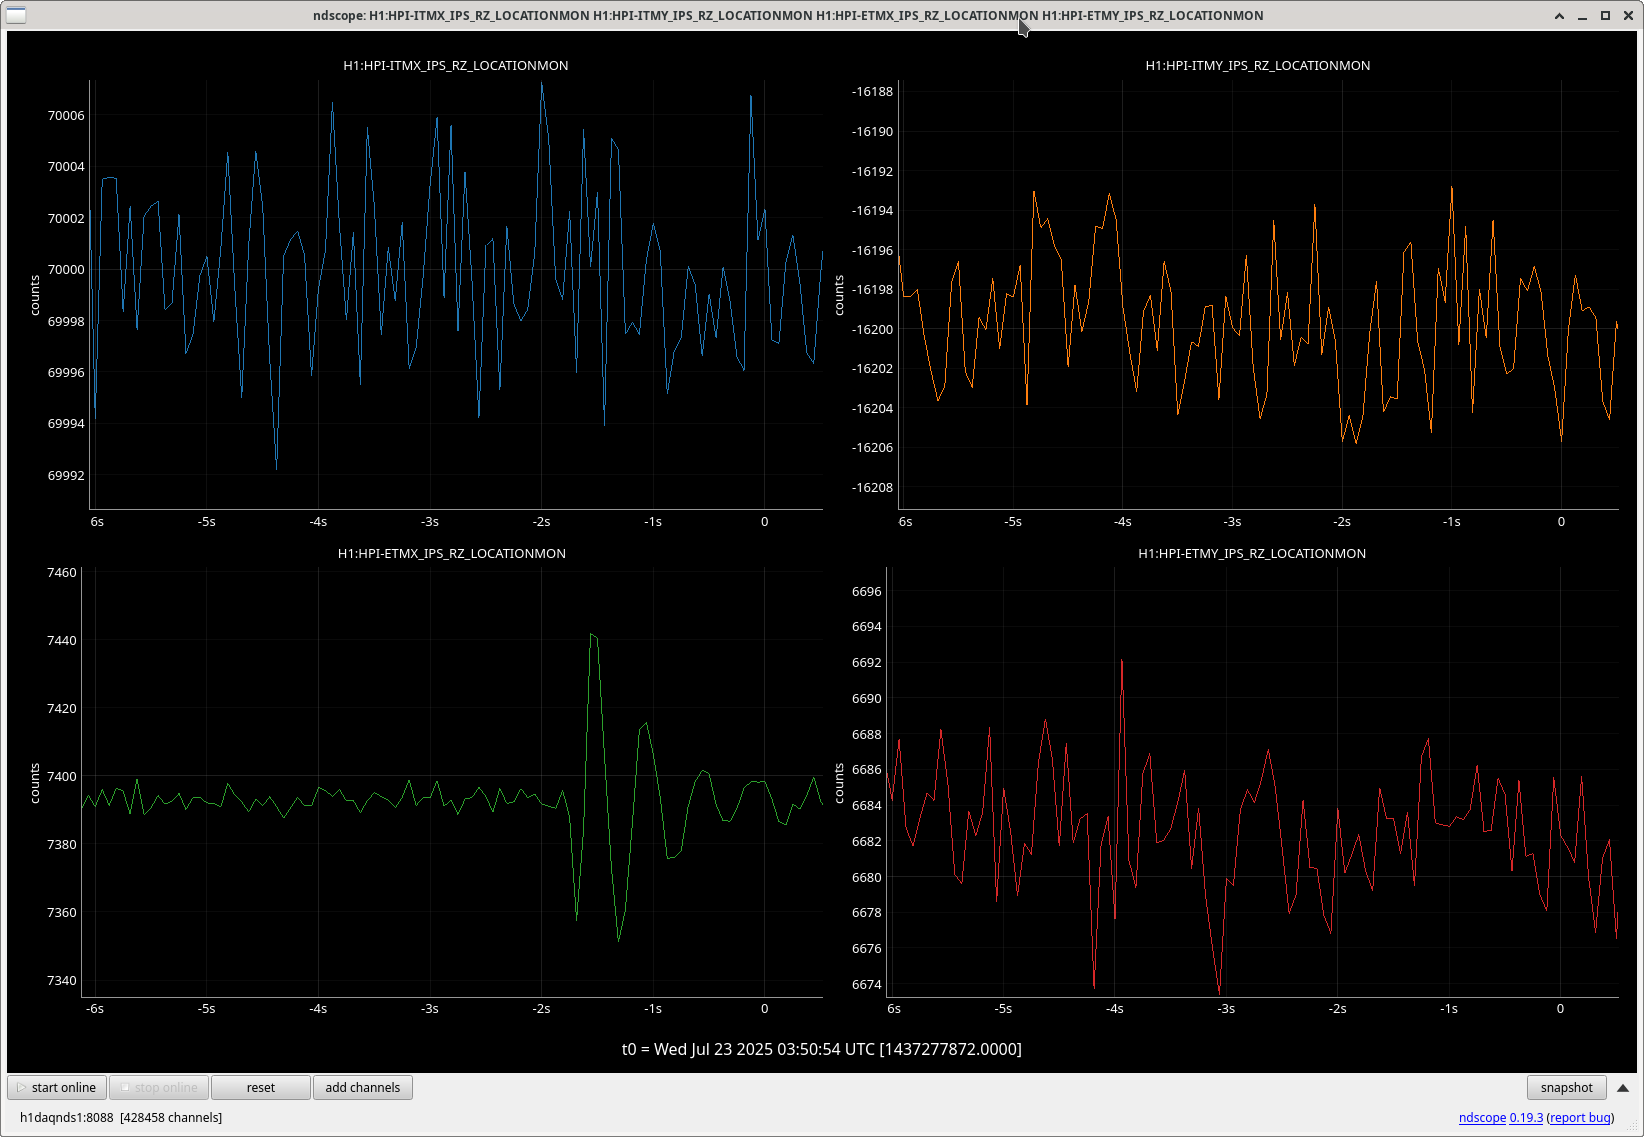
In the first yaw excursion lockloss Camilla notes above, the ETMX HEPI RZ appears to oscillate in the two seconds before lockloss. I don't see that in the other yaw excursion lockloss though.
Both of these YAW ASC locklosses saw TMSX_Y start oscillating a few seconds before the lockloss.
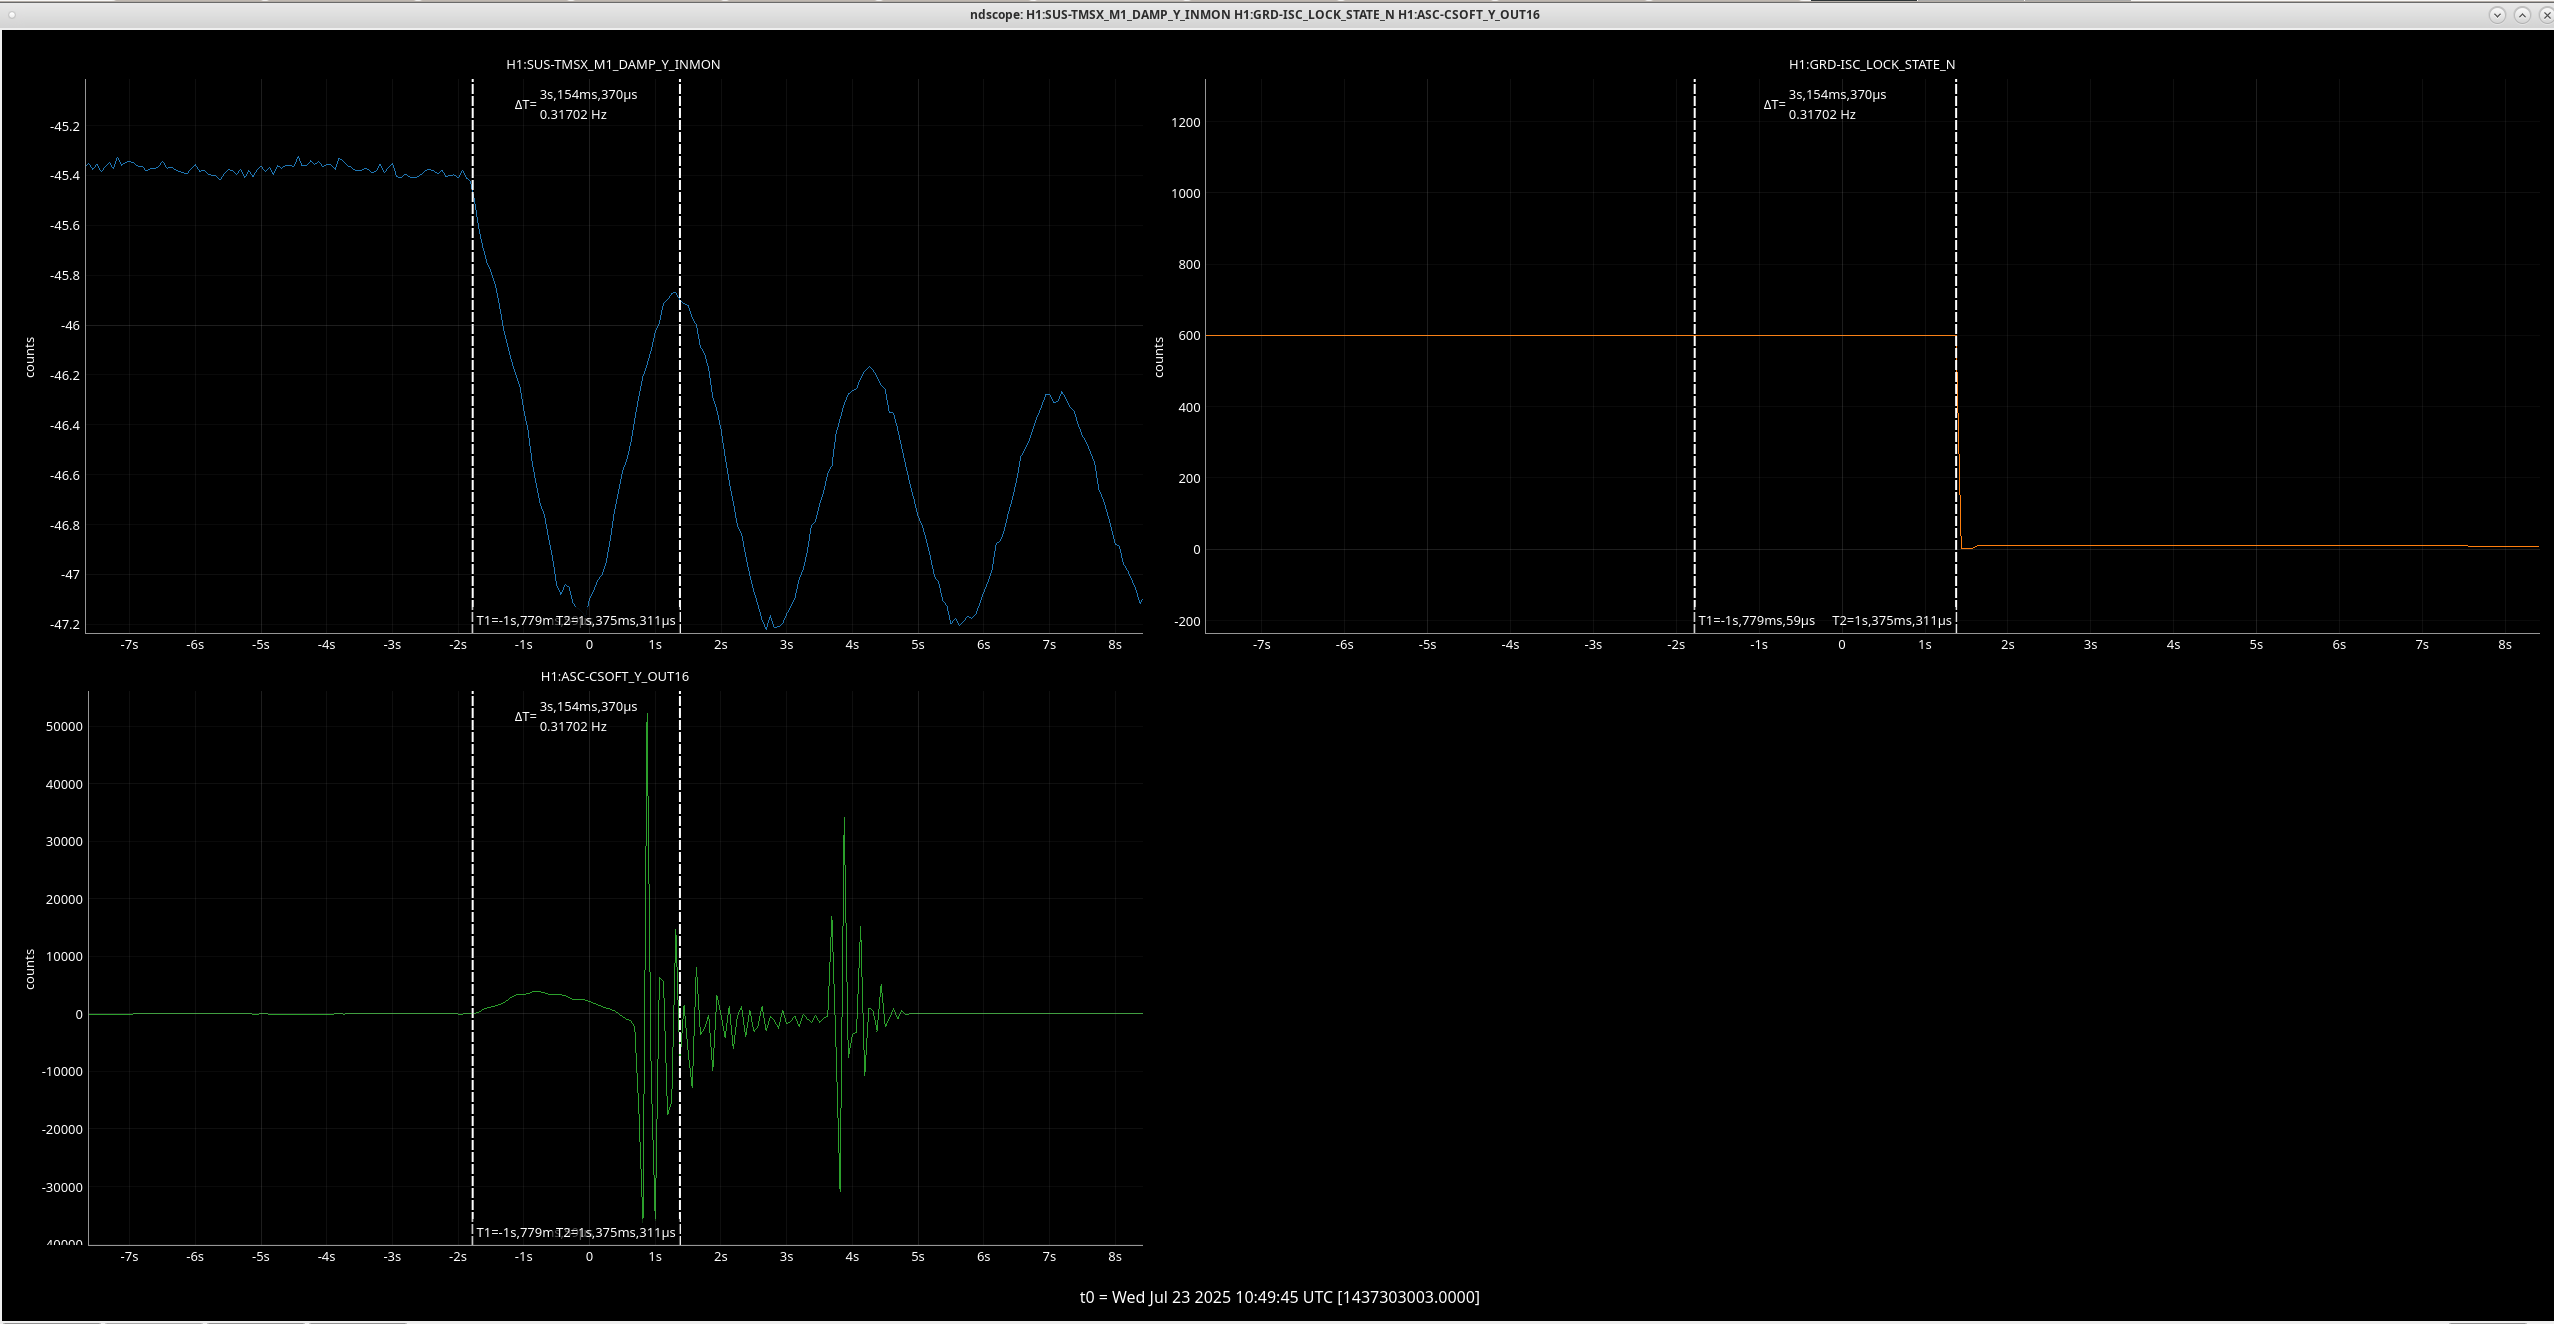
Follow up to add that although the lockloss that Ryan S noted on 7/13 had an ASC excursion, the TMSX yaw suspension did not have the similar strange behavior that these other few locklosses have (ndscope). It's possible that this TMSX yaw behavior is linked to the sat amp change on 7/15, 85770.
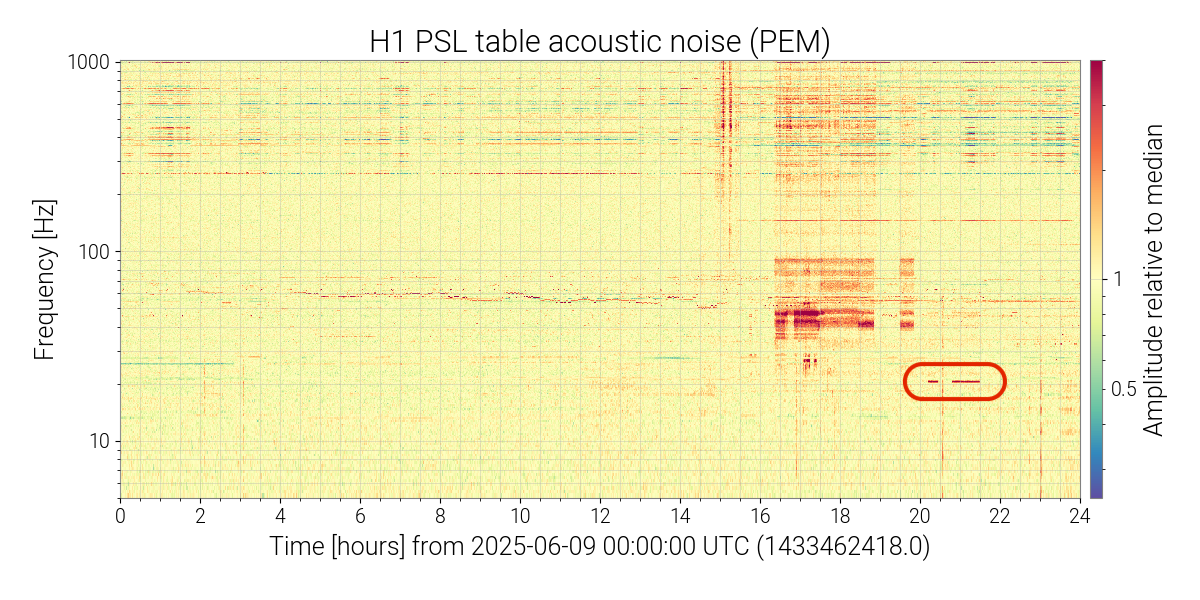
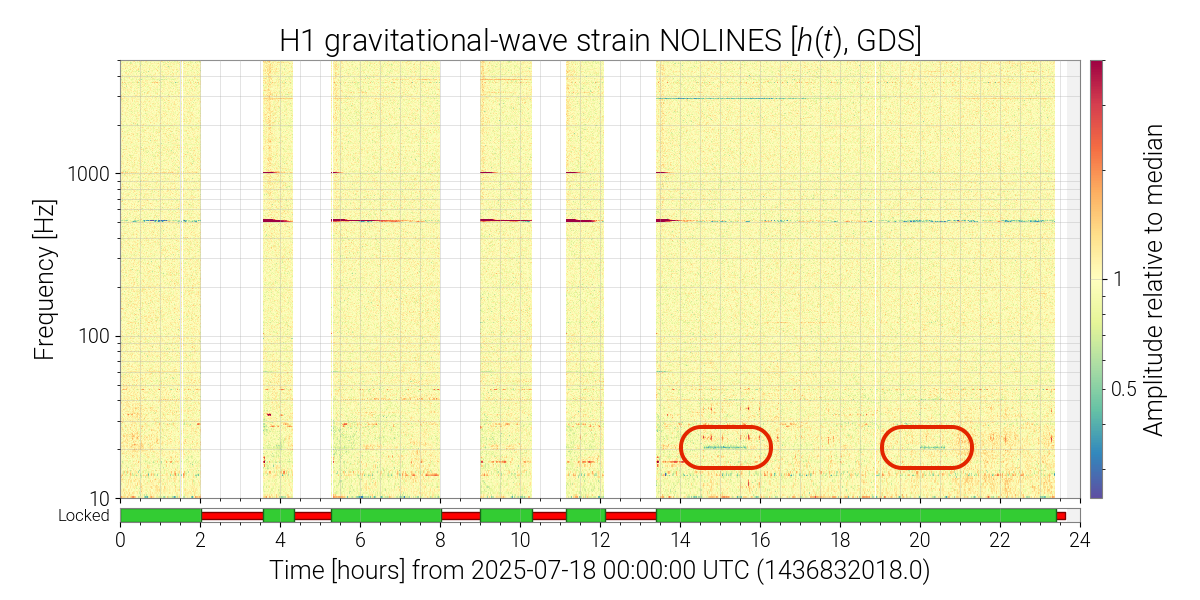
Prompted by me noticing on-off behaviors in the daily strain spectrogram for today at around 20.2 Hz, I've done some additional investigations into the source and behavior of this line:
The 20.2 Hz line, which is currently prominent in DARM, first appeared in accelerometer and microphone data from the corner station on June 9. The first appearance of this line that I found was in the PSL mics, as shown in this spectrogram. This line then appeared in DARM in the first post-vent locks a few days later. The summary of work from June 9 does not show anything obvious to me that would be the source of this new noise.
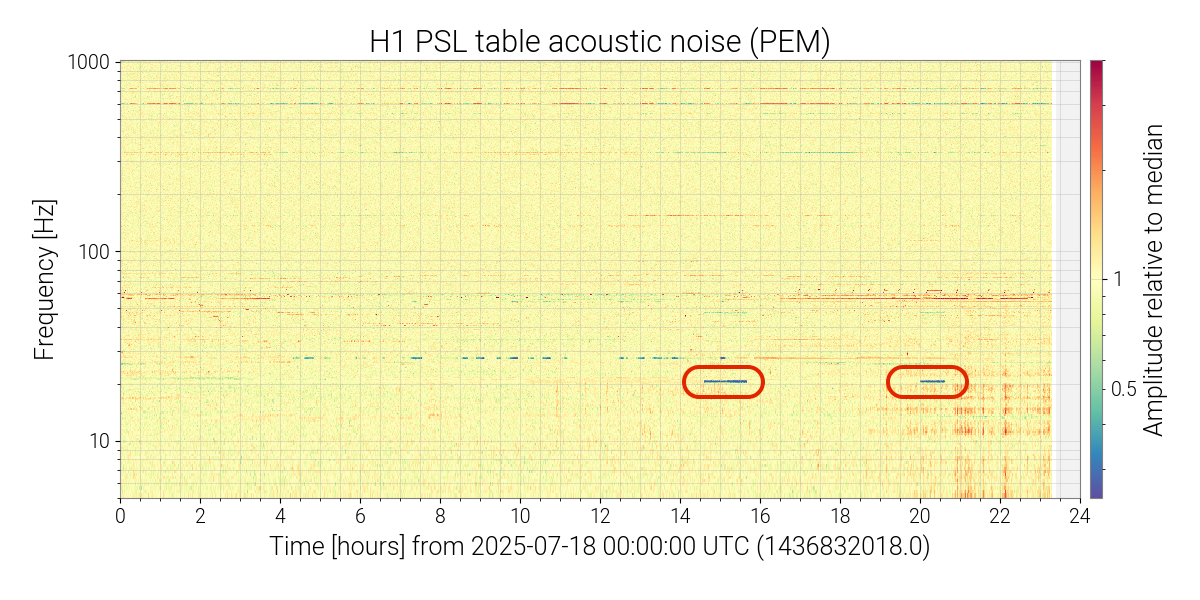
This feature also turns off and on multiple times during the day. An example from today can be seen in this spectrogram. Most corner station microphones and accelerometers exhibit this feature, but it is most pronounced visually in the PSL microphone spectrograms. I was unable to identify any other non-PEM channels that showed the same on-off behavior, but this does reveal many change points that should aid in tracking down the source. Almost every day, this line exhibits abrupt on-off features at different times of the day and for varying durations. Based on my initial review, these change points appear to be more likely during the local daytime (although not at any specific time). When the line first appeared, it was usually in the "off" state and then turned on for short periods. However, this has slowly changed, so that now the line is generally in the "on" state and turns off for brief periods.
Looking into past alogs, I noticed that I reported this same issue last summer in alog 79948. Additional discussion about this line can be found in the detchar-requests repository (requires authentication). In this case, the line appeared in late spring and disappeared in early autumn of 2024. No source was identified before the line disappeared.
Going back further, I also see the same feature appearing in late spring and disappearing in early autumn of 2023. The presence of the line is hence correlated with the outside temperature, likely related to some aspect of the air conditioning system that is only needed when it is (roughly) hotter outside than inside. This also means that we can expect this line to remain present in the data until autumn unless mitigation measures are taken.
I looked briefly into the 20 Hz Noise without much success. Comparing the floor accelerometers, the noise is louder in the EBAY than the LVEA (although the signal of the EBAY accelerometer doesn't look good since the vent). The next closest is HAM1 followed by BS. So the noise is around the -X-Y corner of the LVEA, likely in the EBAY, Transition Area or Optics Lab because HAM6 sees less motion than HAM1 and EBAY sees the most.


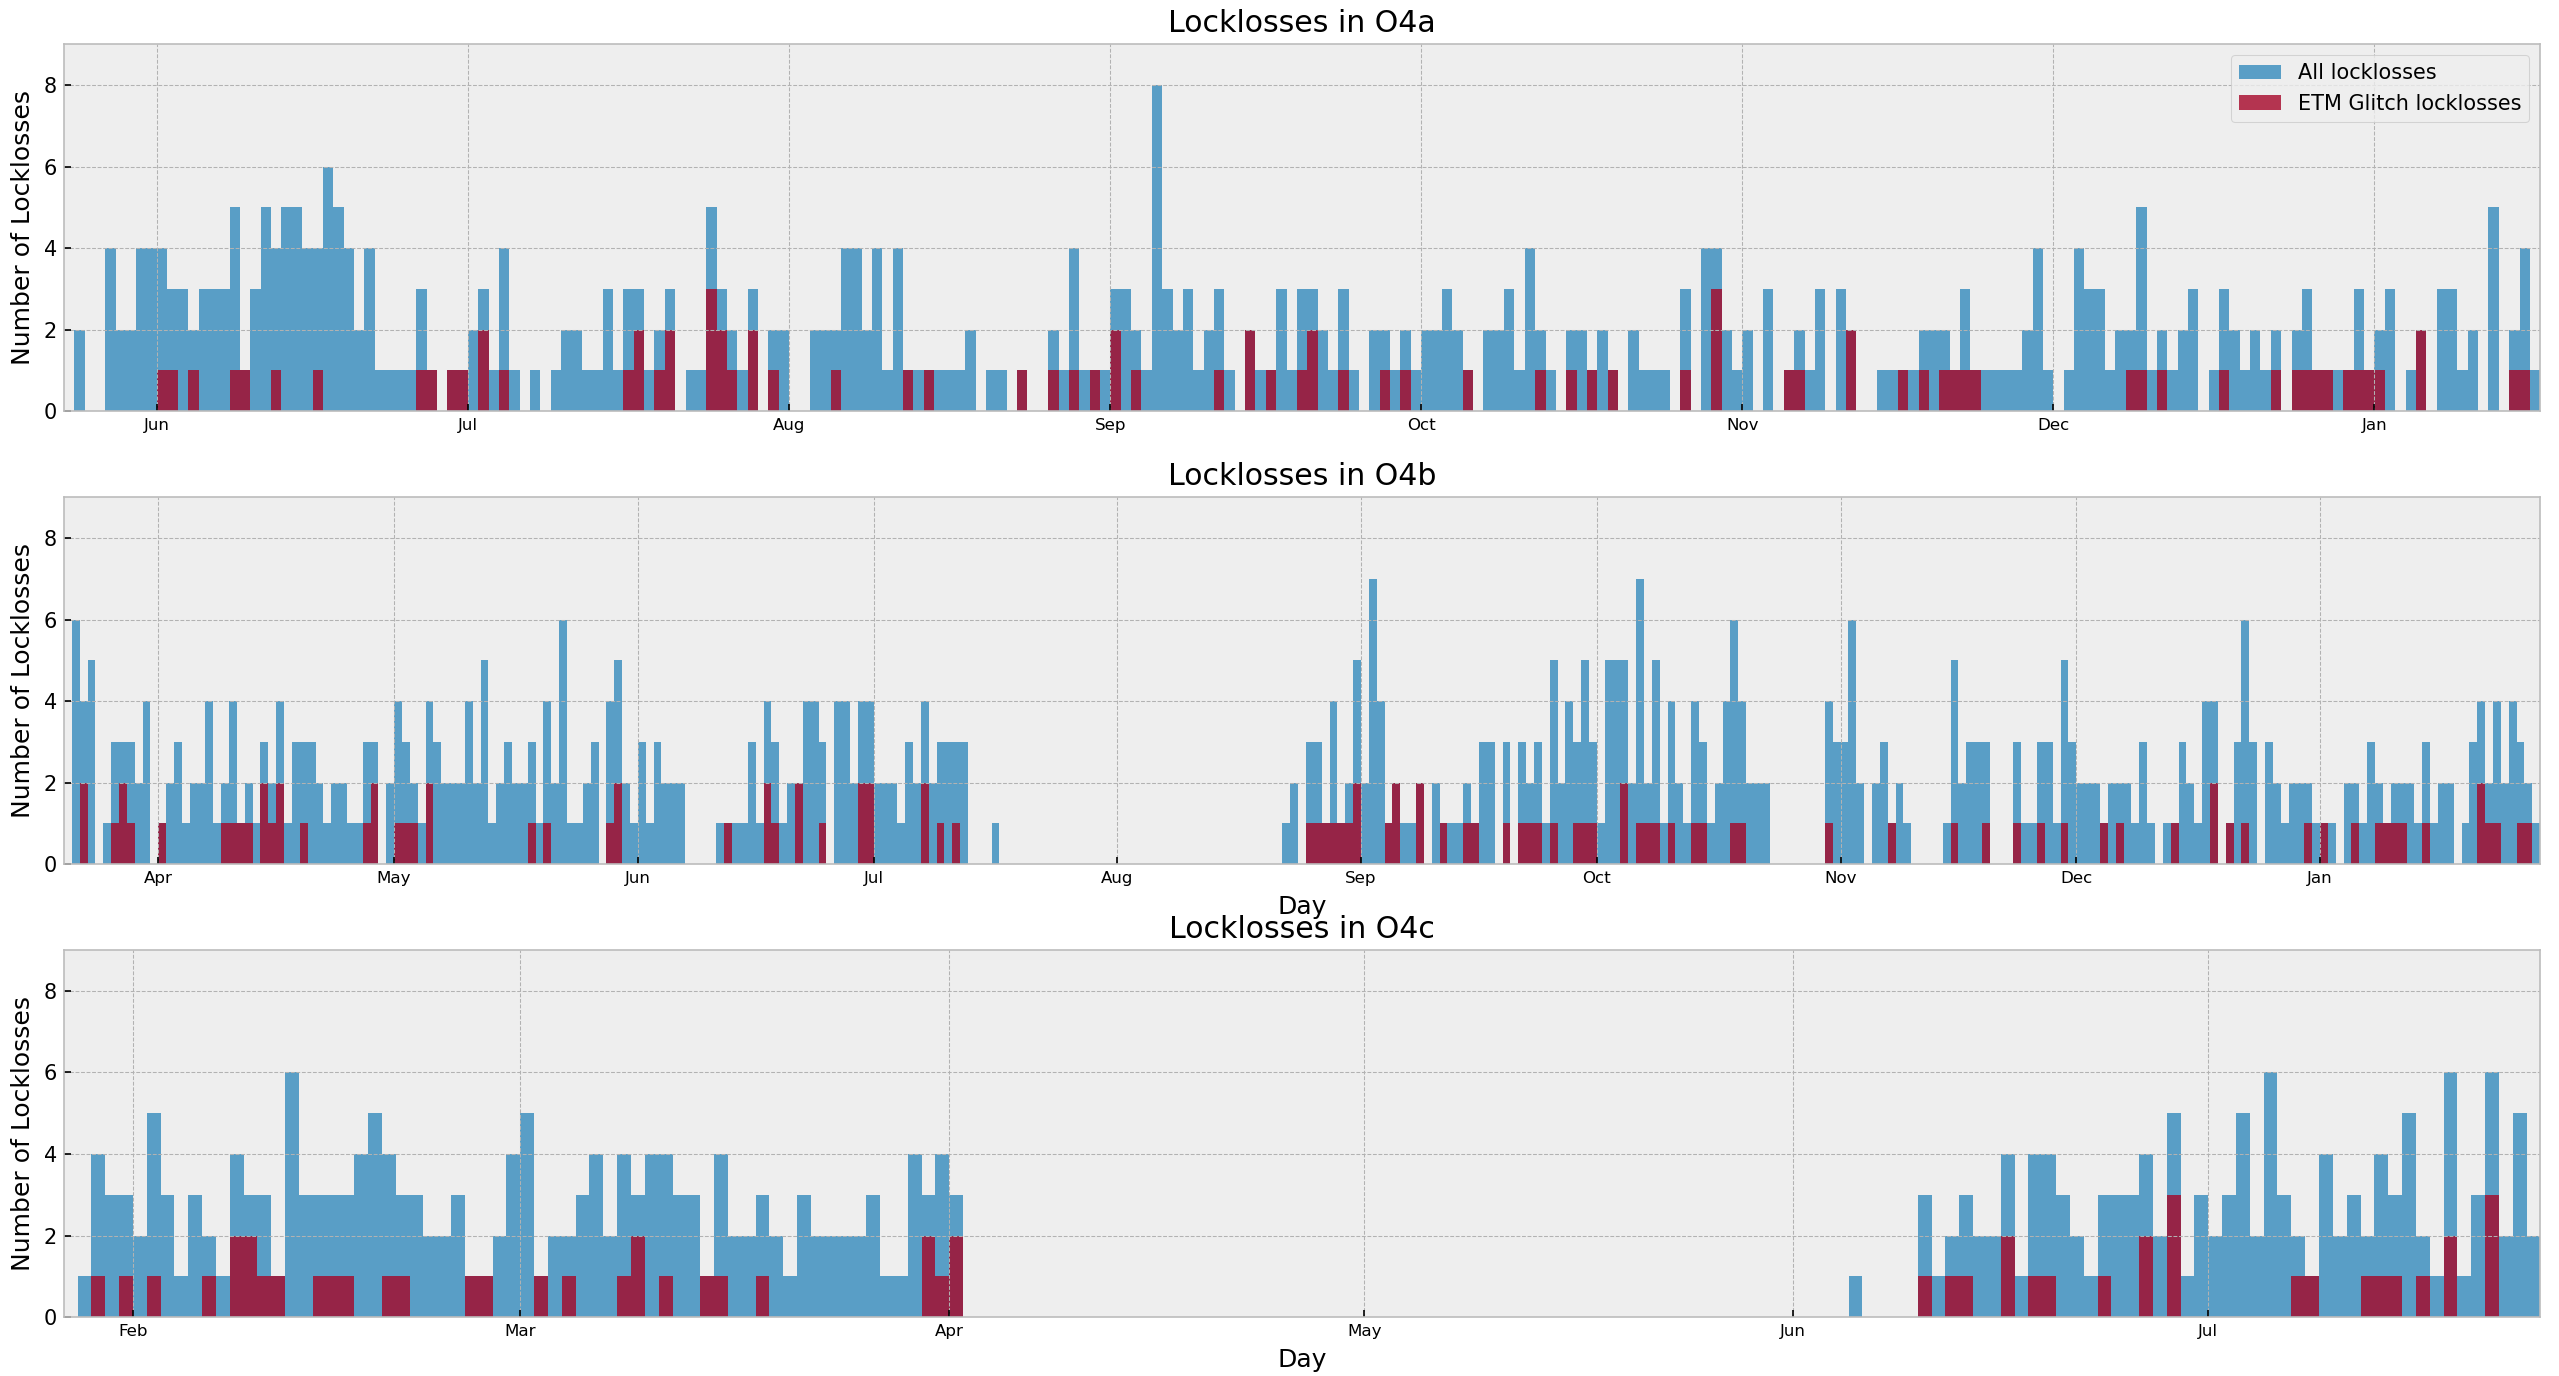
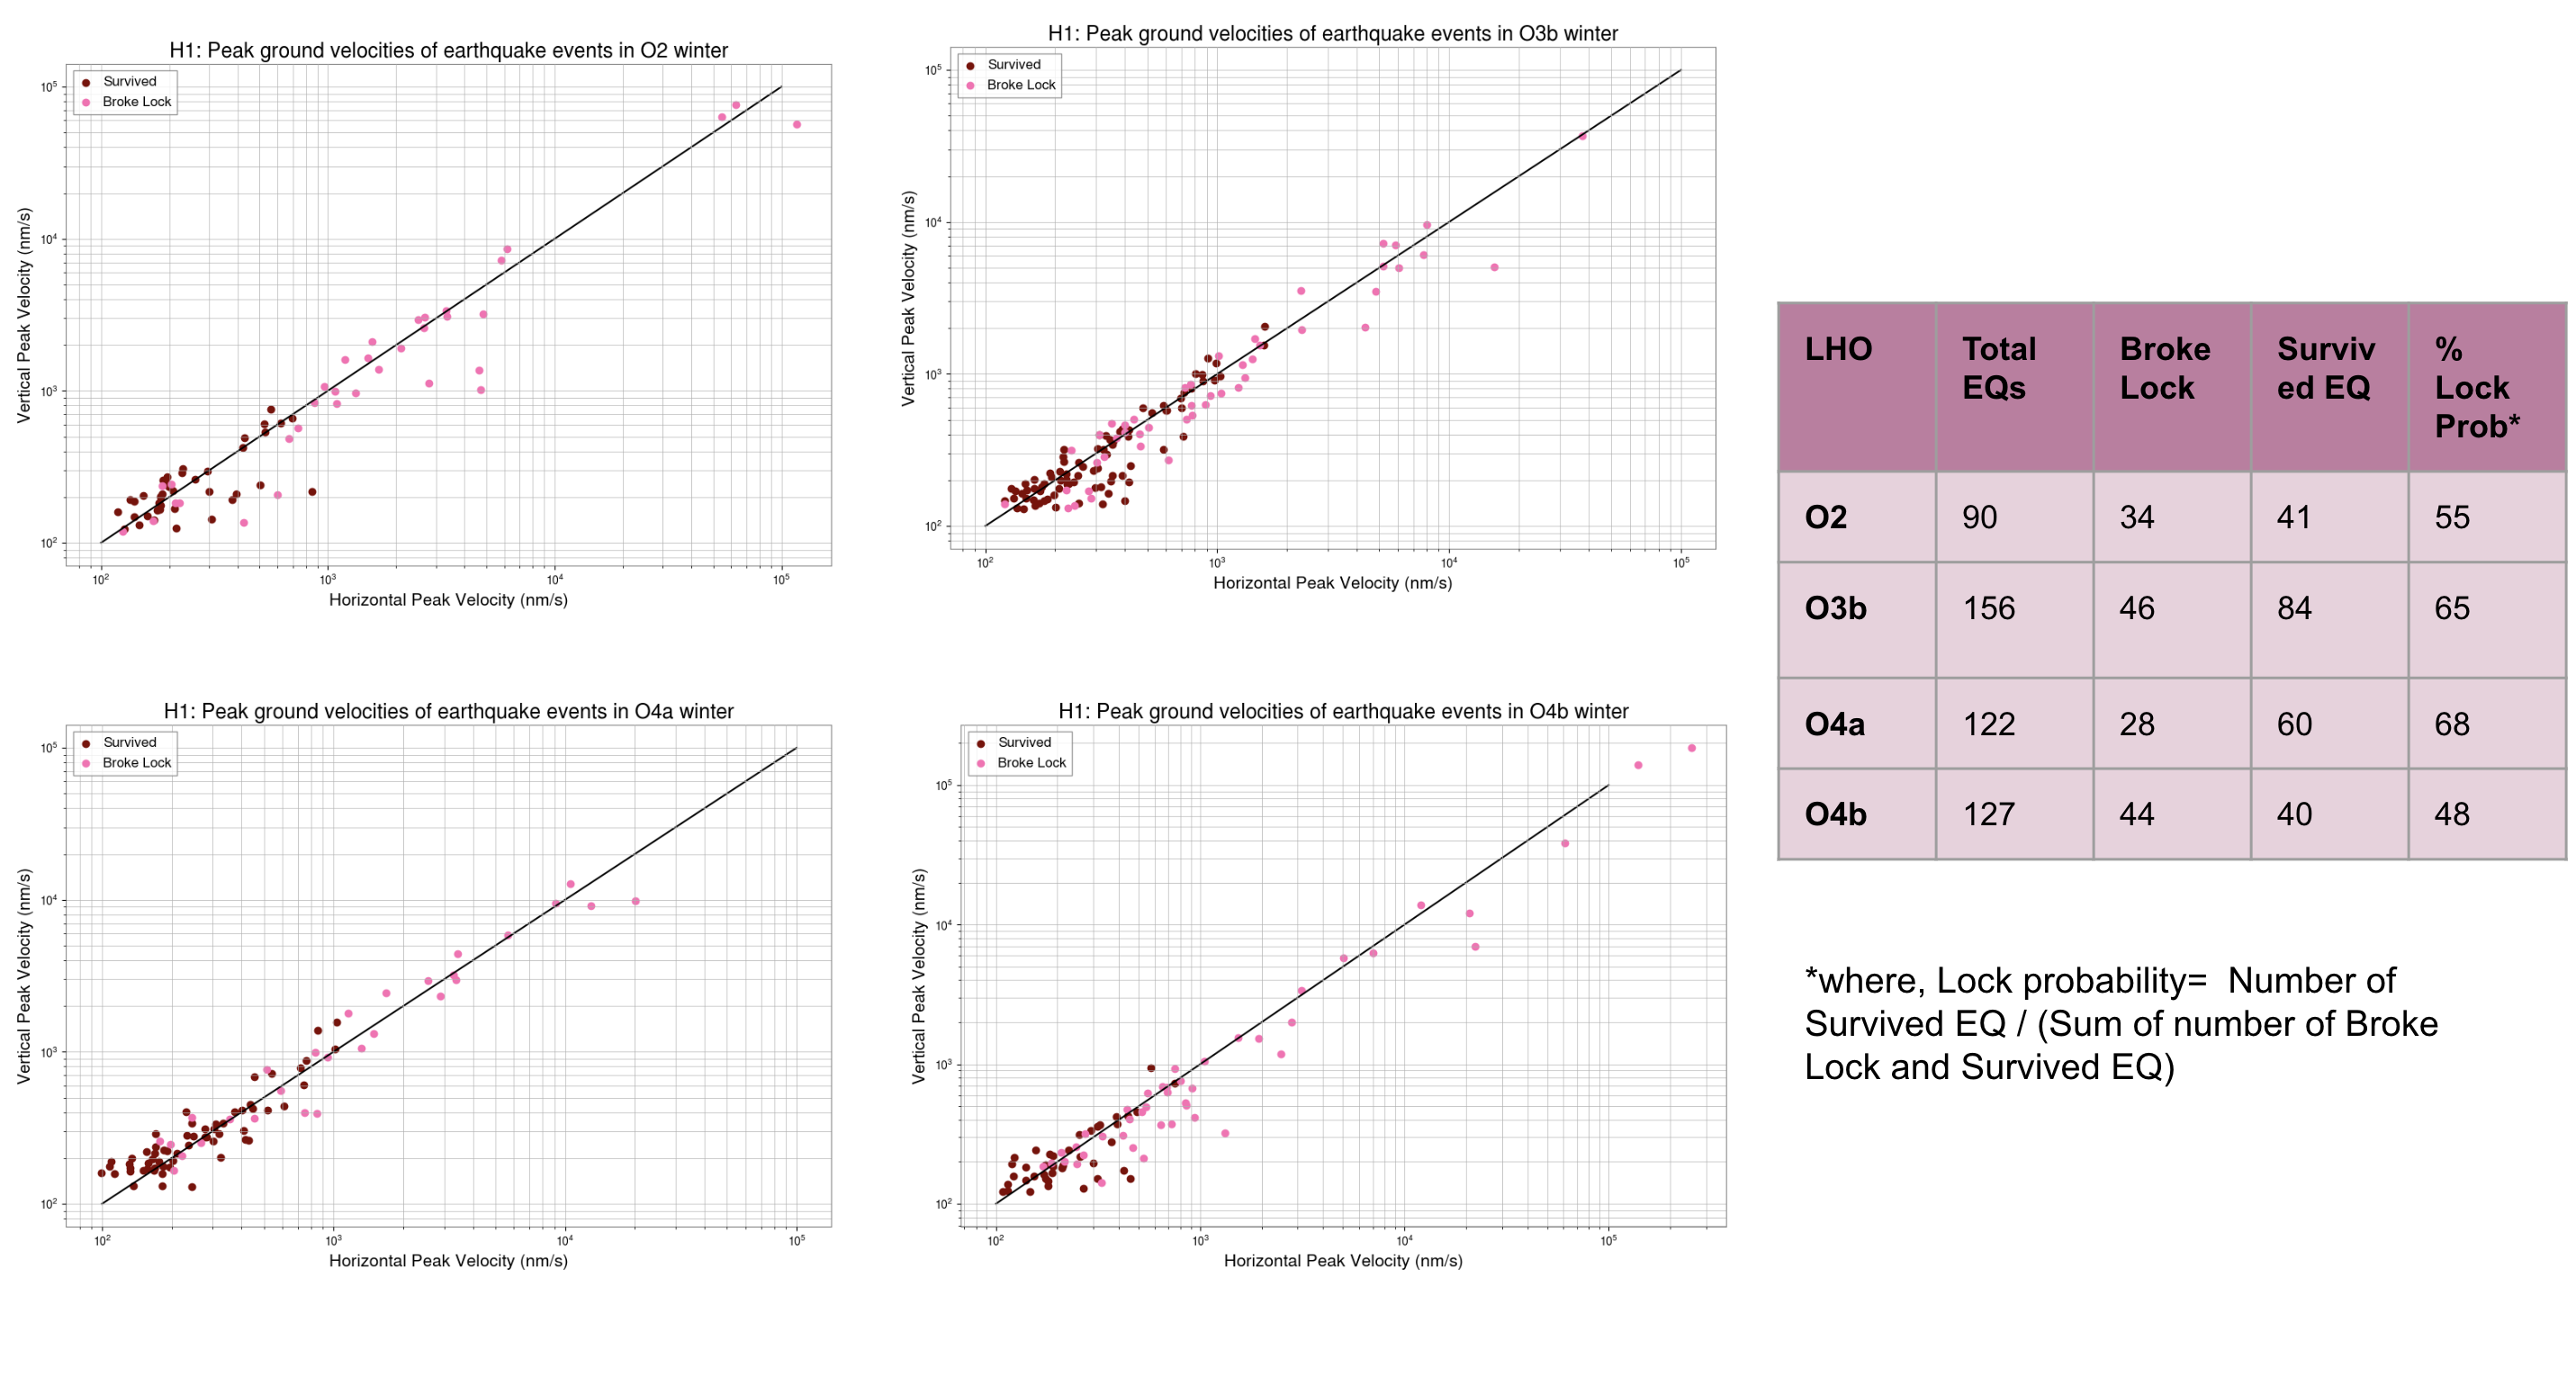
Preeti, Gaby
With the help of Ashley Patron's Eqlock script, we calculated the locklosses caused due to EQs for each observing runs. This is a part of the study of investigating the correlation between the microseism and duty-cycle (alog), so we chose winter months (Nov, Dec, Jan and Feb) of each observing run and calculated the vertical velocity of the ground from z-channel and horizontal velocity which is the quadrature sum of x and y channels at the time of locklost due to an EQ. We also did the same study for LLO (alog).
Conclusion:
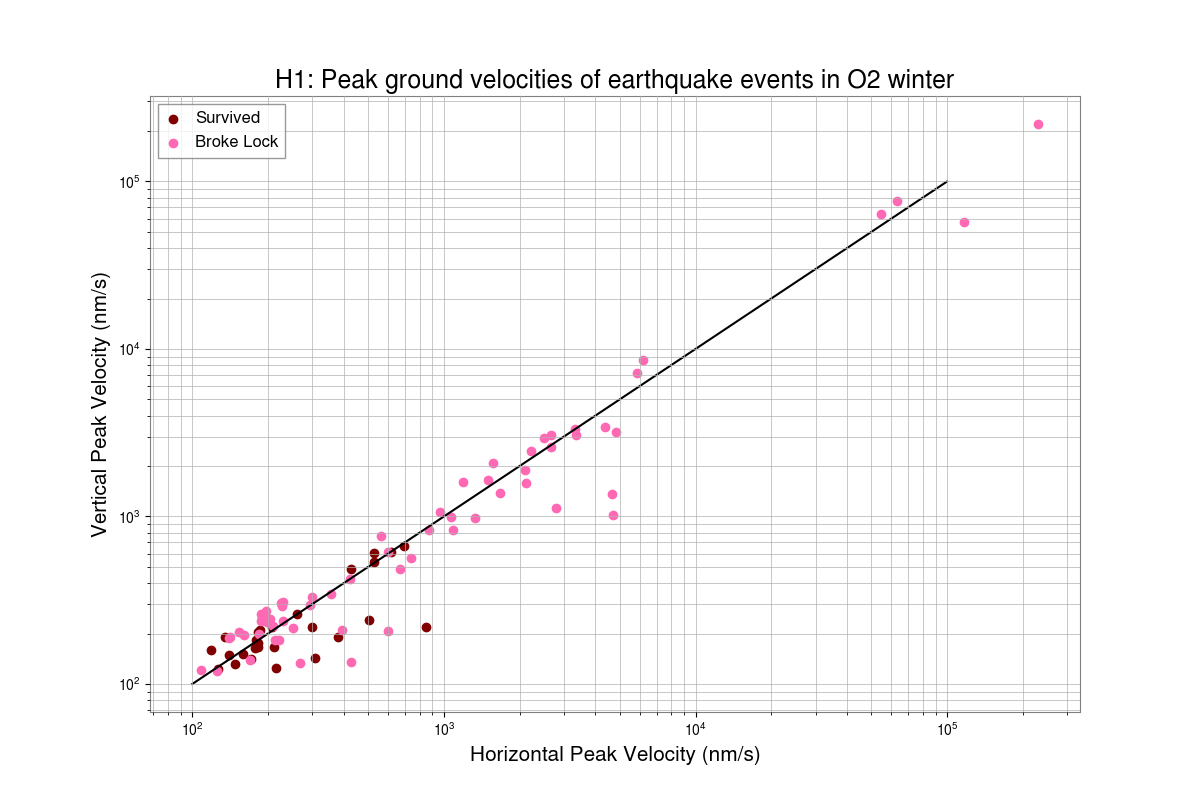
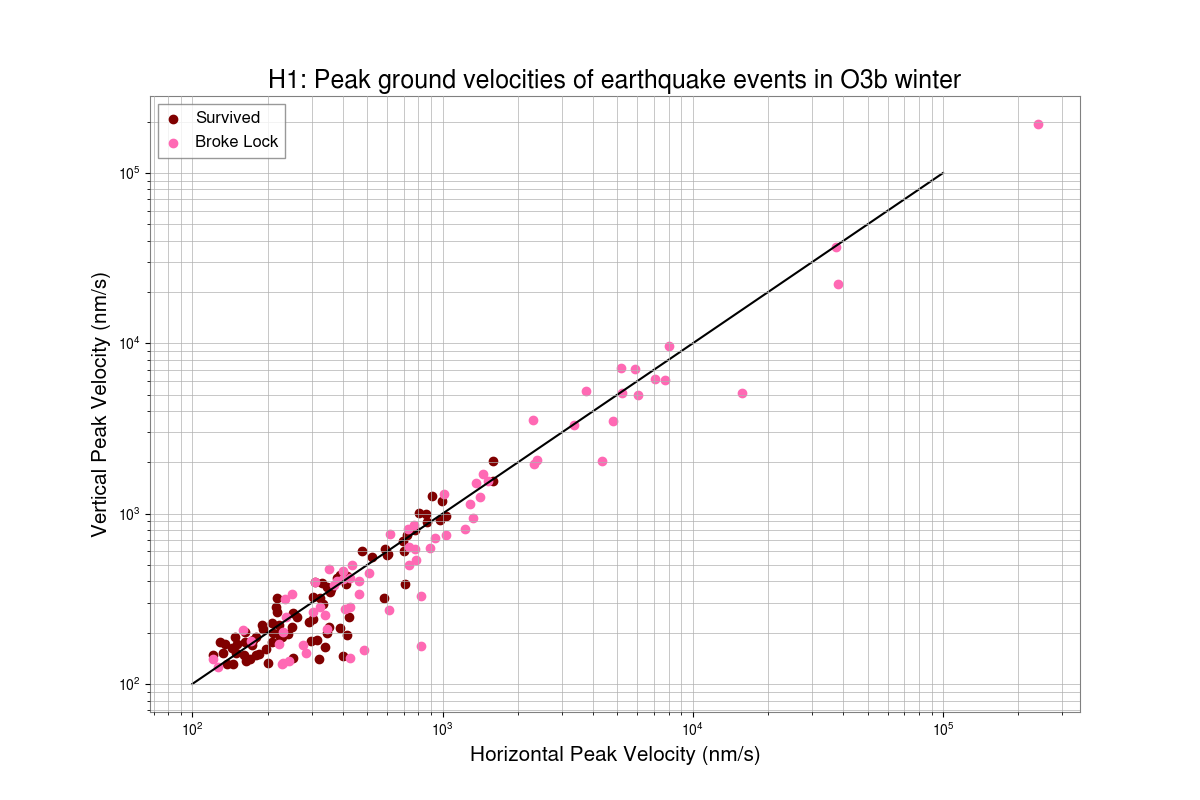
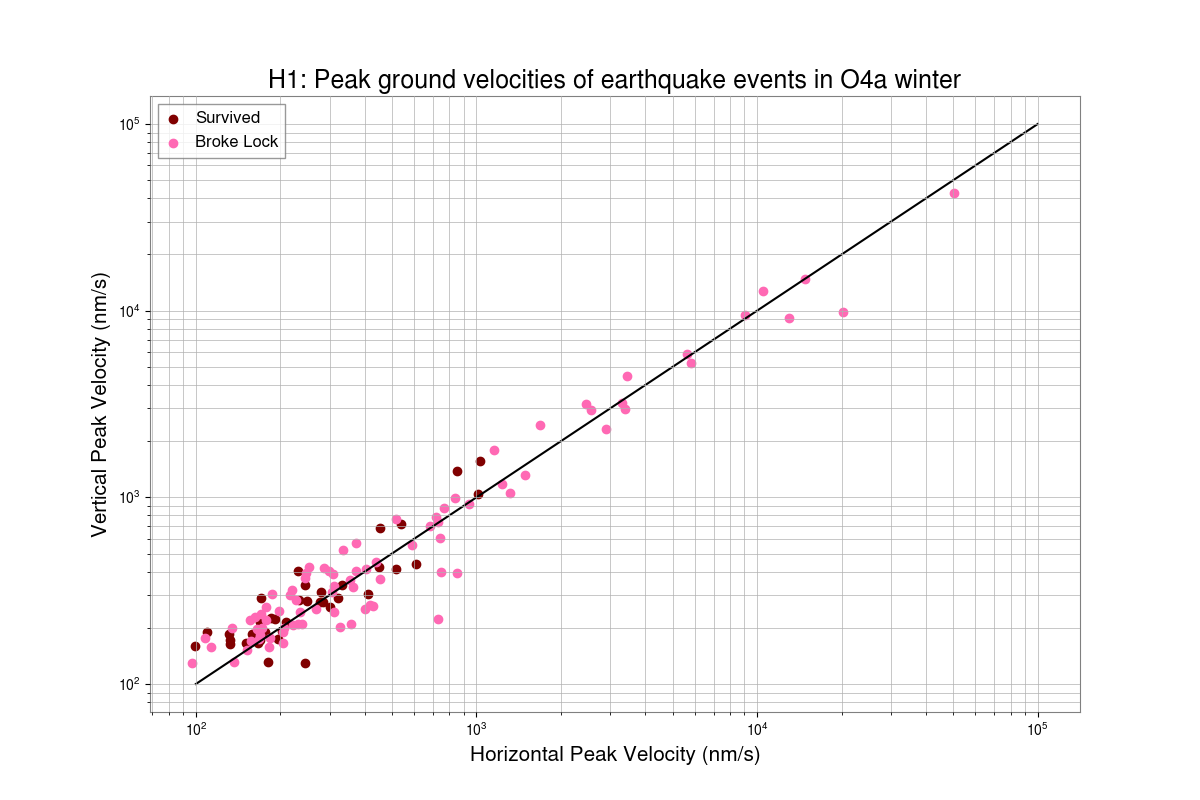
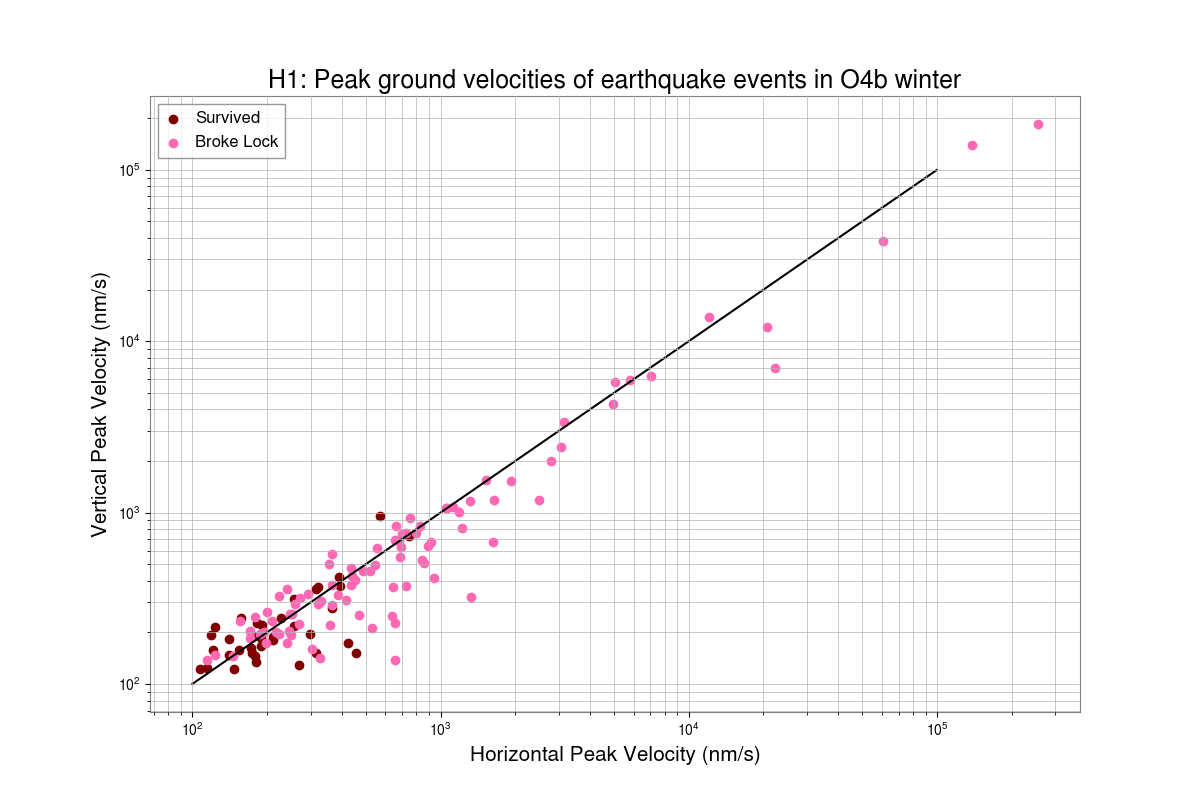
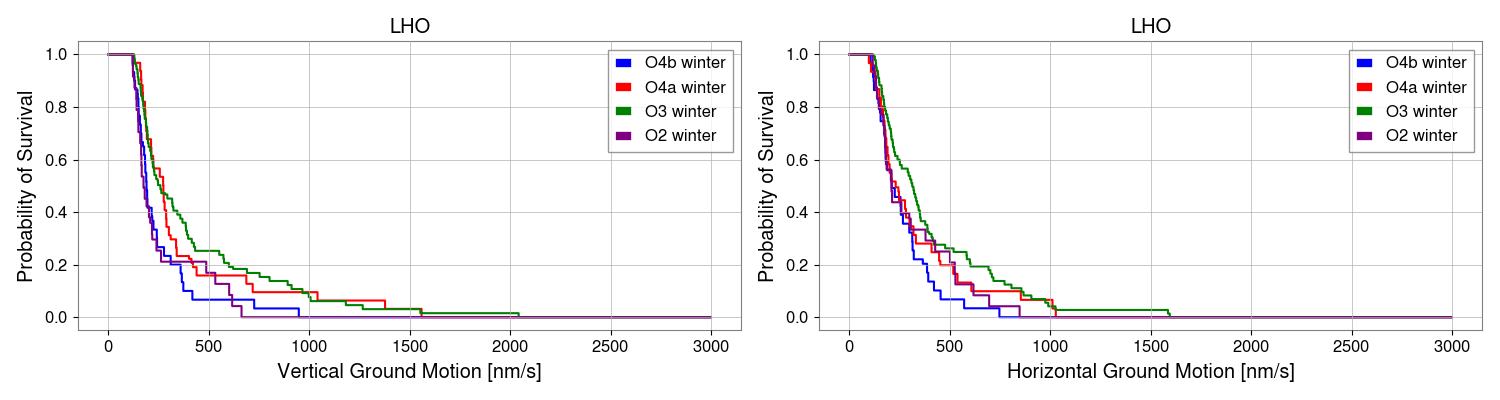
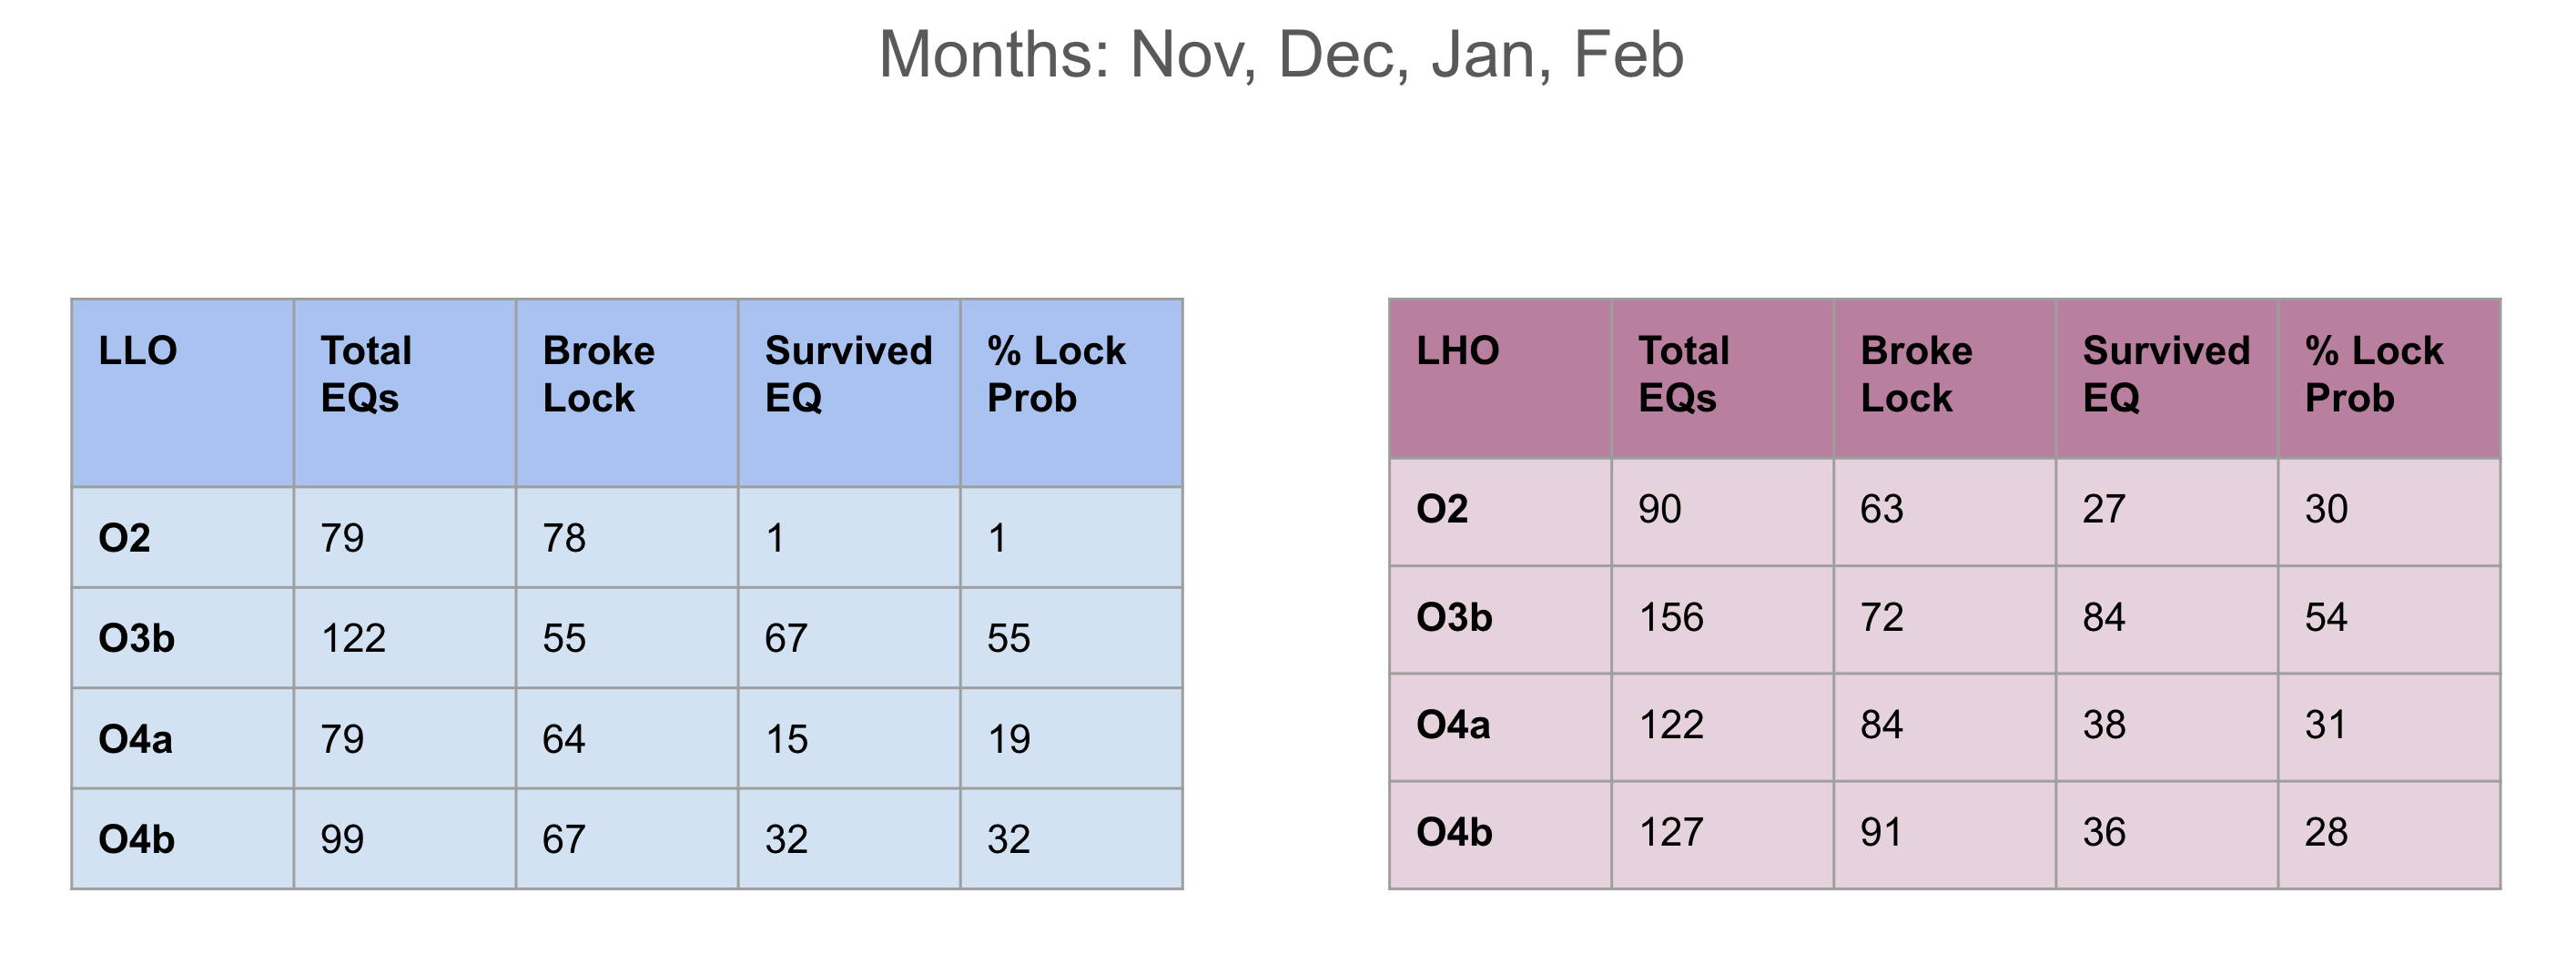
After removing EQ events which happend during the locklosses, the probability of surviving lock during an EQ in O2 winter was found to be 54%, O3b winter was 64%, O4a winter was 73% and O4b winter was 41%.
Some corrections have been done in the script after getting Derek's feedback and have attached the updated scatter plot between peak horizontal ground motion and peak vertical ground motion of Earthquake events, also data table including total number of EQs and lock probability in each observing runs' winters. Although, the number of surviving EQ events are still lower in O4 than O3.
A partial continuation of showing the characterization of the OSEM noise before versus after the satellite amplifier swaps. Today, PR2, MC2, TMSX, and ETMX M0 R0 L1 were swapped out (85770), but here I am only showing the comparison plots for PR2 and MC2. I will have to wait until we have a longer period of being in DOWN before I can get good comparisons for TMSX and ETMX because there has not been very much time after the swaps where we weren't locking or where the seismic environment wasn't set to maintenance, which results in a ton of extra noise that isn't able to be properly regressed out.
Here are the previous comparisons: 85485, 85699
PR2
Results
/ligo/svncommon/SusSVN/sus/trunk/HSTS/H1/PR2/SAGM1/Results/allDampRegressCompare_H1SUSPR2_M1_NoiseComparison_1435154988vs1436654703-1200.pdf
r12453
Data
/ligo/svncommon/SusSVN/sus/trunk/HSTS/H1/PR2/SAGM1/Data/dampRegress_H1SUSPR2_M1_1435154988_1200.mat
/ligo/svncommon/SusSVN/sus/trunk/HSTS/H1/PR2/SAGM1/Data/dampRegress_H1SUSPR2_M1_1436654703_1200.mat
r12453
MC2
Results
/ligo/svncommon/SusSVN/sus/trunk/HSTS/H1/MC2/SAGM1/Results/allDampRegressCompare_H1SUSMC2_M1_NoiseComparison_1436631330vs1436638358-1200.pdf
r12454
Data
/ligo/svncommon/SusSVN/sus/trunk/HSTS/H1/MC2/SAGM1/Data/dampRegress_H1SUSMC2_M1_1436631330_1200.mat
/ligo/svncommon/SusSVN/sus/trunk/HSTS/H1/MC2/SAGM1/Data/dampRegress_H1SUSMC2_M1_1436638358_1200.mat
r12454
The comparisons for the rest of this swap set (TMSX, ETMX M0/R0/L0) have been posted as 85952
