J. Oberling, E. Merilh
The last few days have been spent taking caustic measurements and searching for mode matching solutions so we can identify what lenses we need for mode matching prior to placing elements on the table; as a result there is not a whole lot of installation activity to report. We left off Friday with a lovely LG01 mode in the Wincam. On Monday morning Bubba very kindly shaved some mounts down for us (for WP02 and PBS02) to solve our clipping problem. These were installed and the LG01 mode was still observed on the Wincam. To see if we were seeing something real or just an issue with the Wincam, we borrowed a Thorlabs rotating slit beam profiler from the Pcal folks (who had lent it to the SQZ folks). Setting this profiler up, we saw a nice Gaussian beam on the profiler. Apparently something is up with that Wincam, so we will continue to use the Thorlabs profiler.
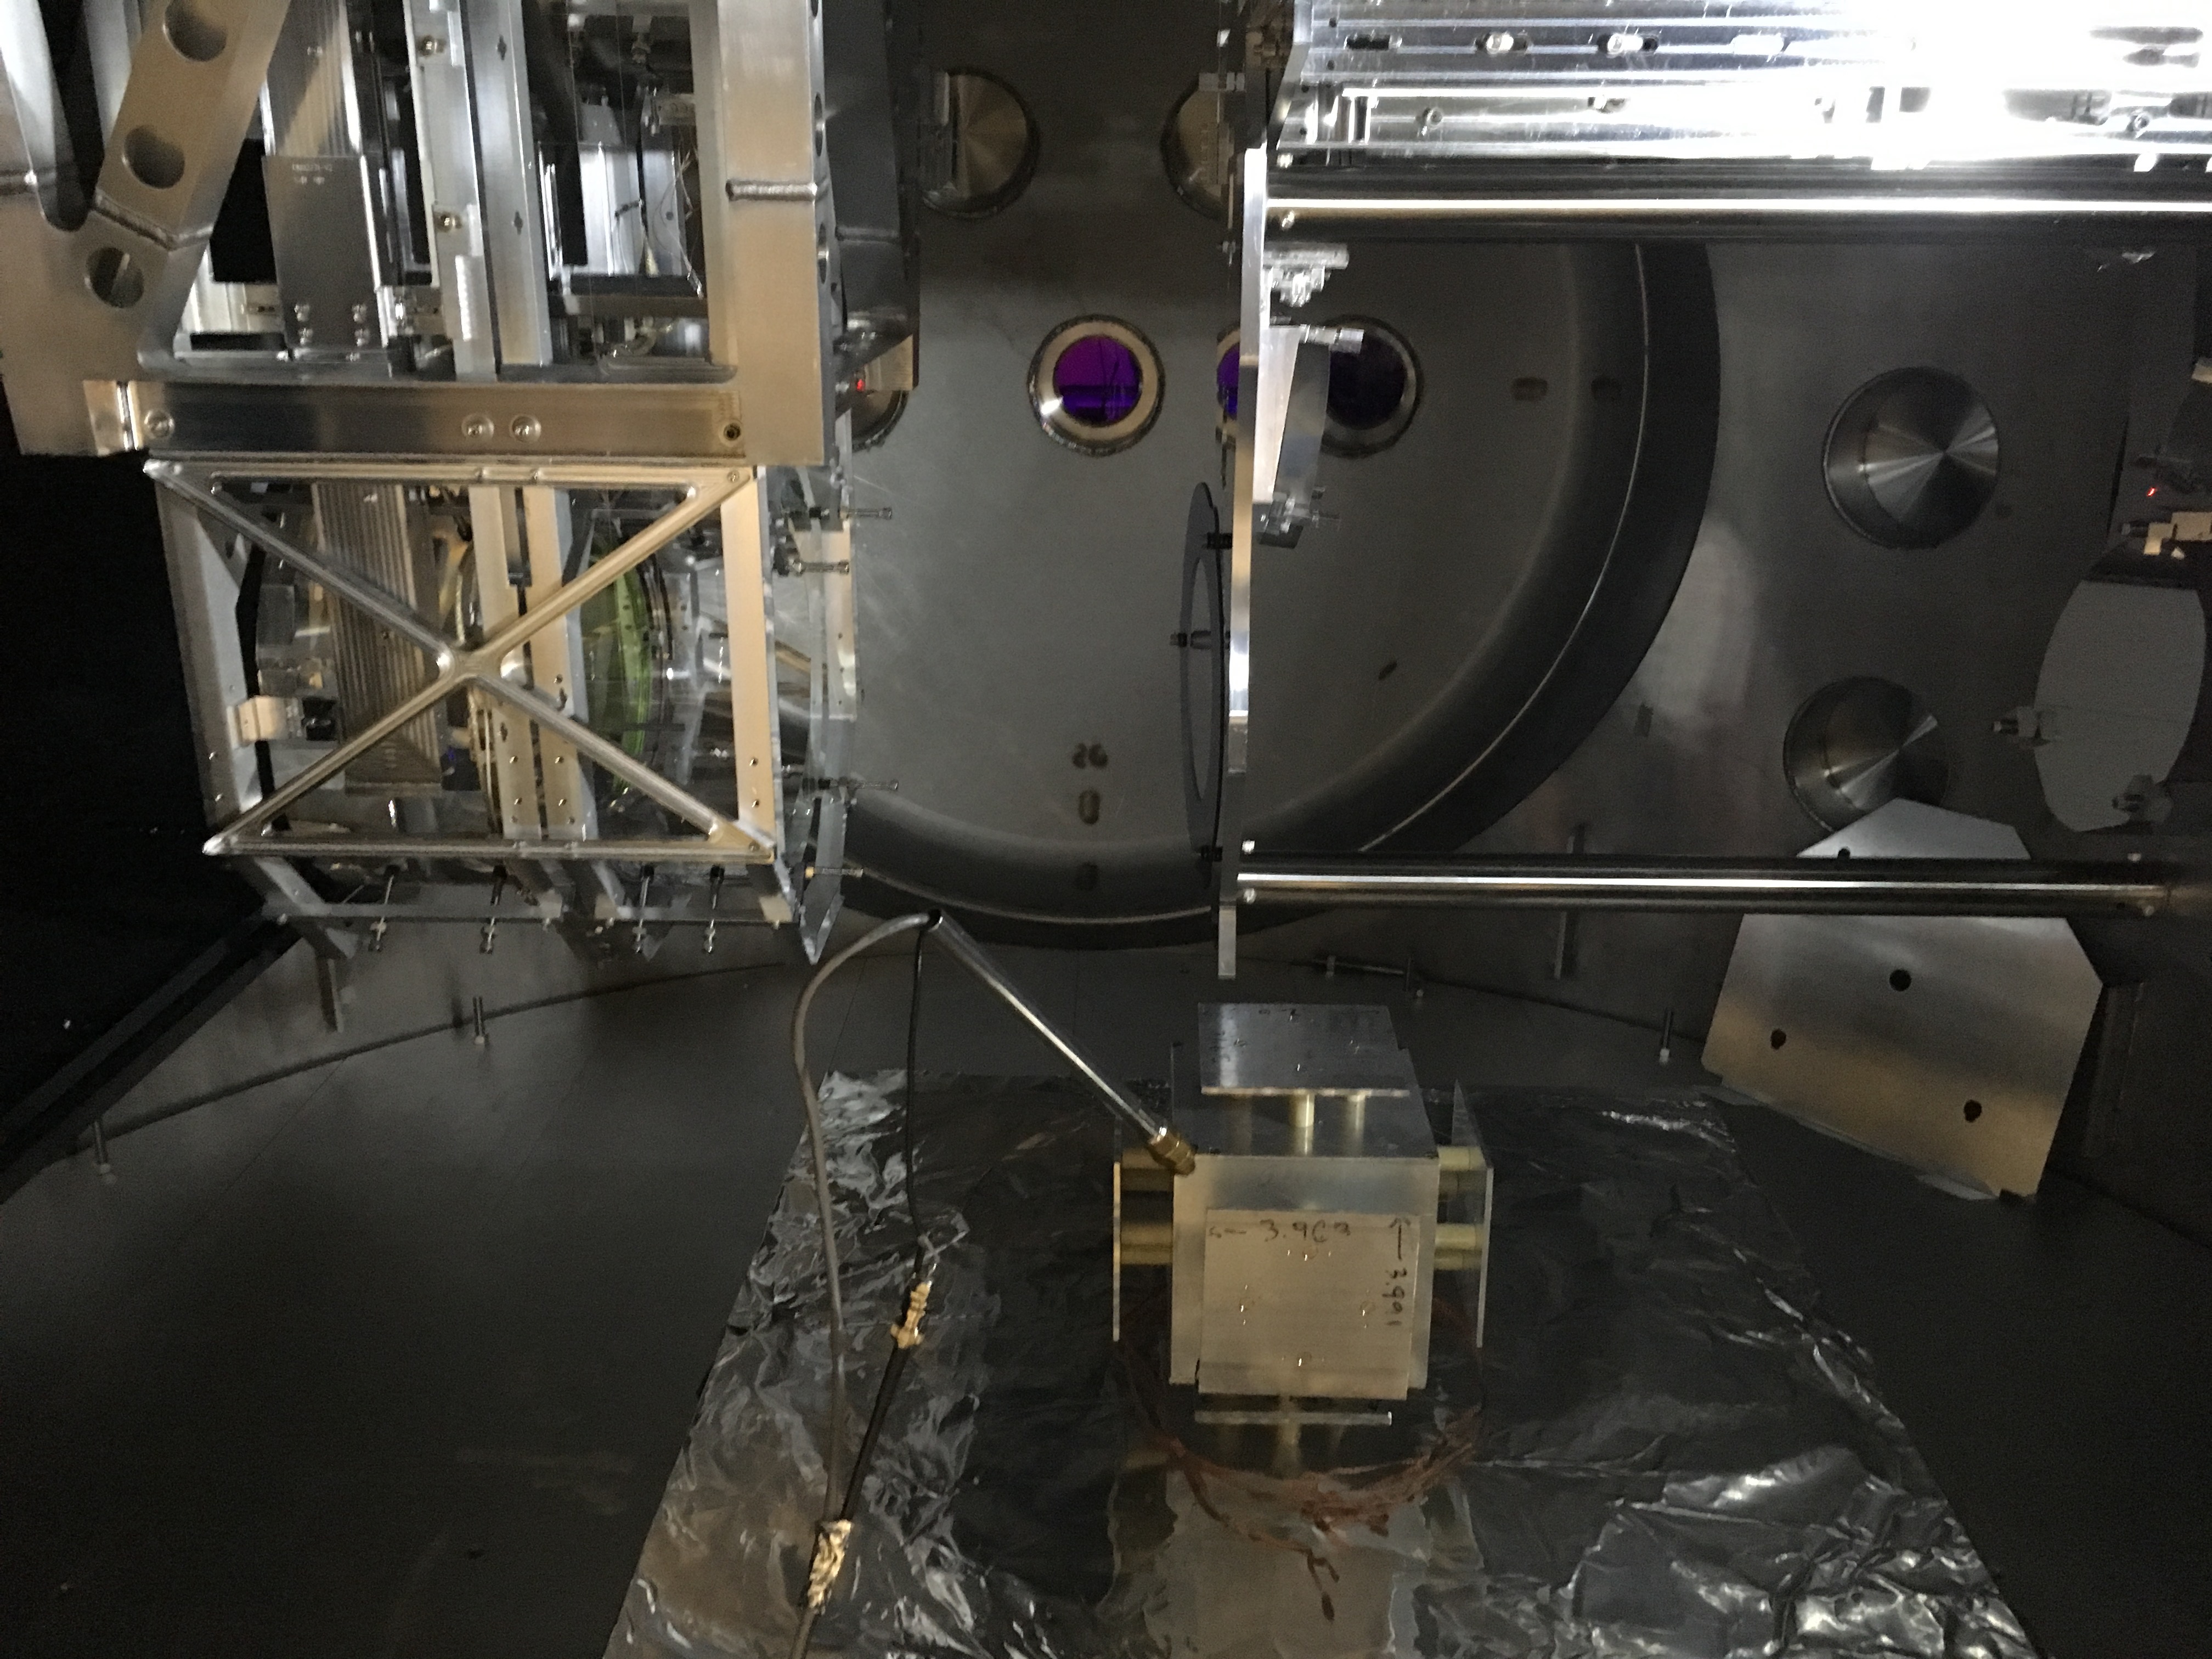
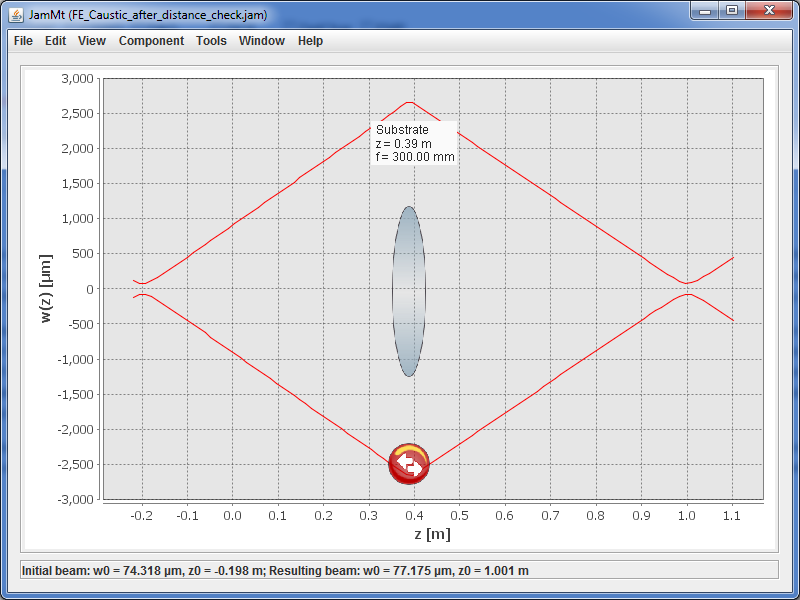
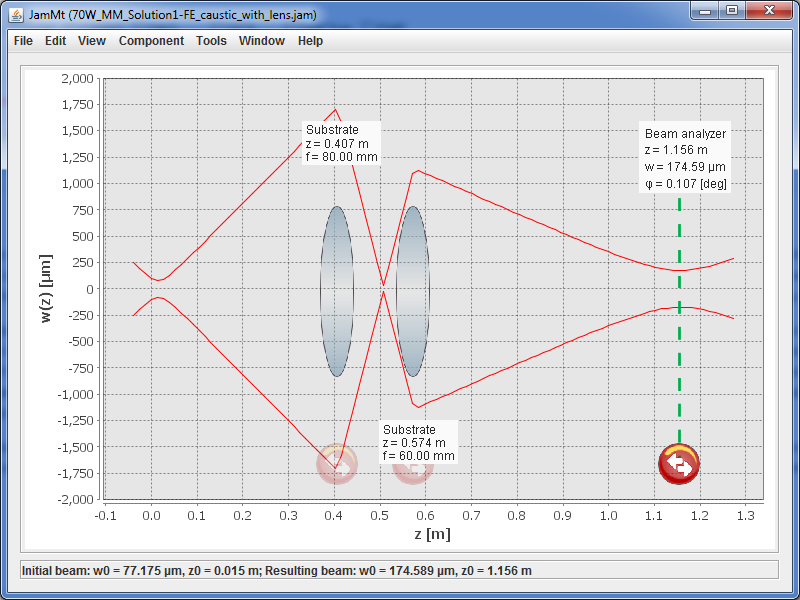
Using the same 300mm focal length lens, we took a measurement of the FE beam caustic, attached as LHO_FE_Caustic1.txt. The first column is scale position in cm (corrected for the fact we had the wrong location of the sensor in the profiler when taking the measurement), and the last 2 columns are horizontal and vertical beam radii in µm, respectively. This was imported into JamMT, the lens added, and the resulting FE waist given as 77.2 µm in radius, positioned ~15mm outside of the FE box. This is uploaded as FE_caustic_after_distance_check.png (z=0 is the end of the scale used to take the caustic measurement, all distances are relative to that); we doubled checked all of our distance measurements this morning and made some small corrections, hence the filename. While the location makes sense, the beam radius seems small as the LIGO FE lasers were all measured to be between 150µm and 250µm; although we have swapped the NPRO in the FE, which can have an effect on the waist size and location. JamMT yielded only one mode matching solution with this initial waist that fits within the constraints of the beam path; this is uploaded as 70W_MM_solution1-FE_caustic_with_lens.png. Unfortunately, I didn't think to take a picture of the measurement setup used; I'll take one tomorrow morning and upload it as a comment to this alog.
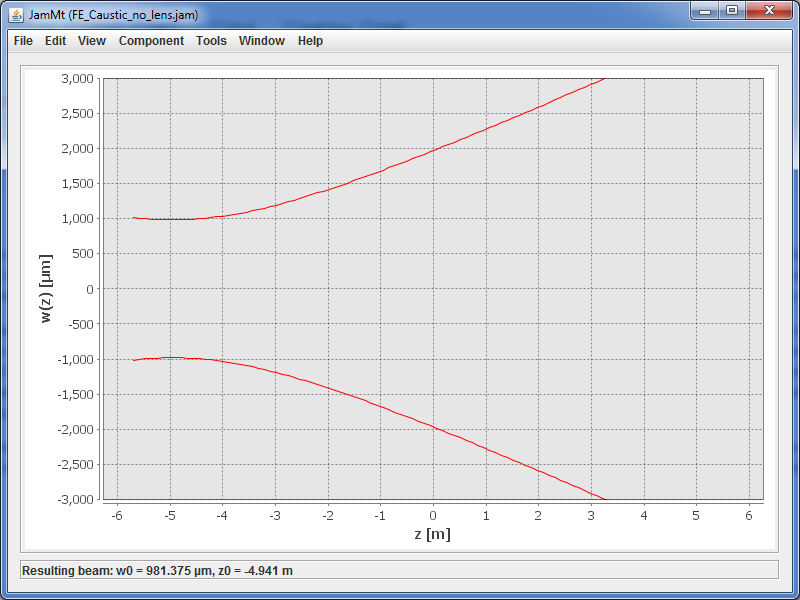
As a double check, we measured the caustic with no lens in place, and followed the same procedure as above. The measurement is uploaded as LHO_FE_Caustic_no_lens.txt (same units as the previous .txt file, this time the position dimension is referenced to the FE box (since there was no lens installed)), and the resulting FE waist as FE_Caustic_no_lens.png. As can be seen, something is not quite right with this measurement as it claims the waist is 2mm in diameter and located some 4.9 meters (yes, meters) behind the FE box (this is somewhere way past the NPRO and not in the FE box at all...), so this isn't the double check we thought it would be. We tried installing a 400mm focal length lens in place of the 300mm, but this put the resulting focus off the edge of the table; a 200mm focal length lens gets the spot too small for the profiler to give accurate measurements. We will do some more investigation of this in the morning (maybe try the 200mm lens anyway and see what we get), but at this point I think our best check is to set up the lenses from the given solution, put the Thorlabs profiler at the location the 70W amplifier expects the beam waist to be, and see what our beam diameter is. If we're close, then onward we go; if not, then more investigation is needed.

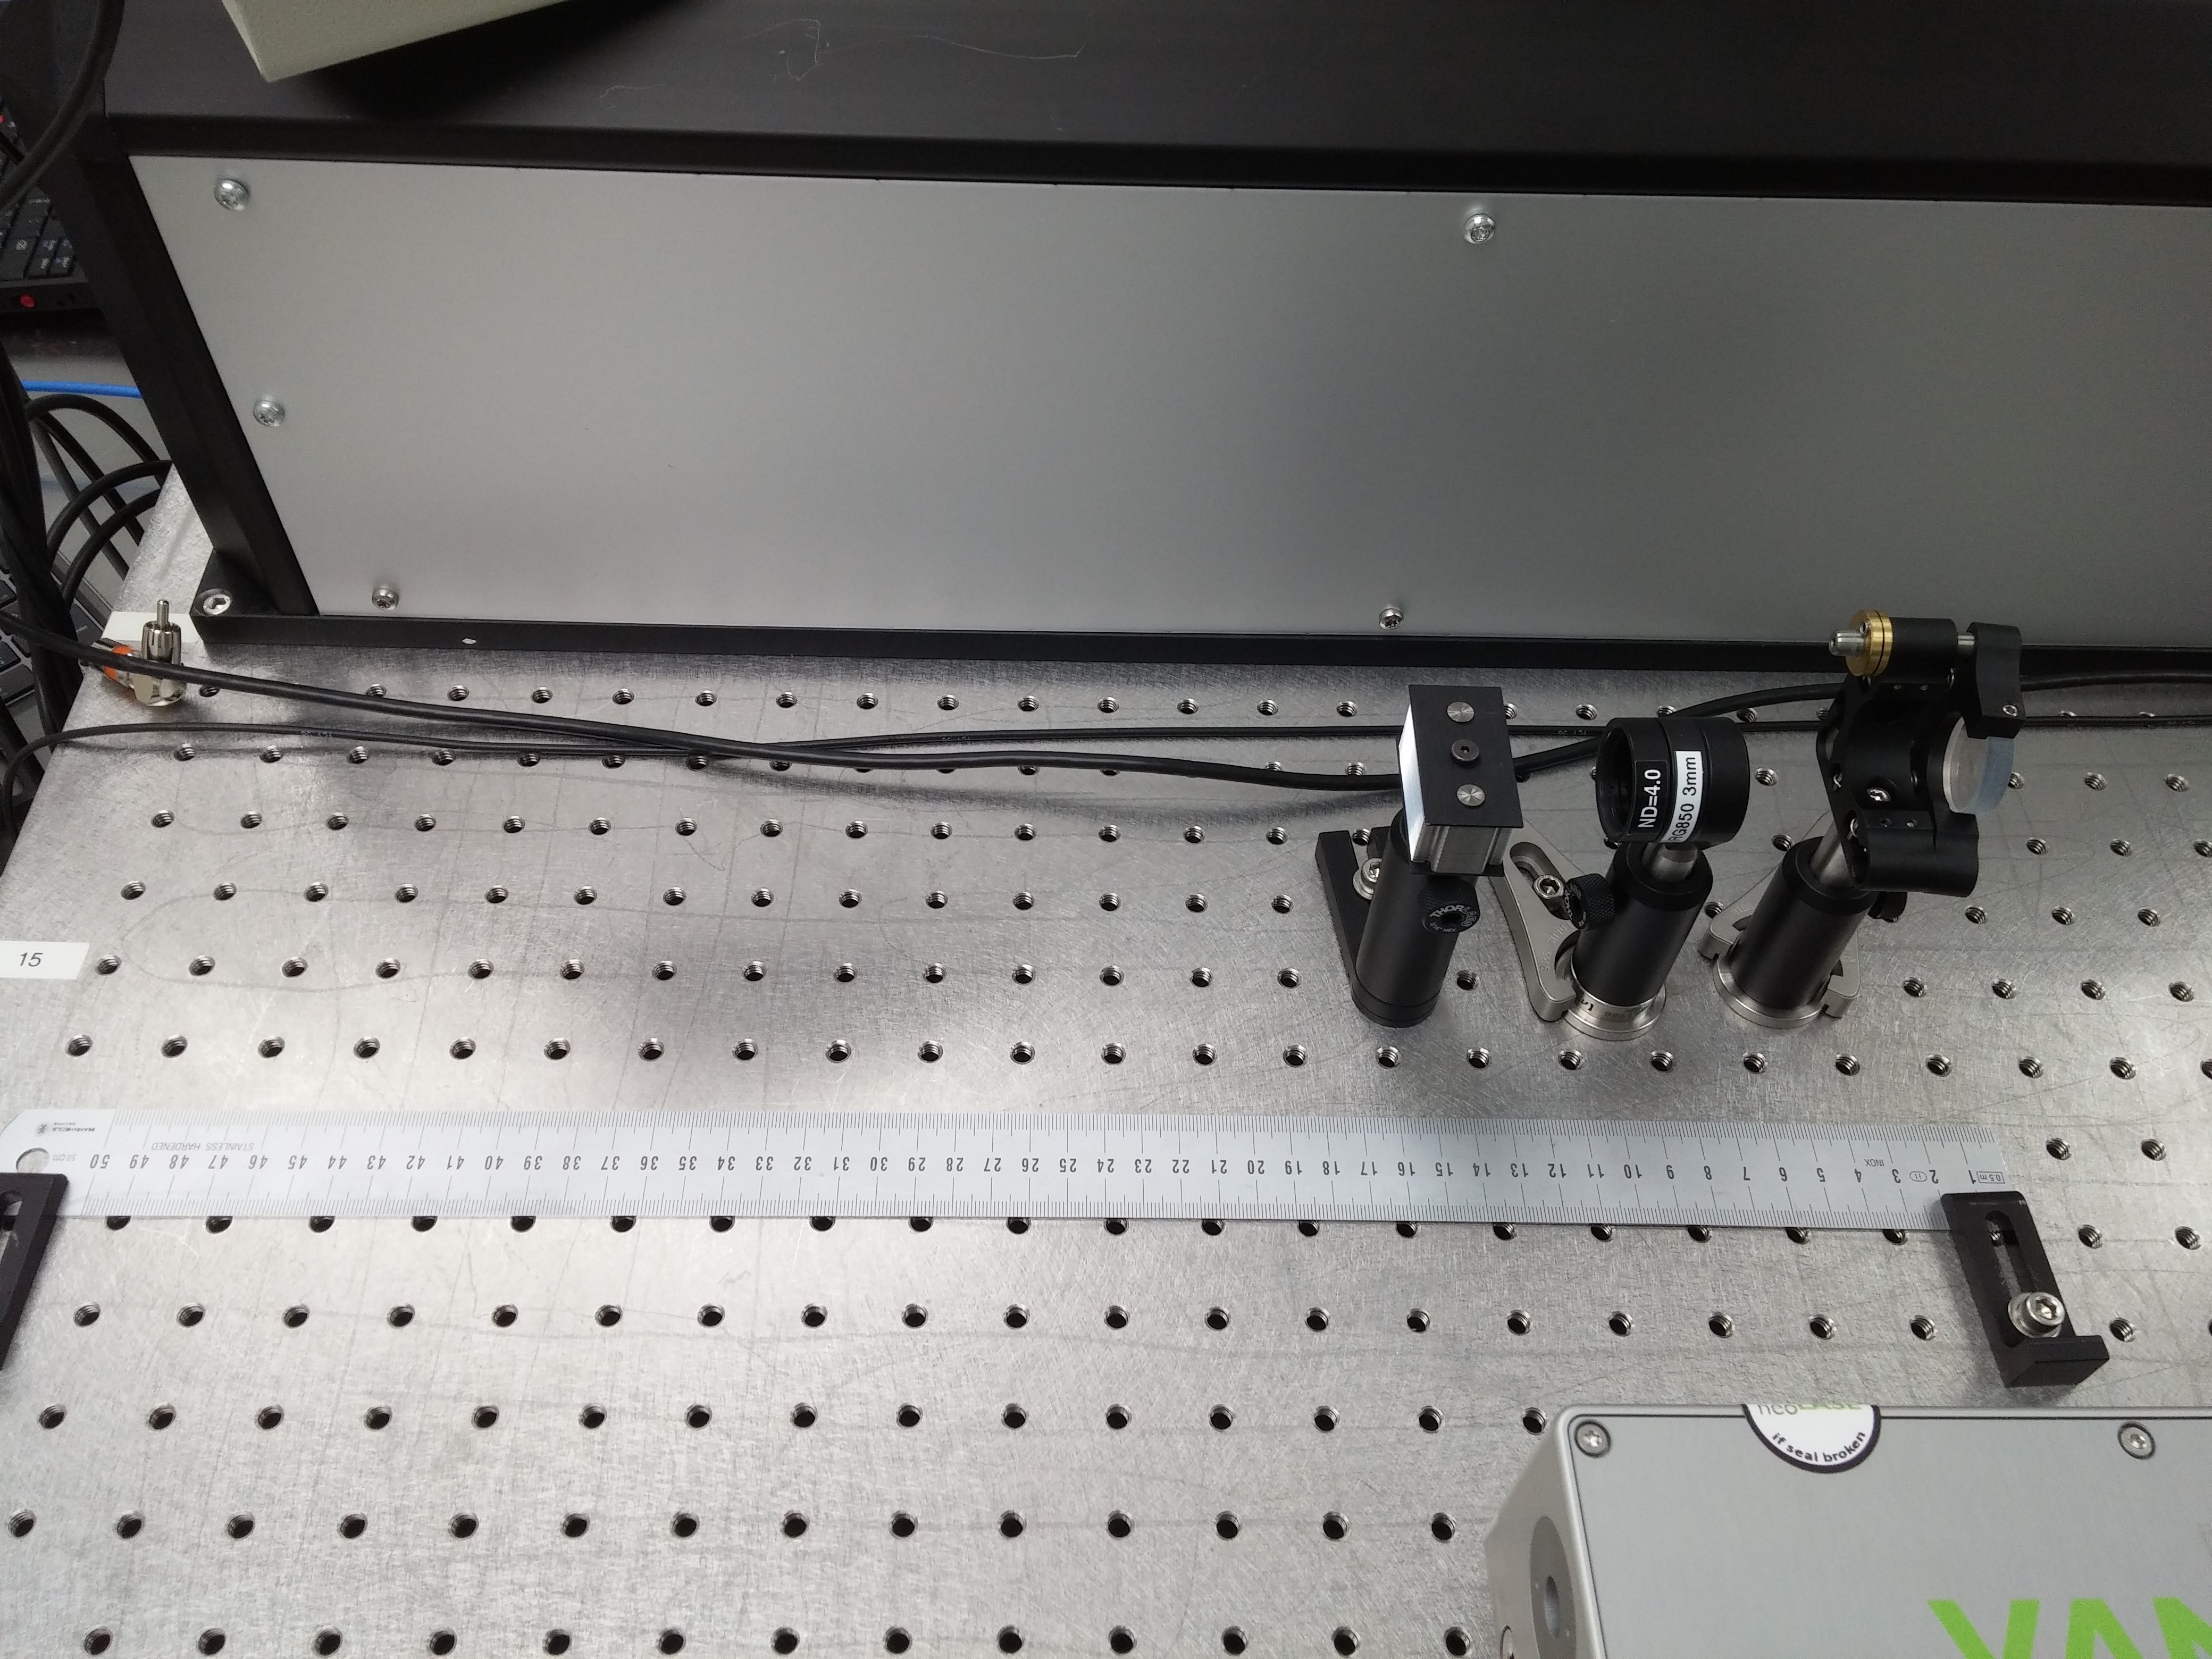
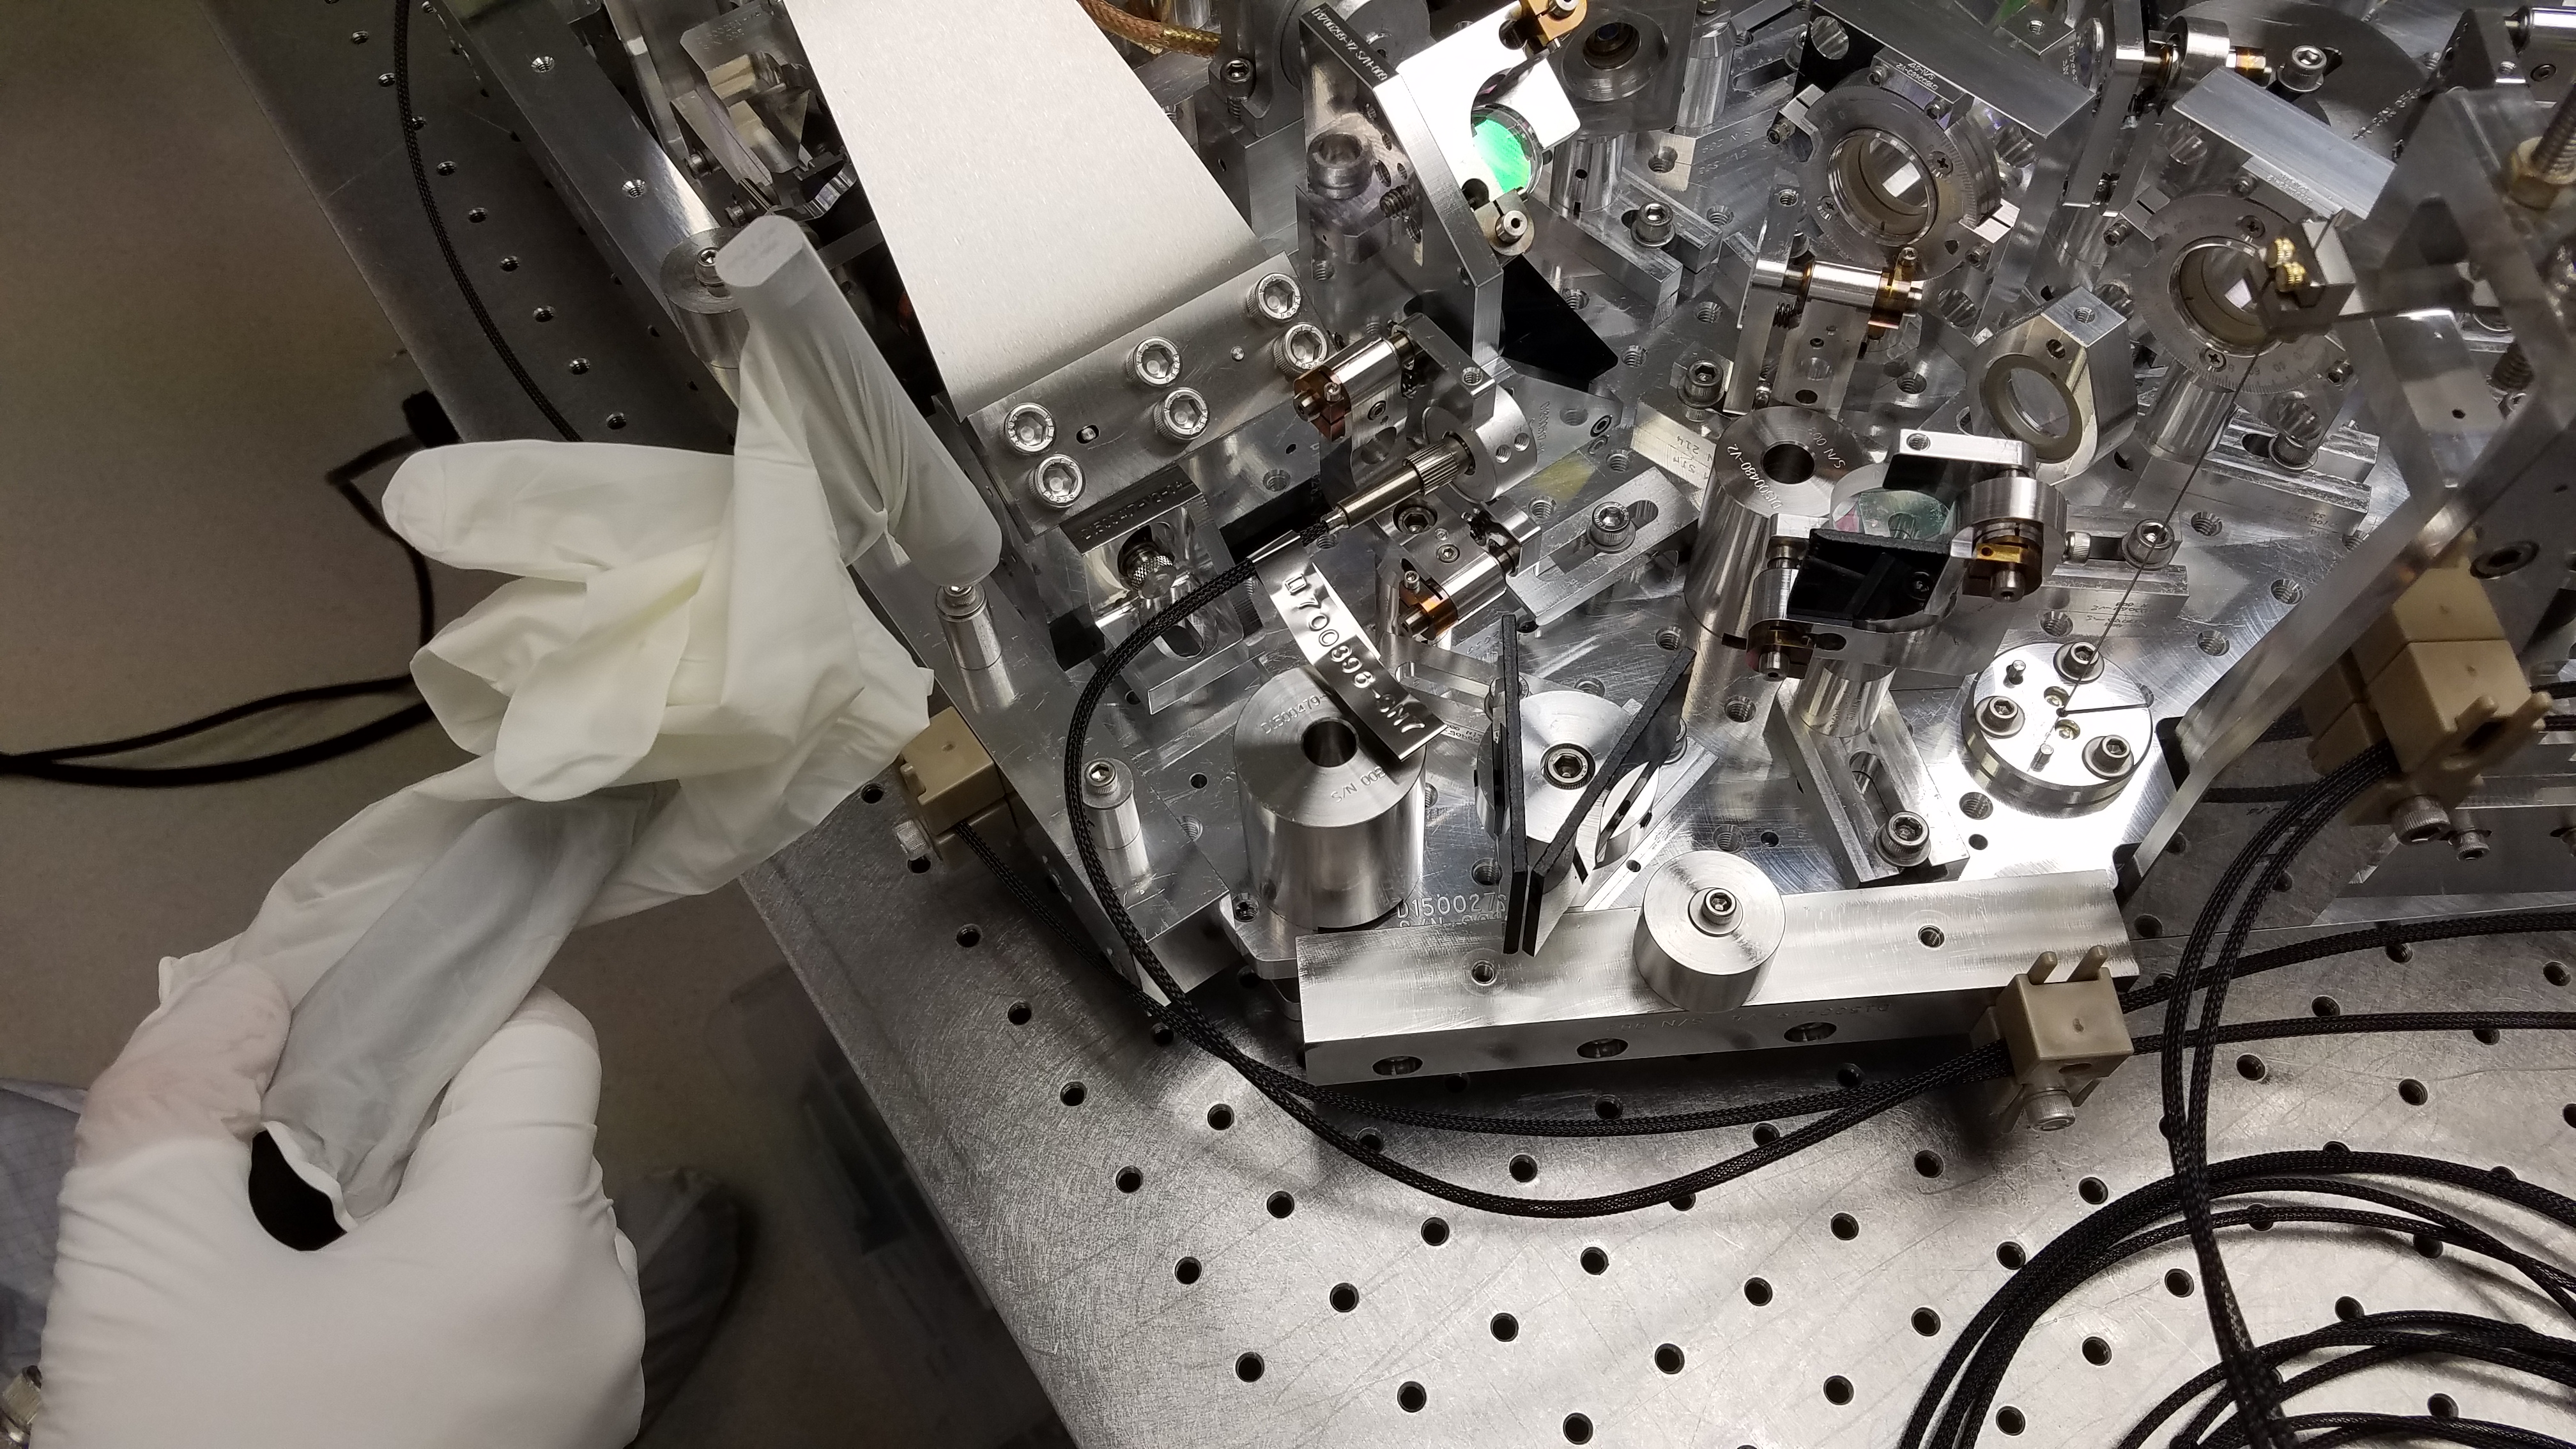
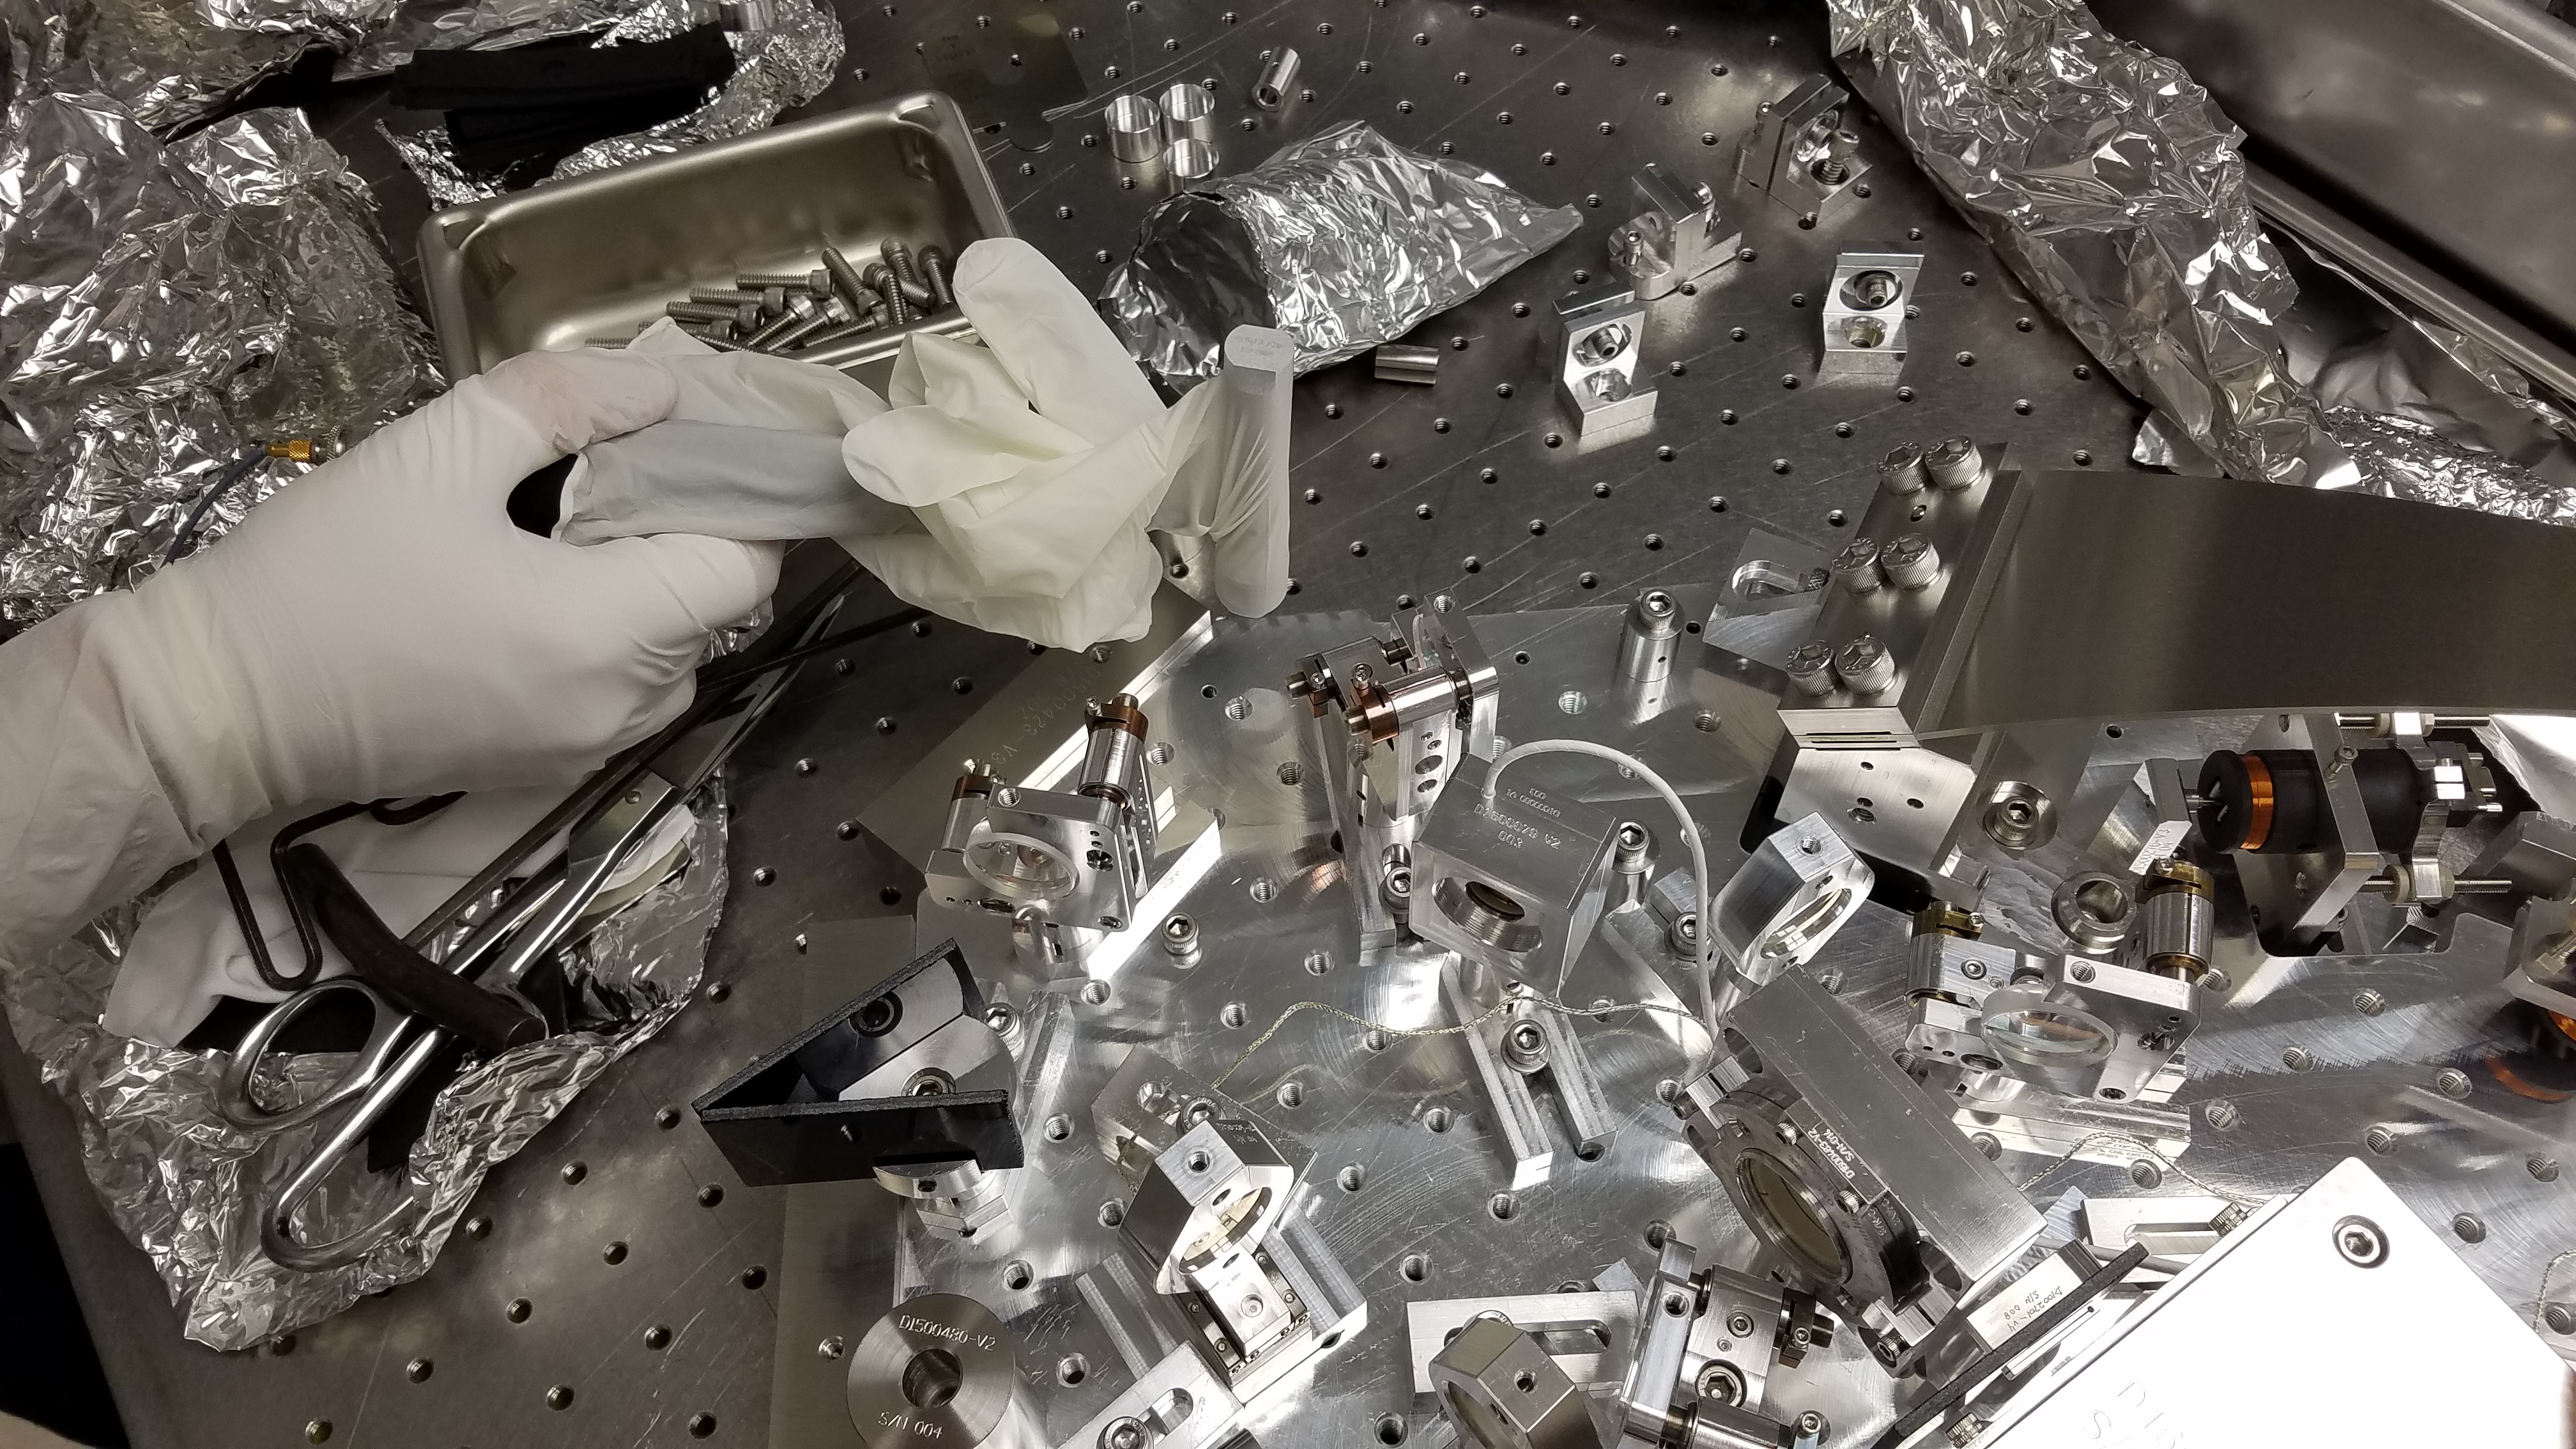
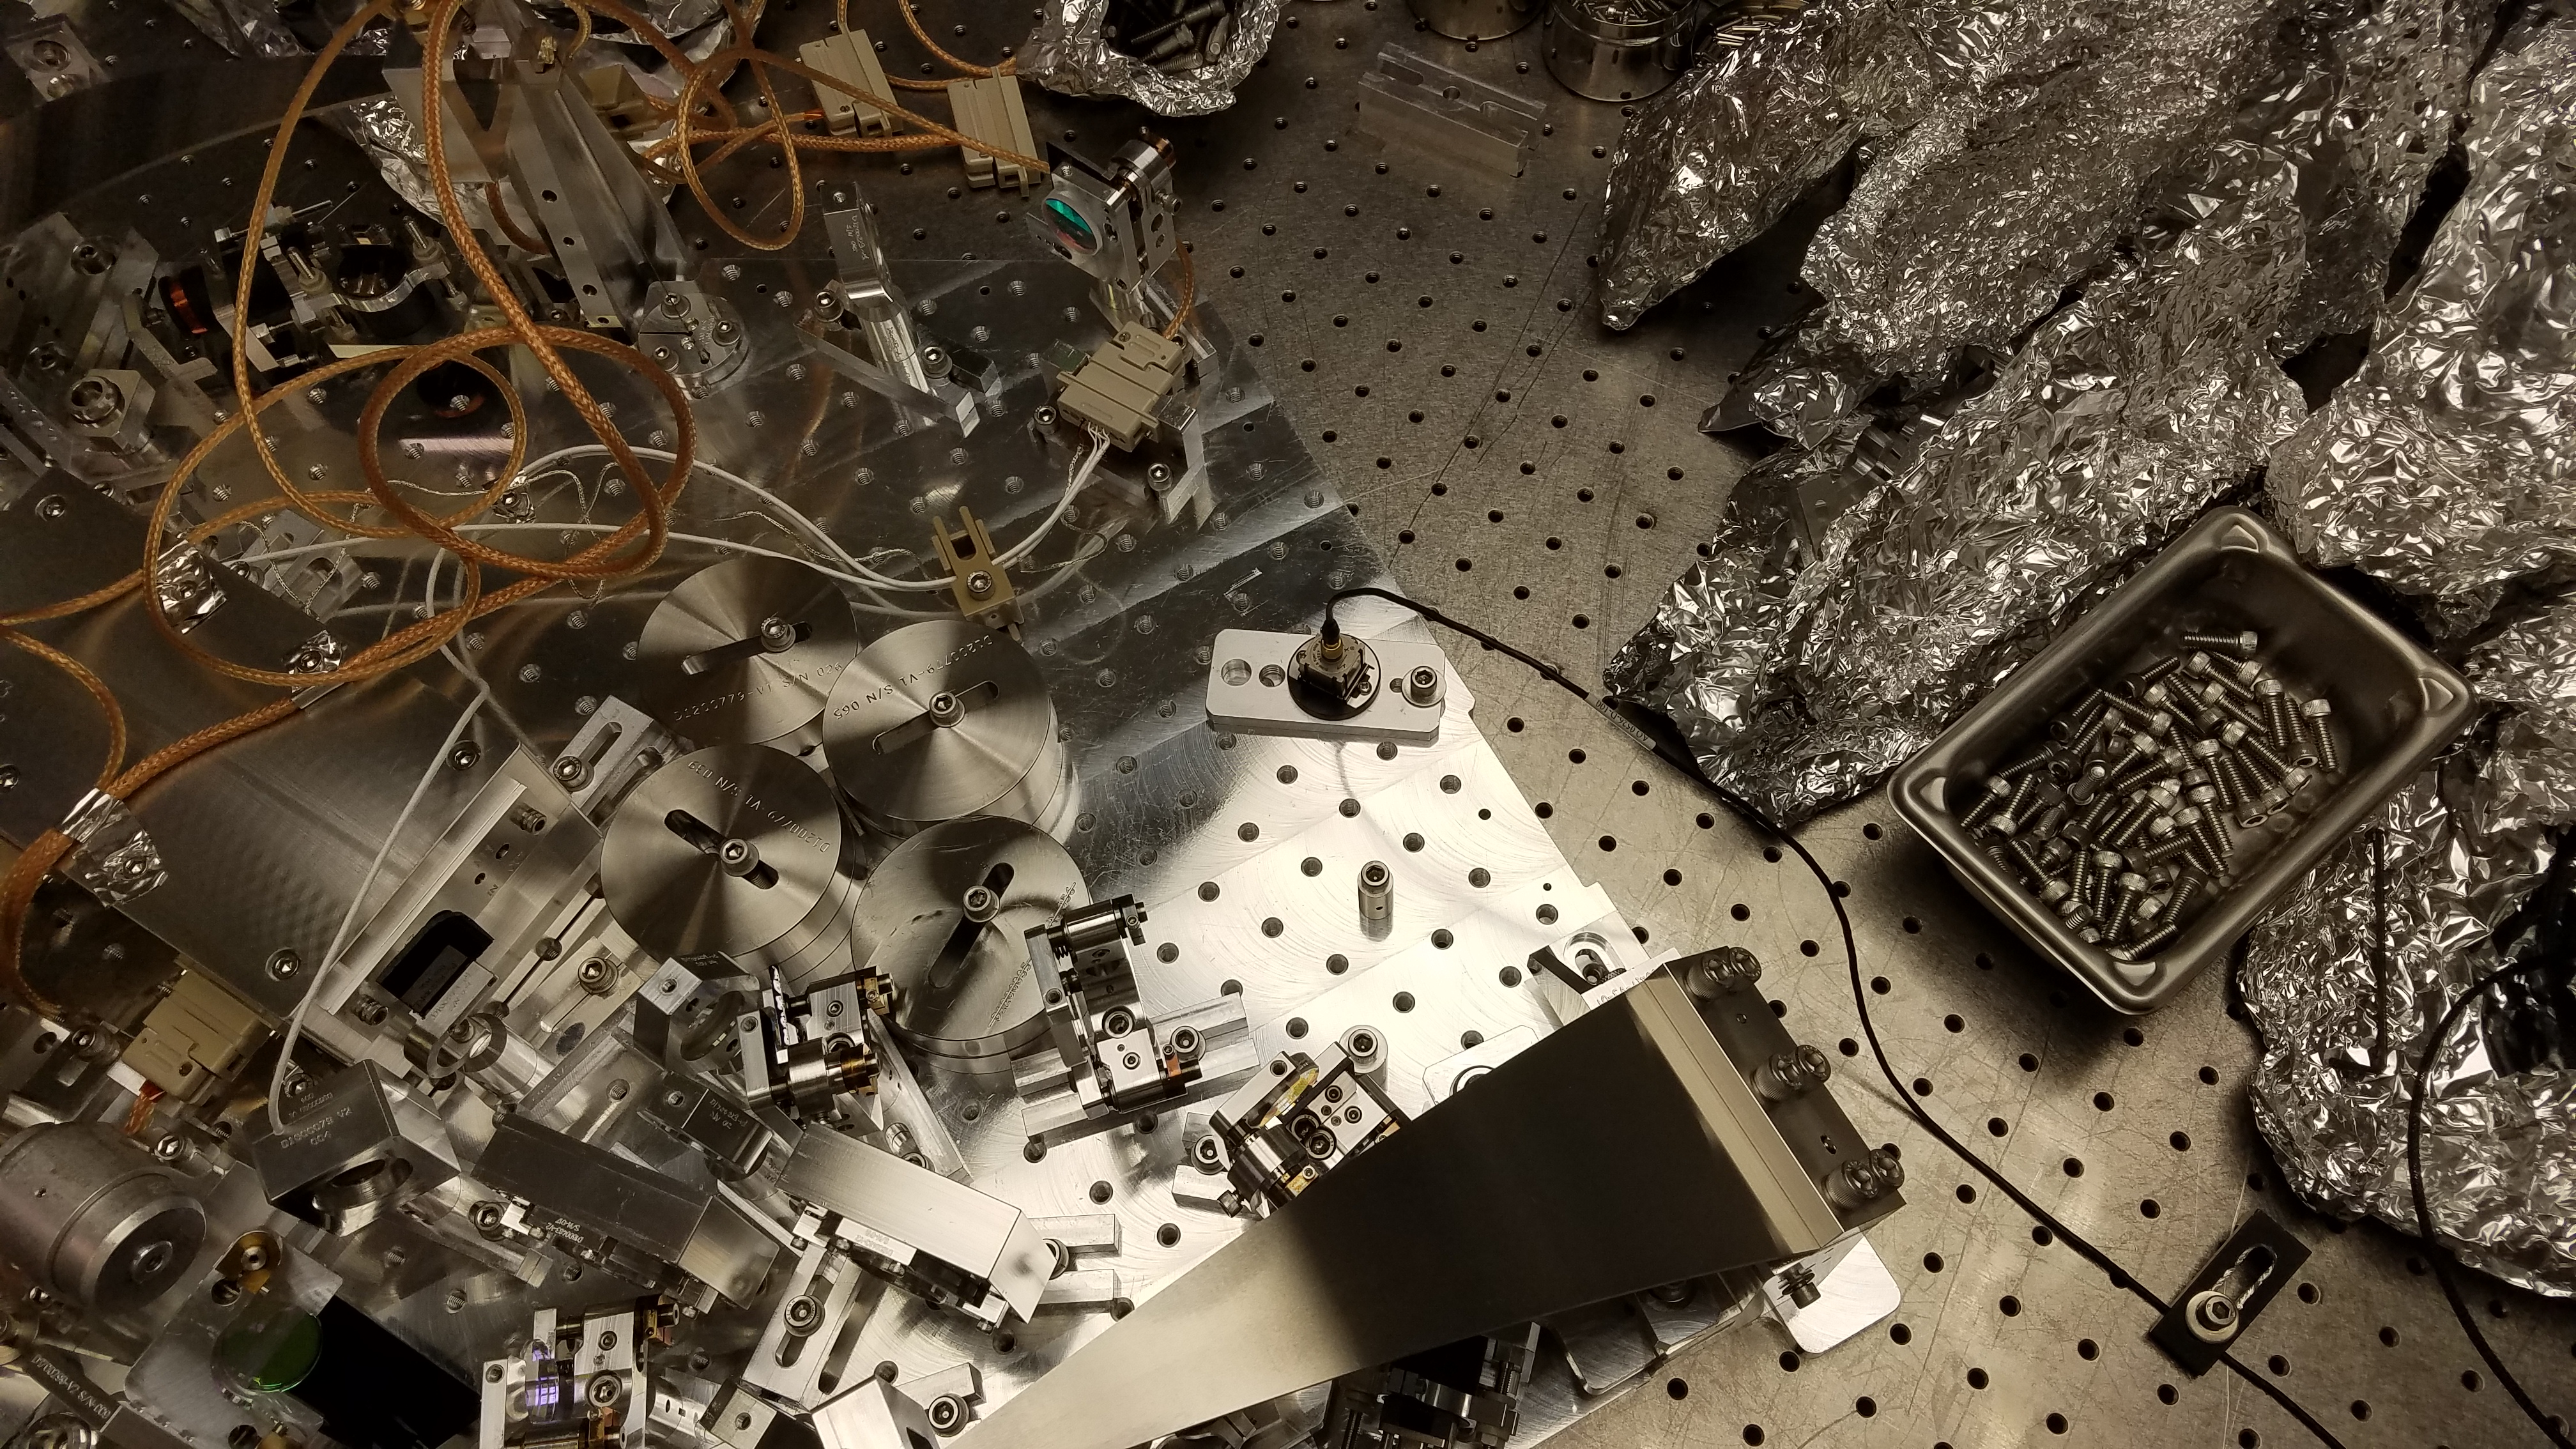
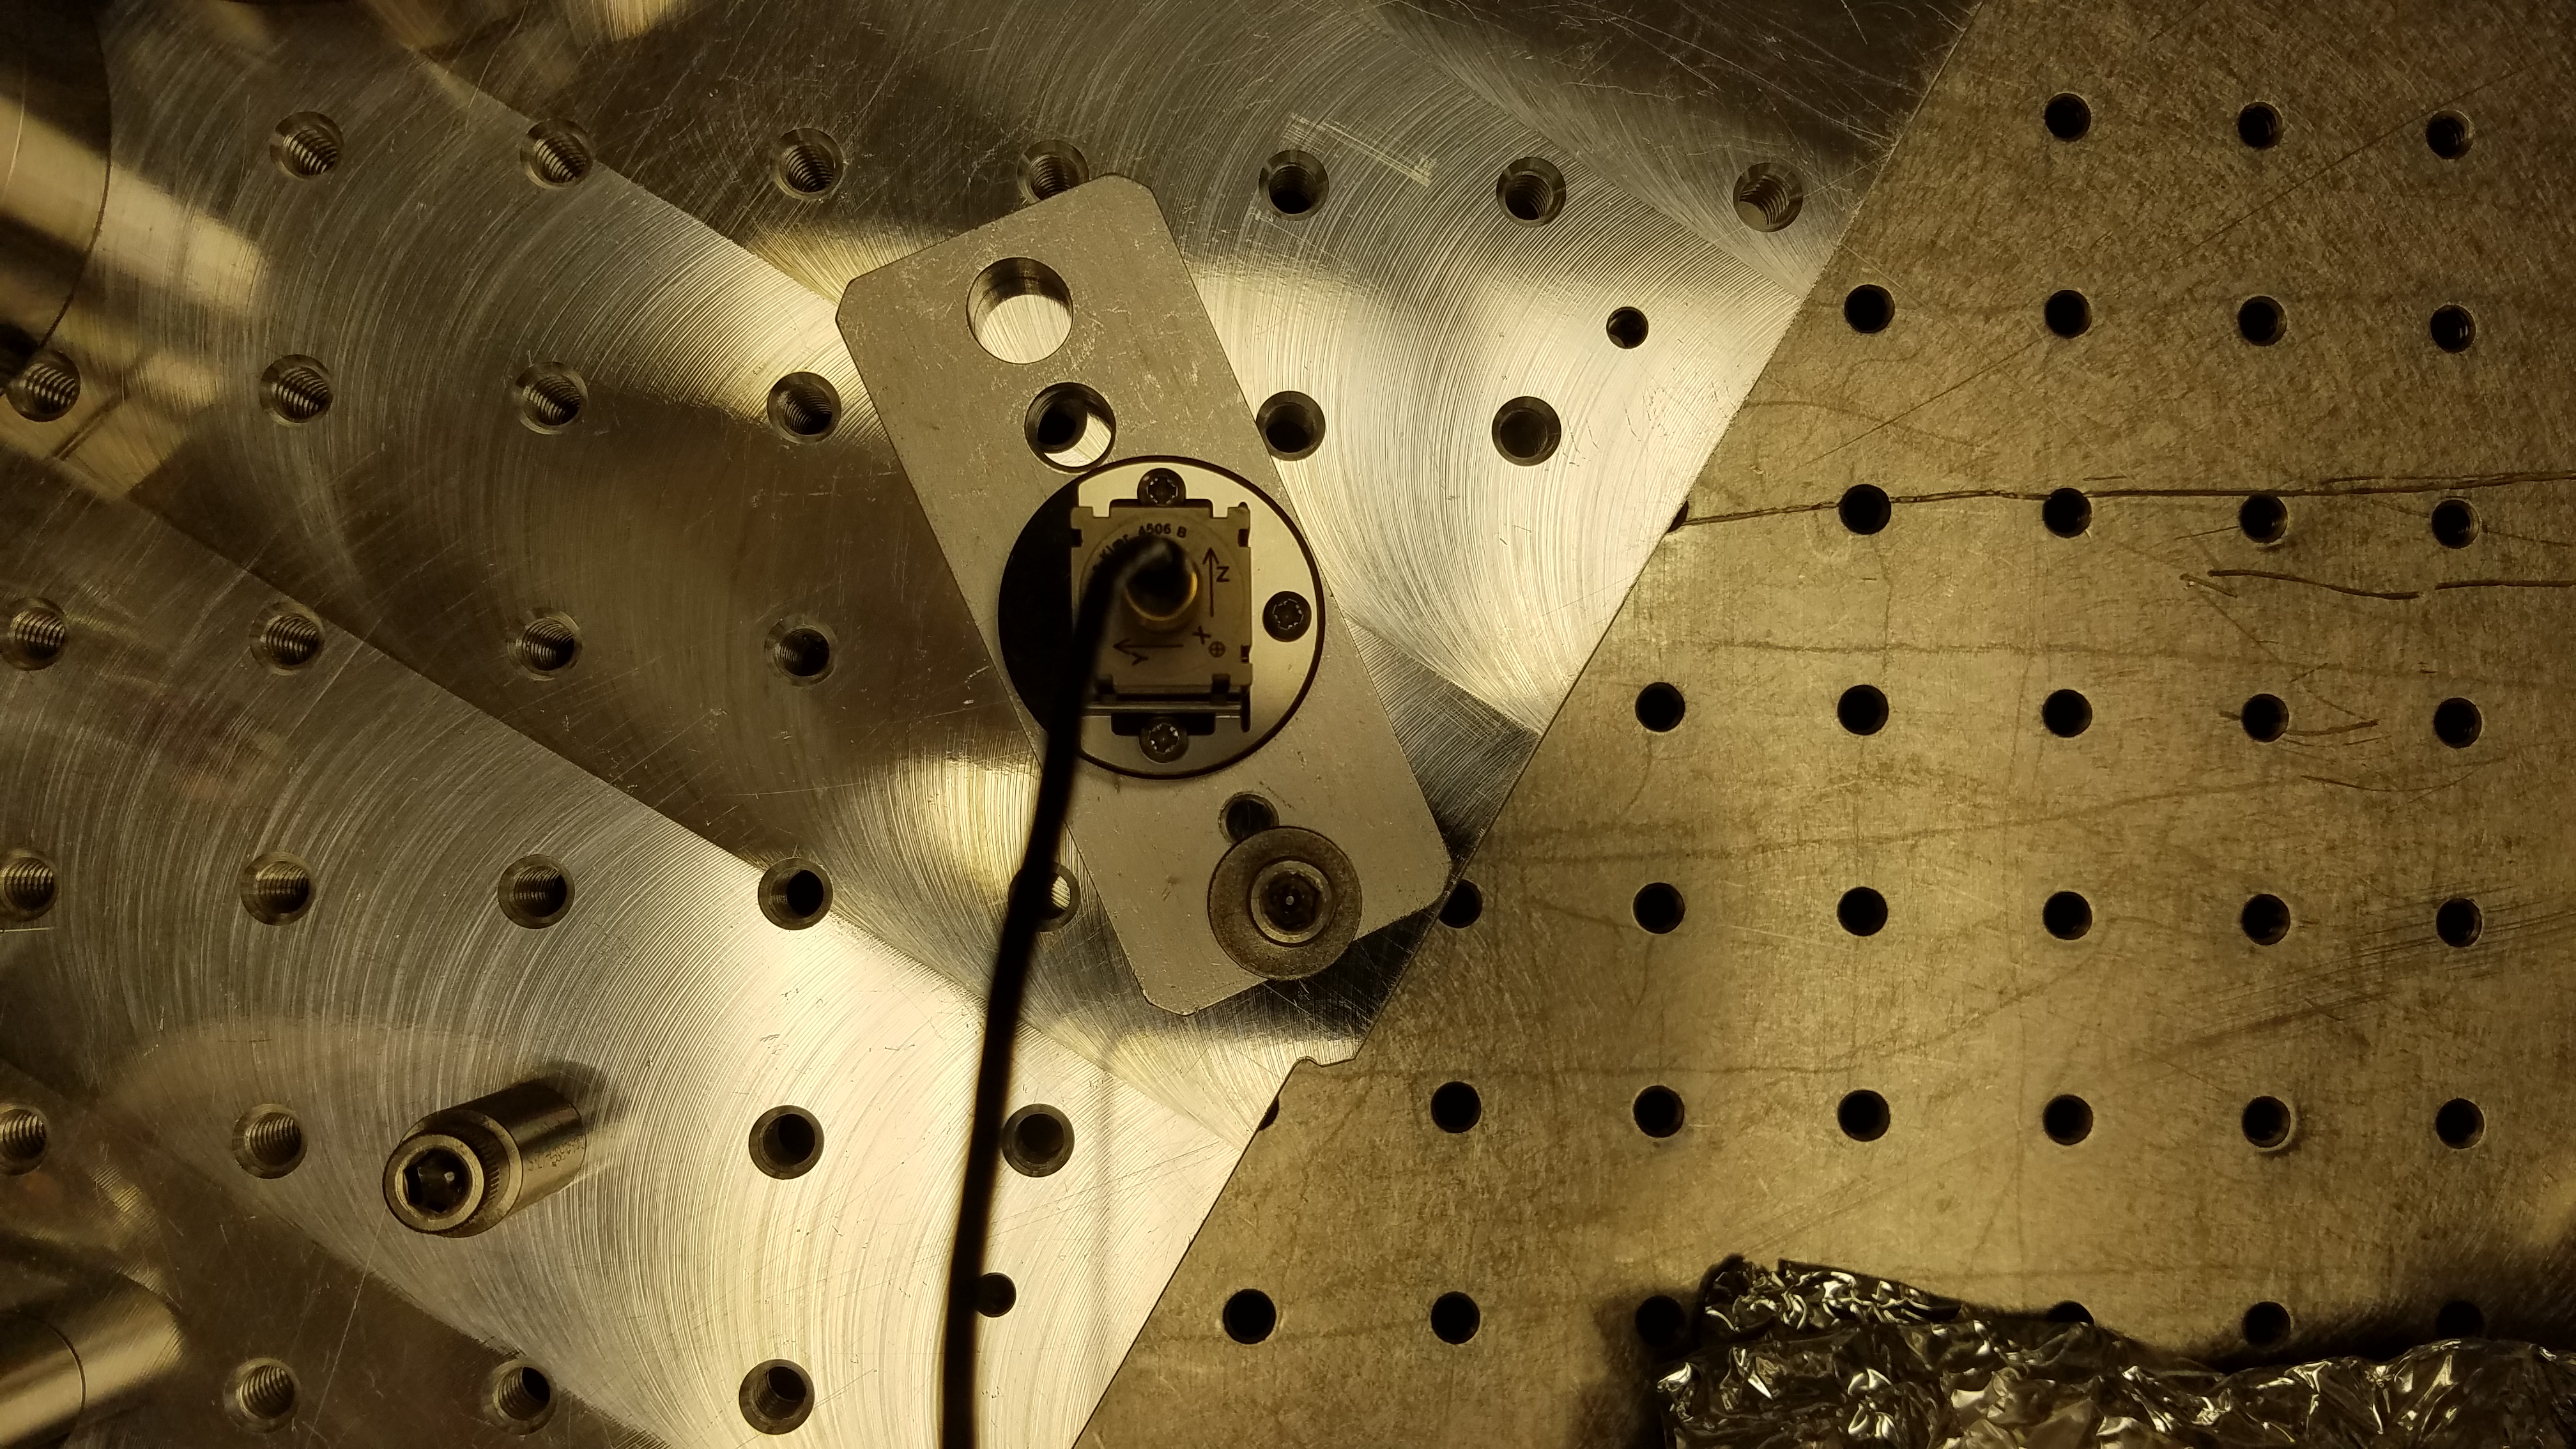
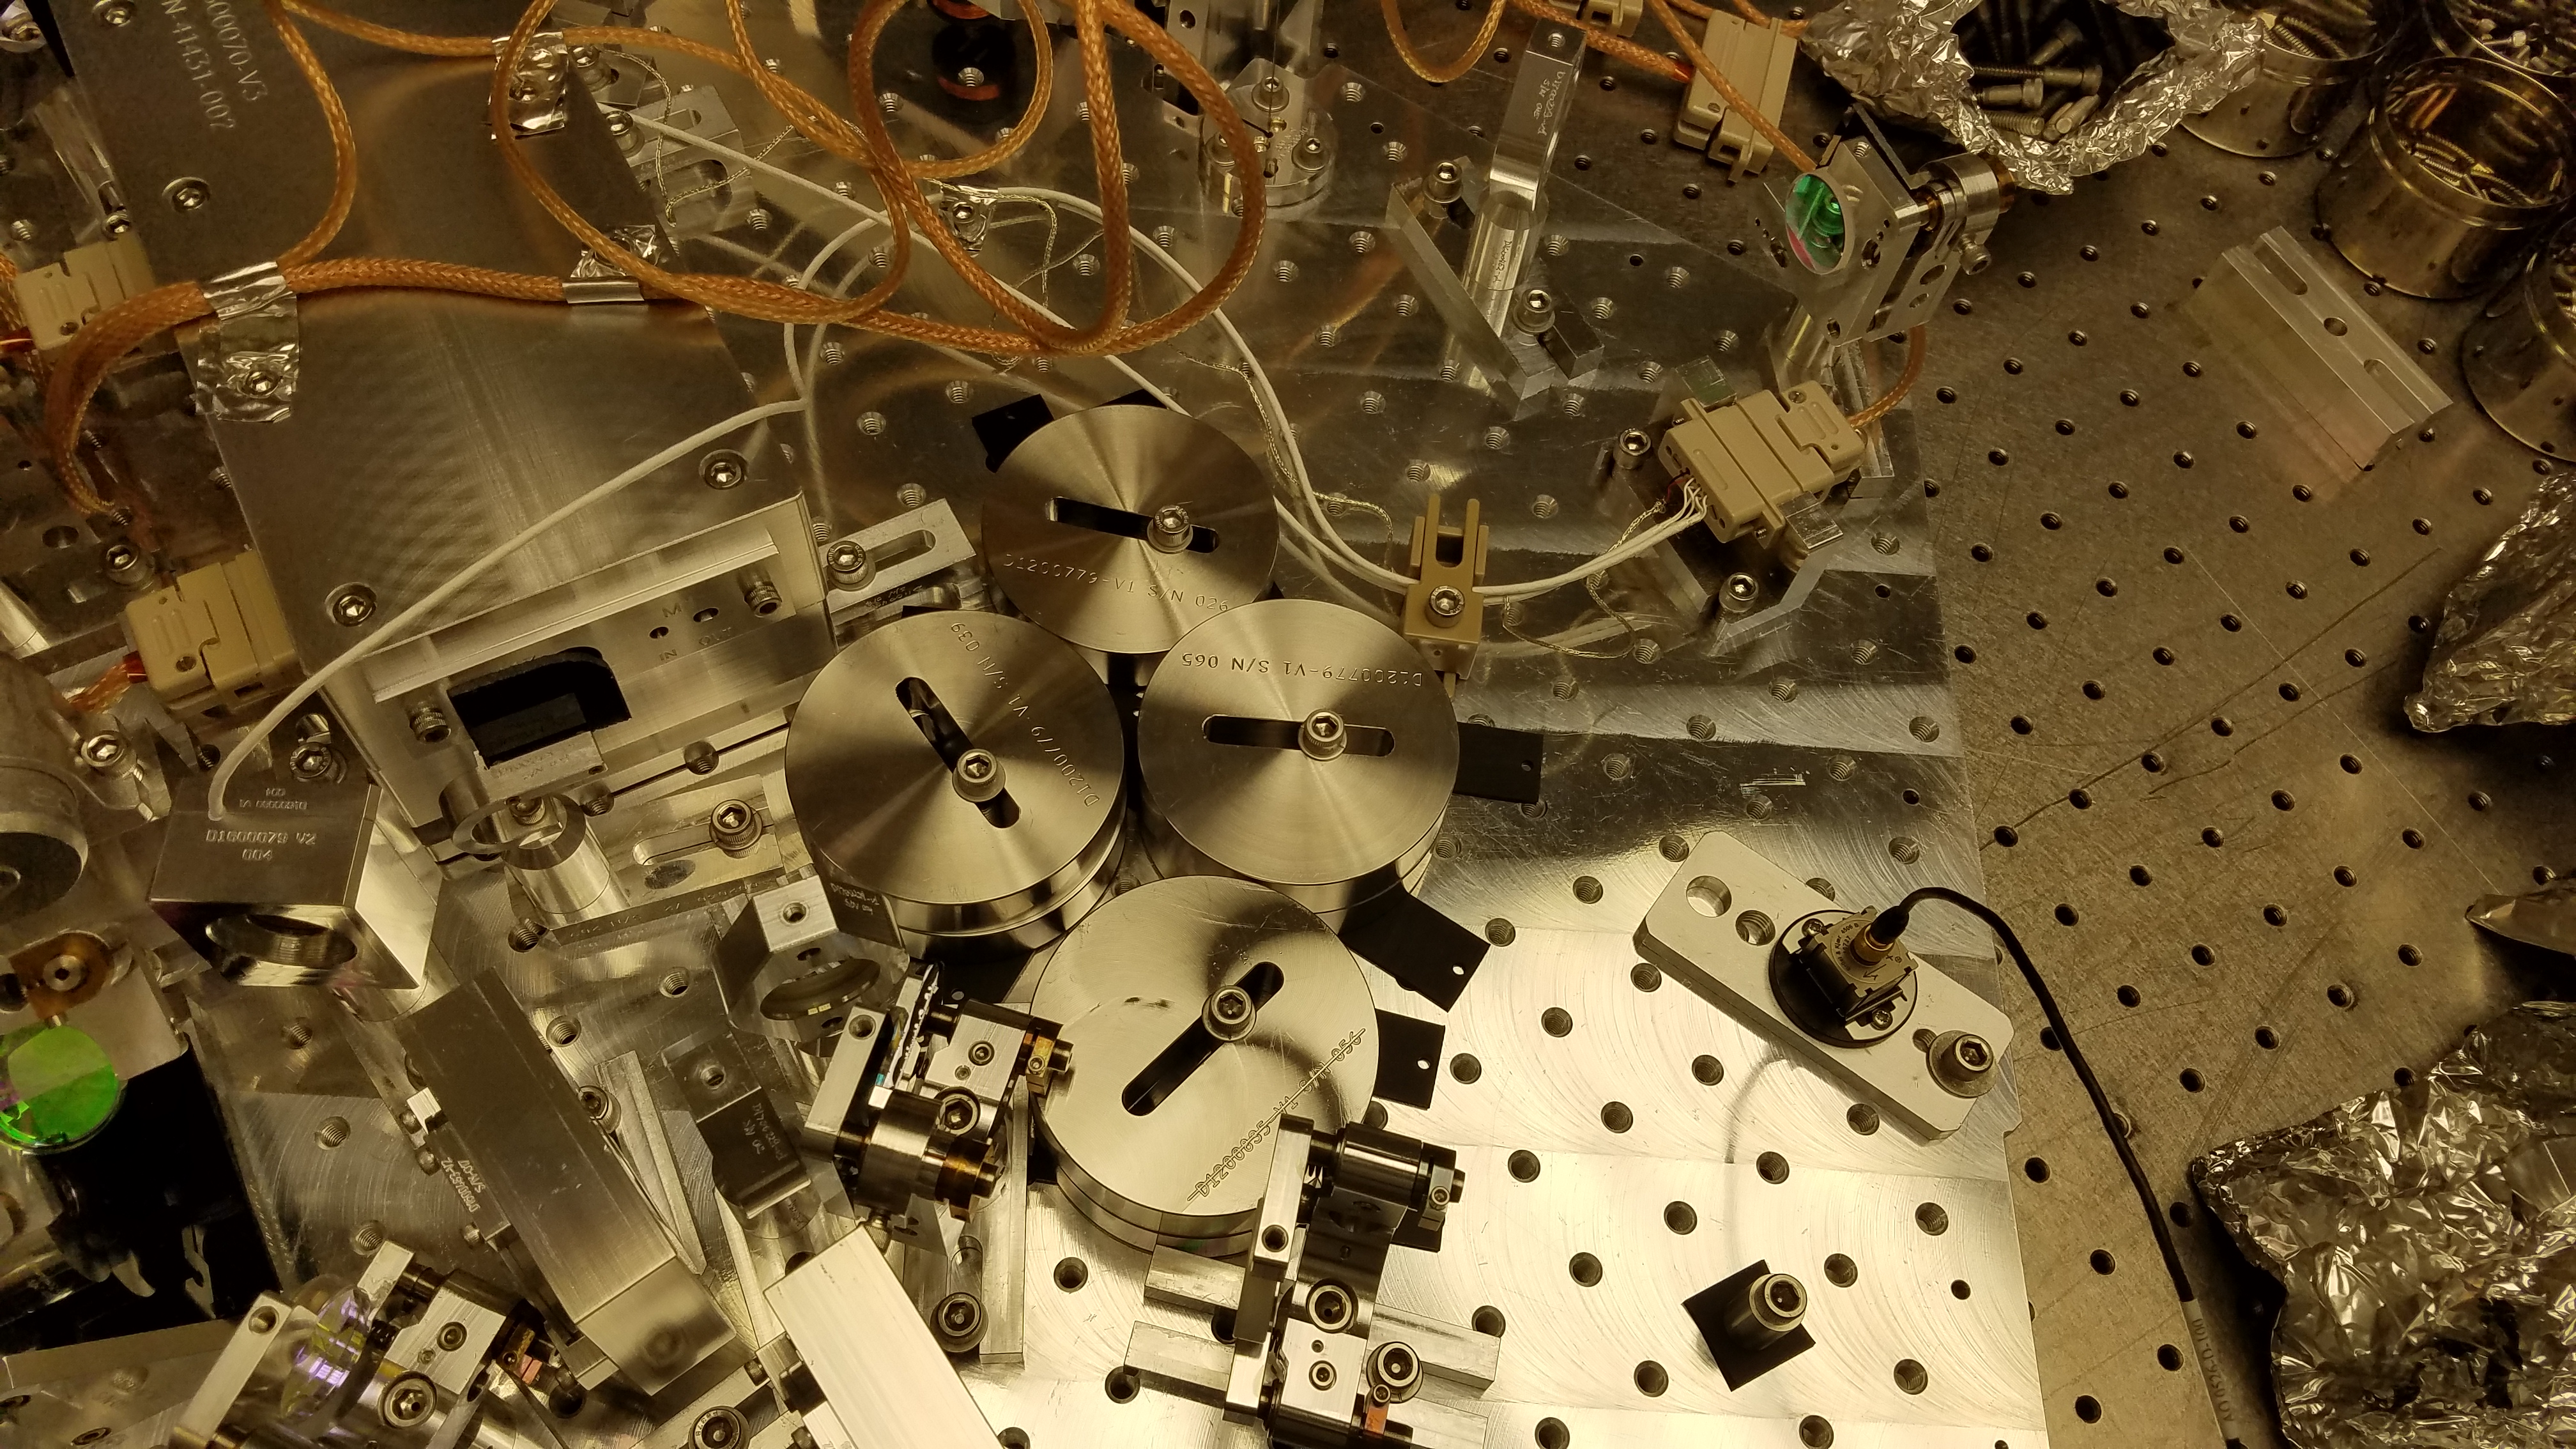
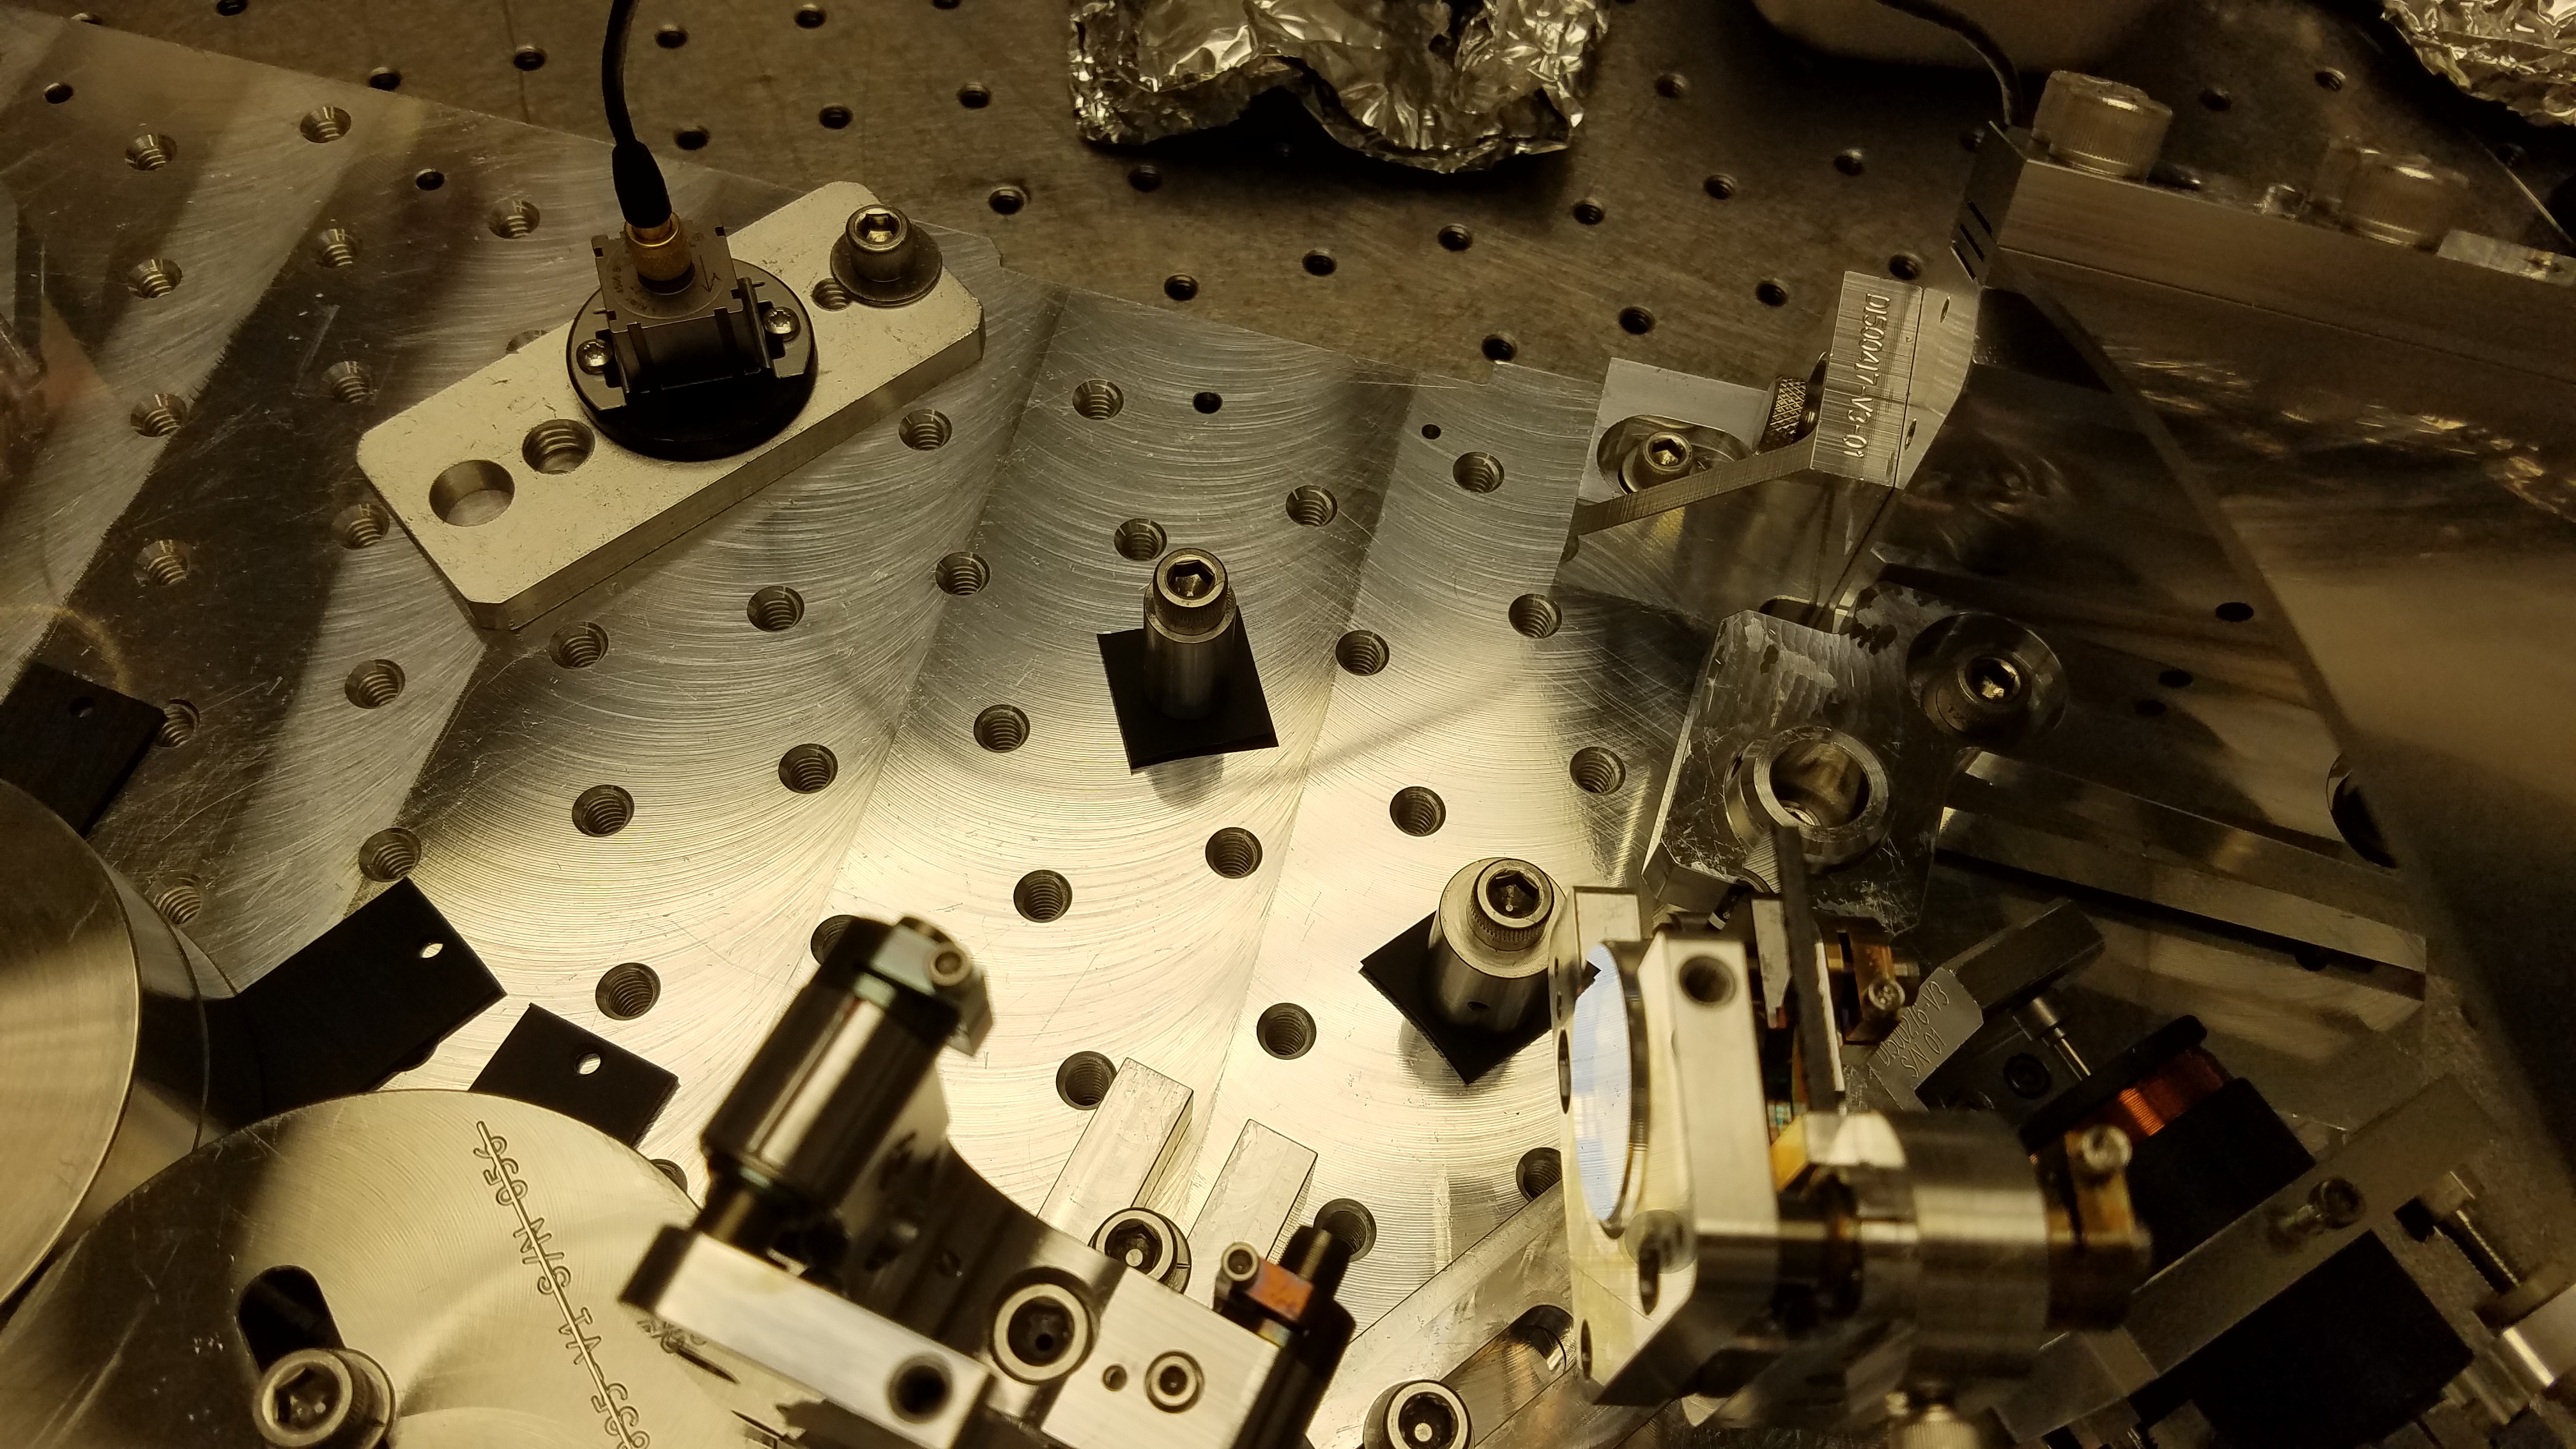
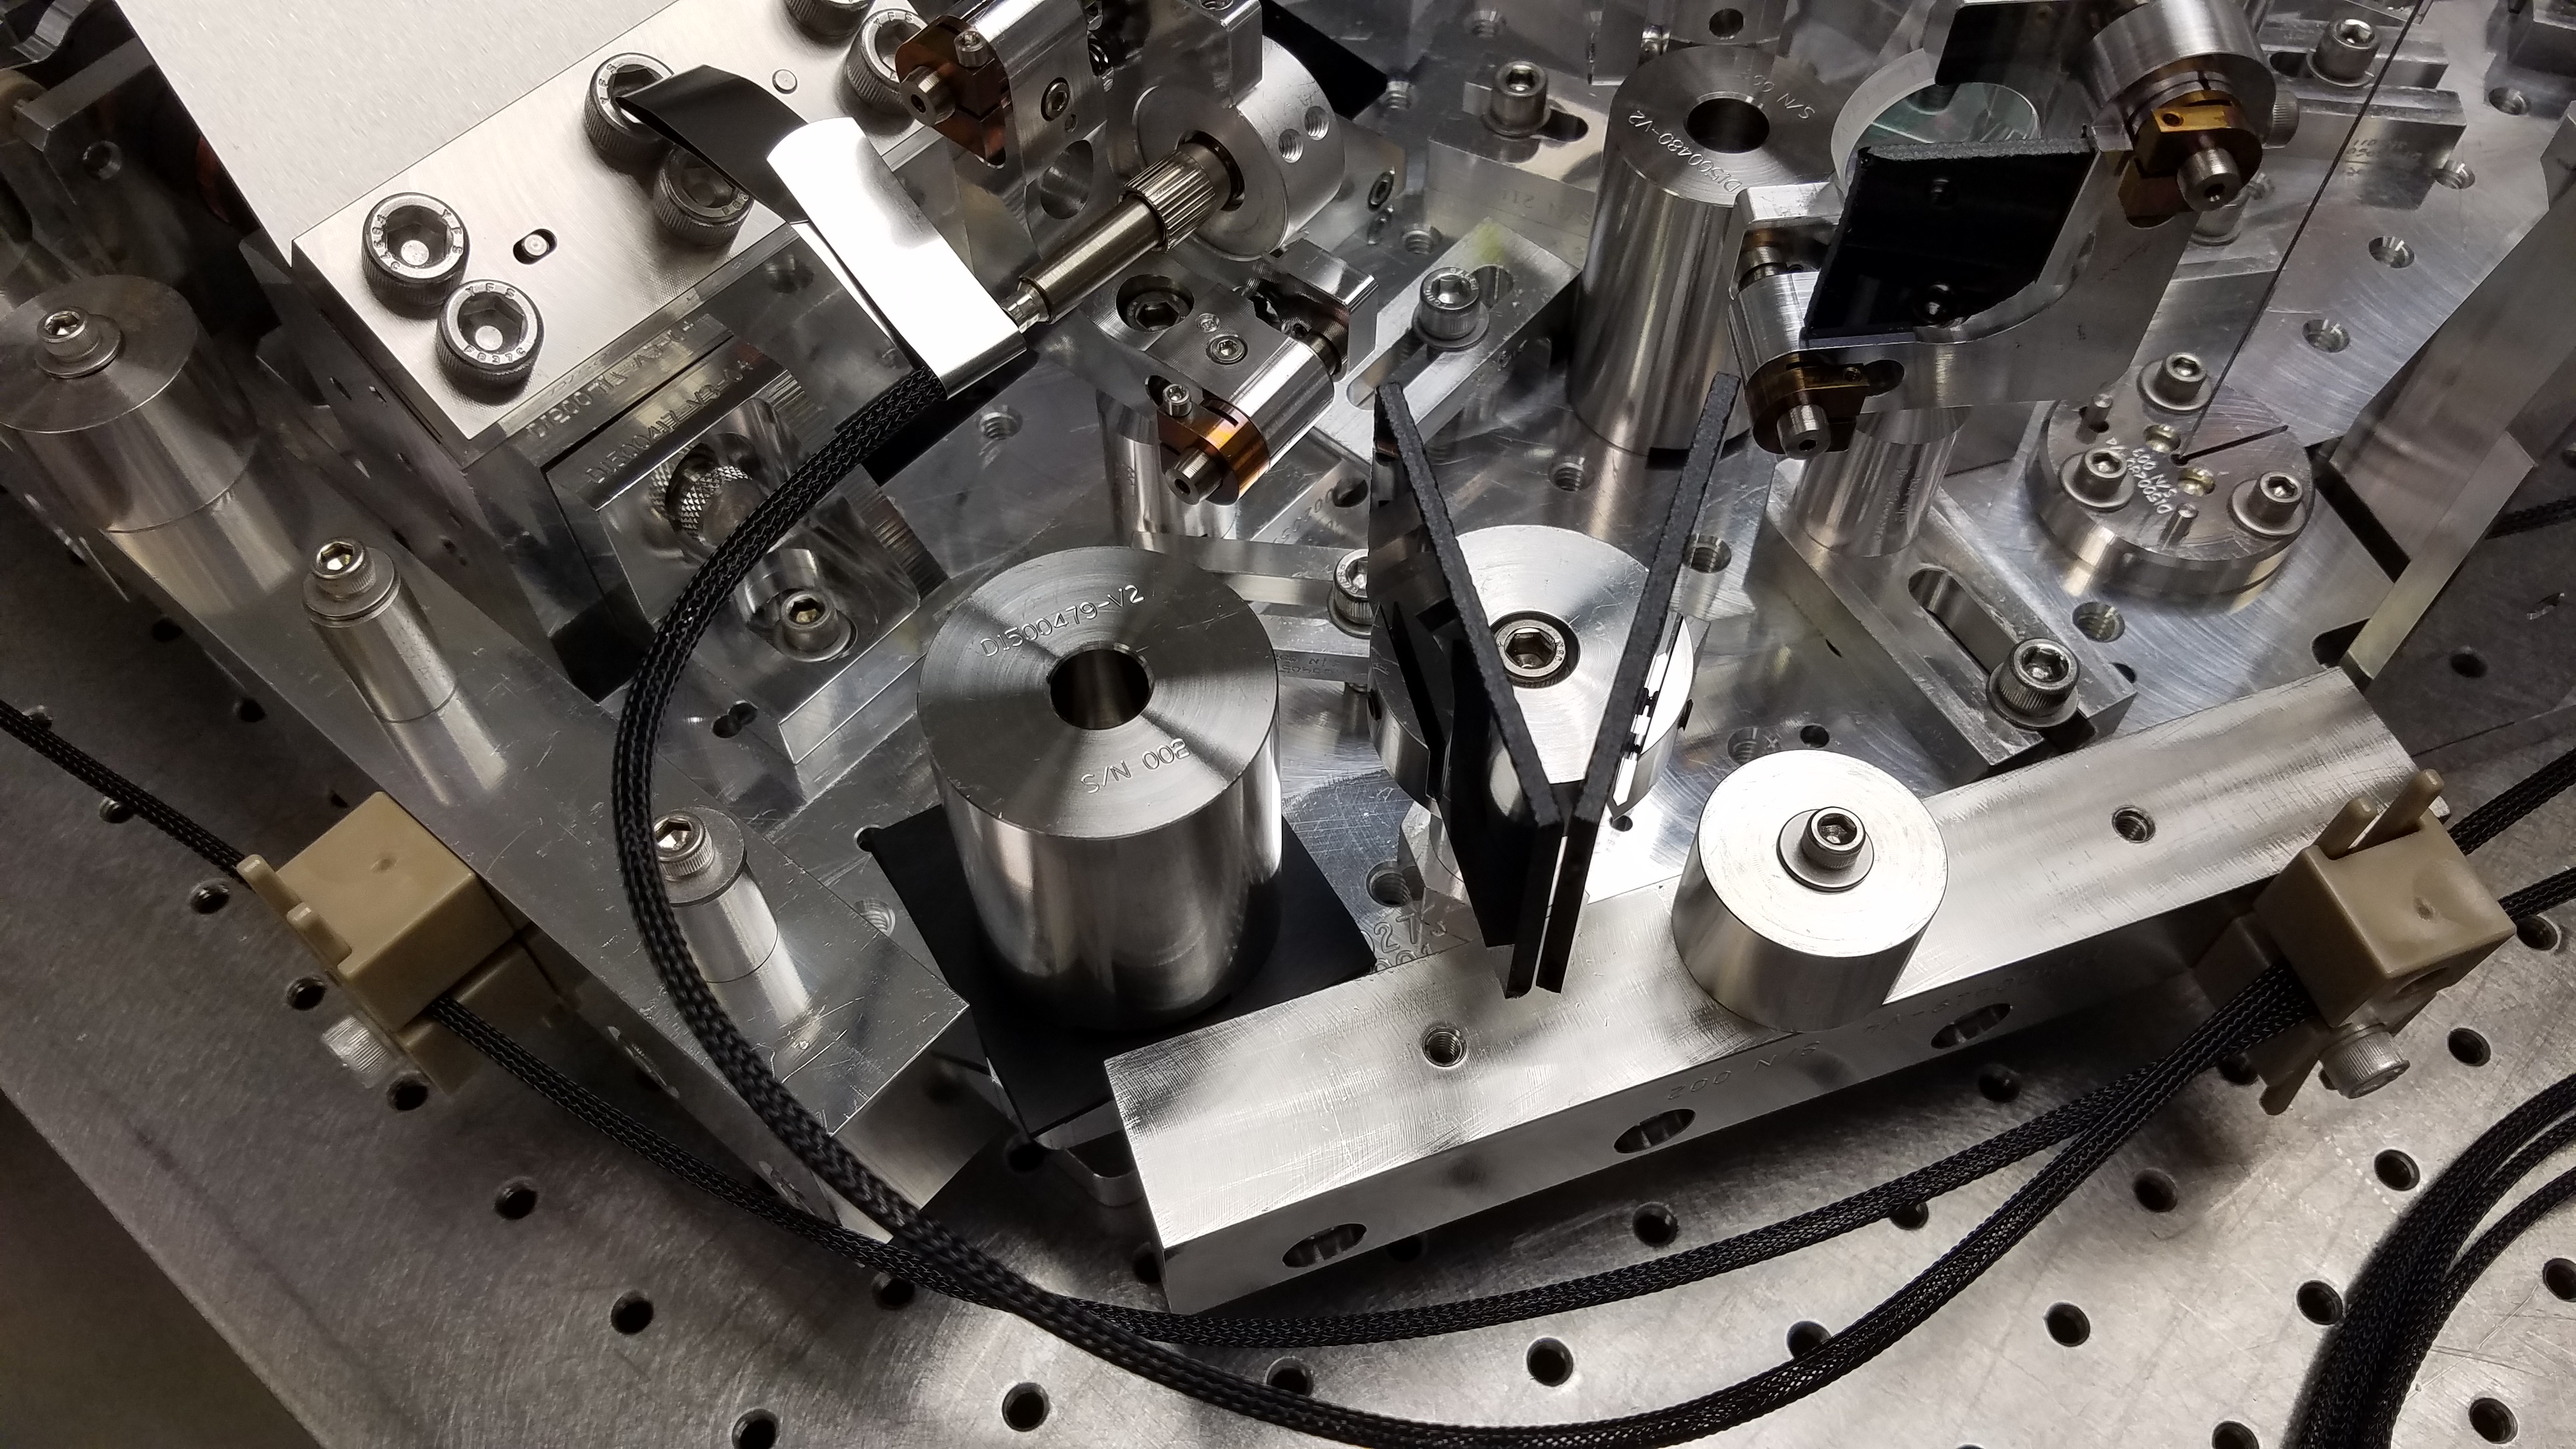
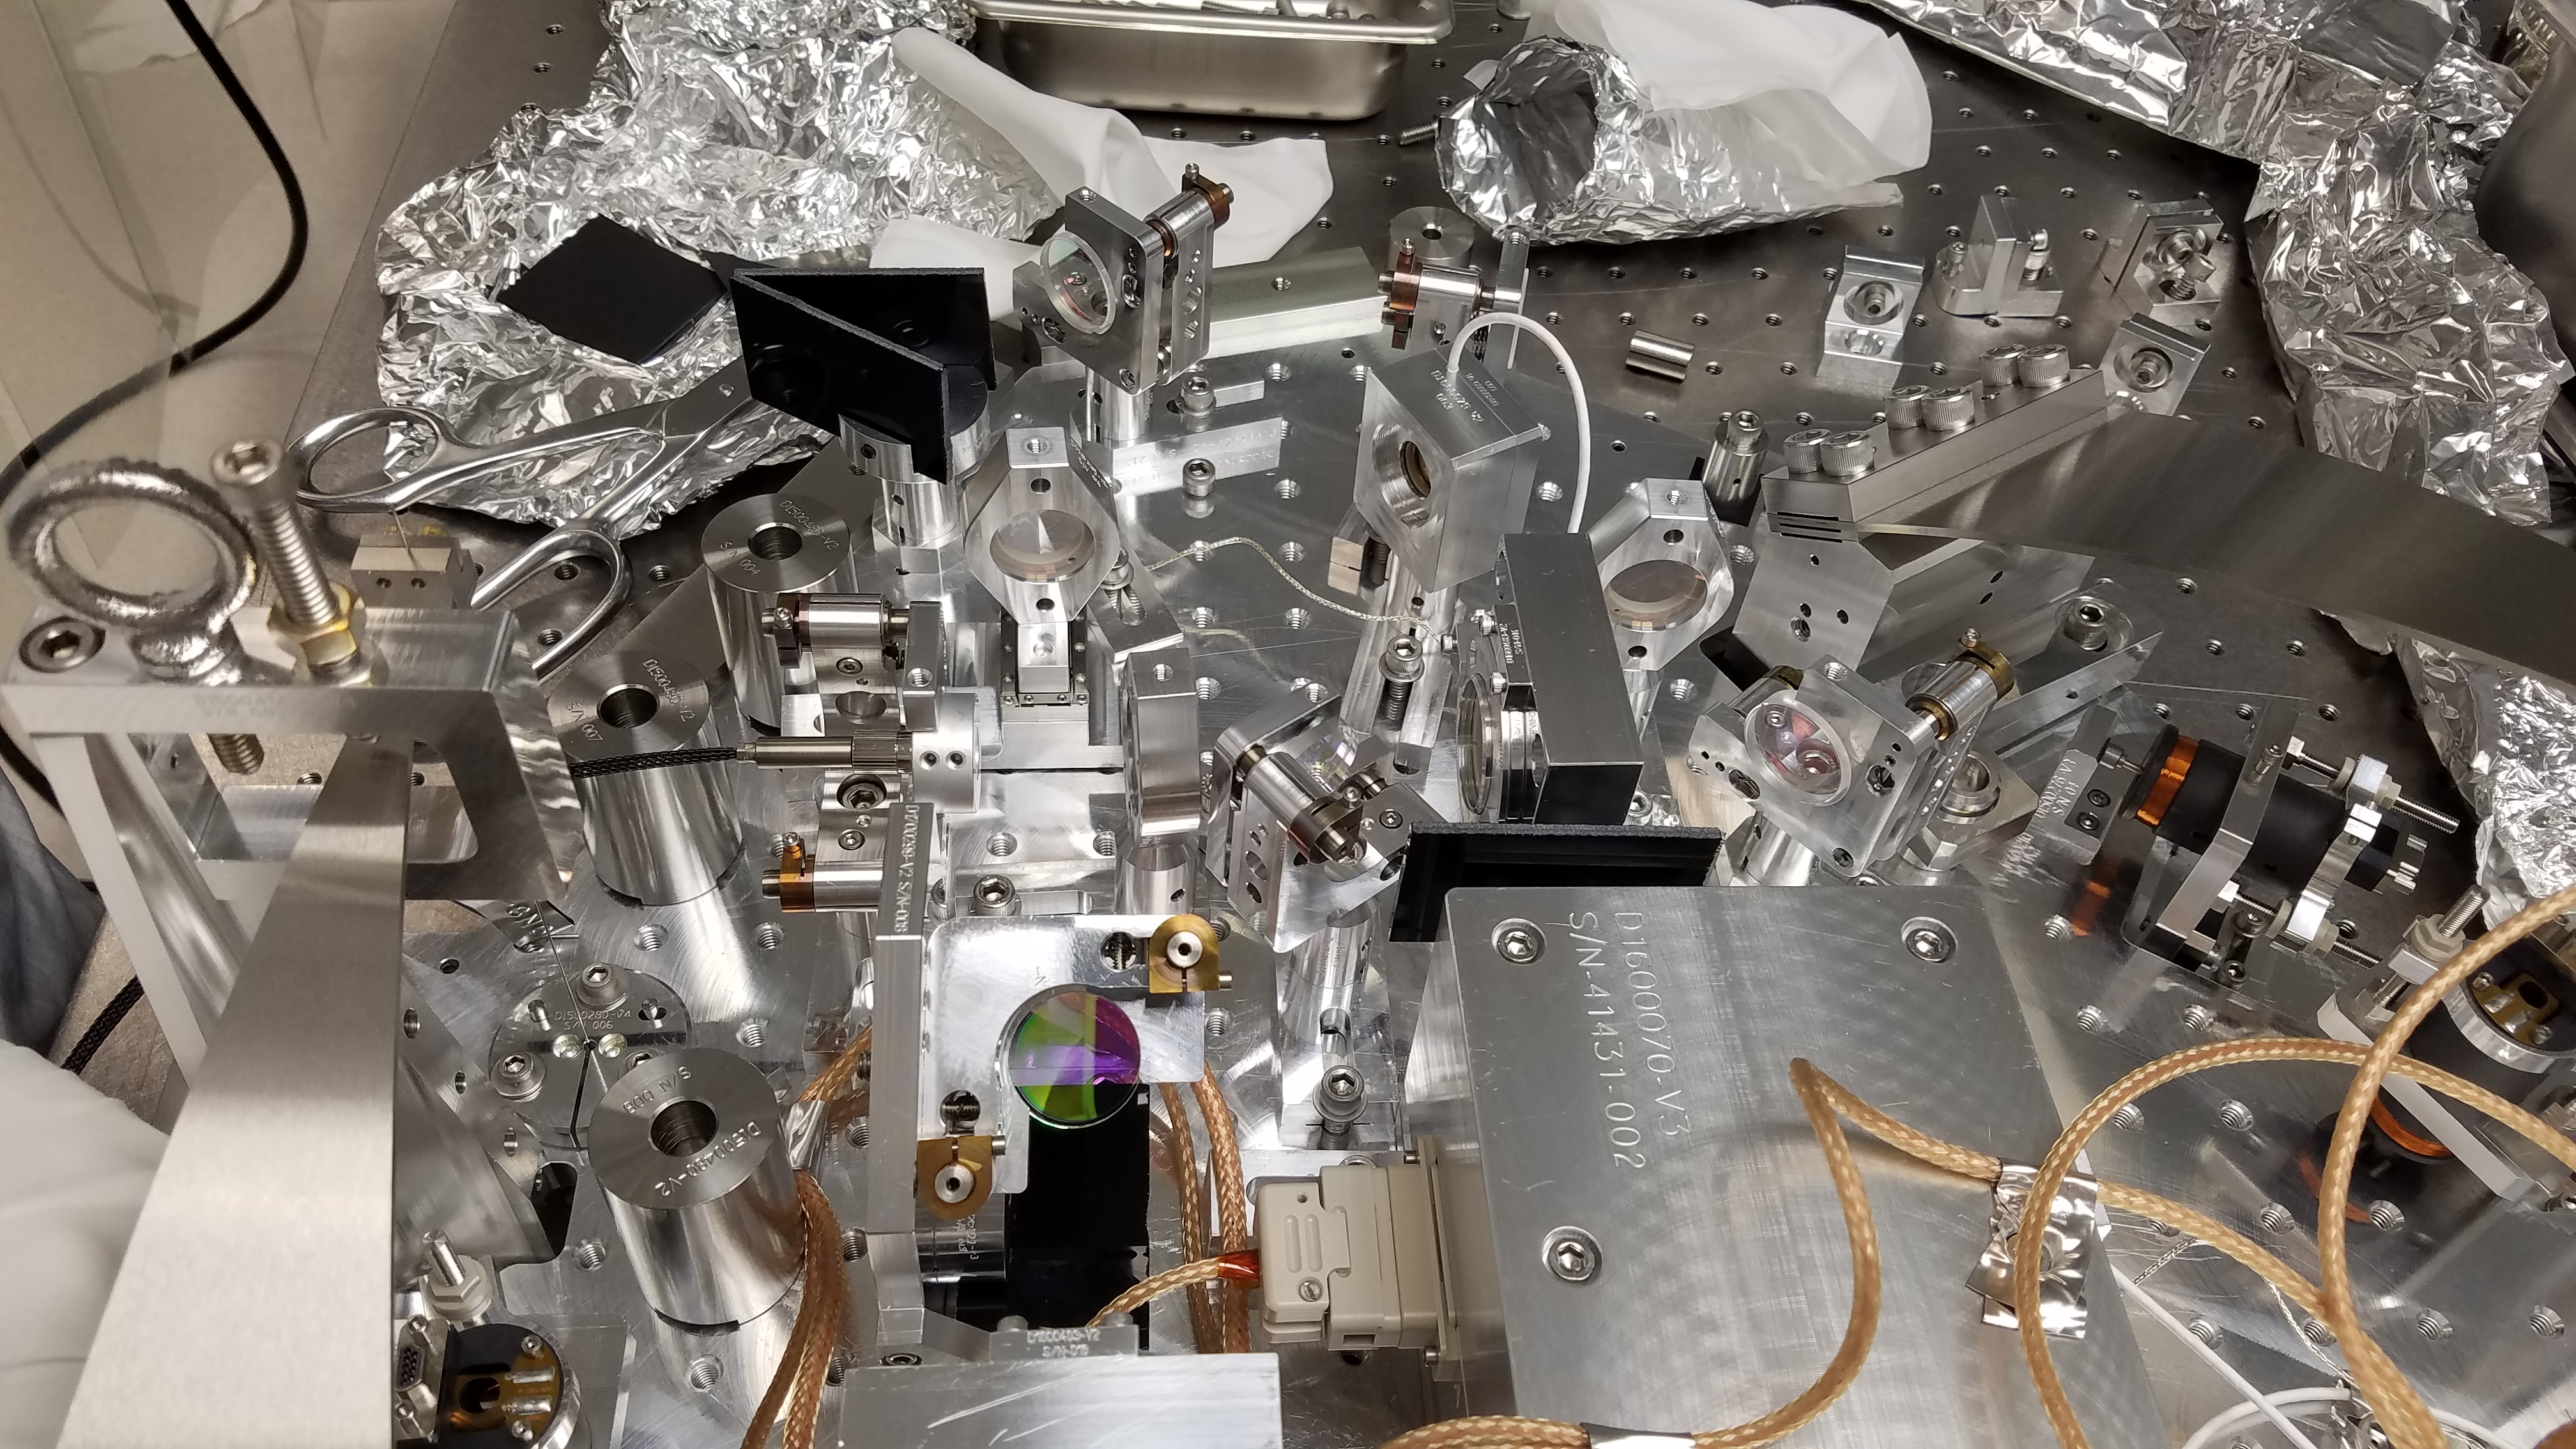
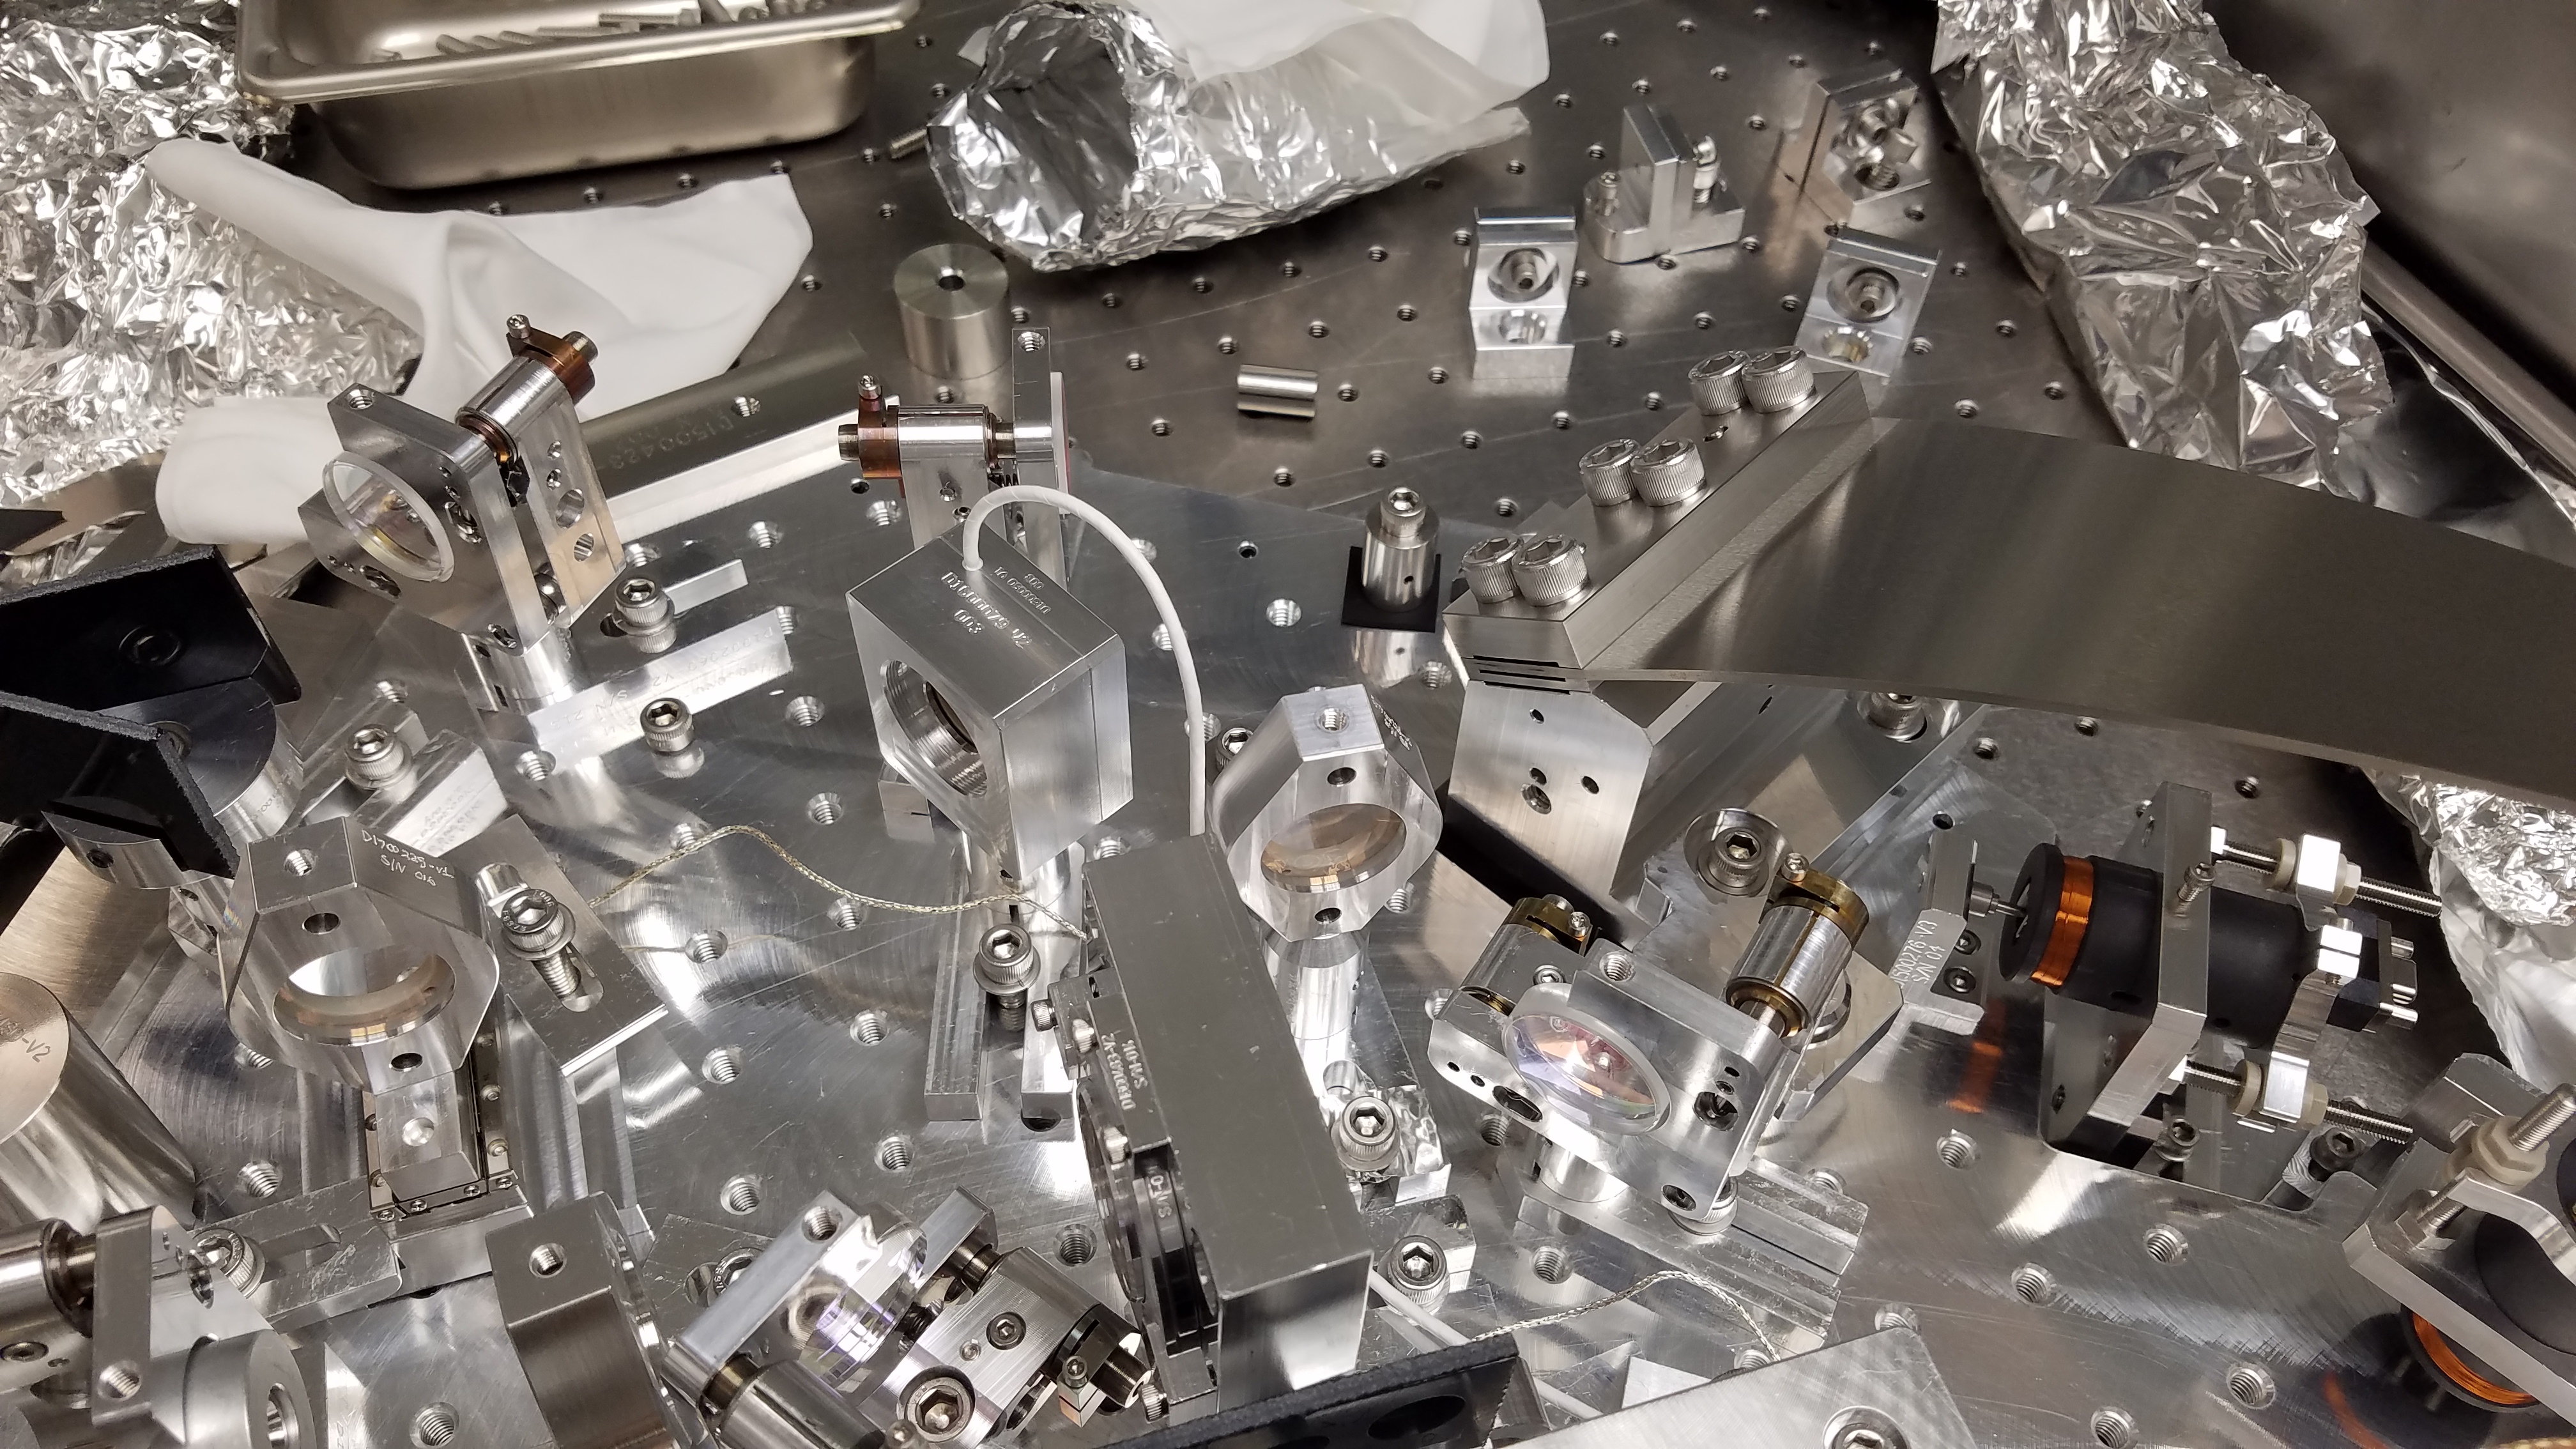
Promised picture of the setup used to measure the FE beam caustic. This is the same setup used for both measurements, with the 300mm lens and with no lens. The optics are, from right to left: 95%R output coupler, pump light filter, OD = 4.0 ND filter. The Thorlabs beam profiler was moved along the scale attached to the table to get the distance measurements.