J. Oberling, E. Merilh, P. King, R. Savage
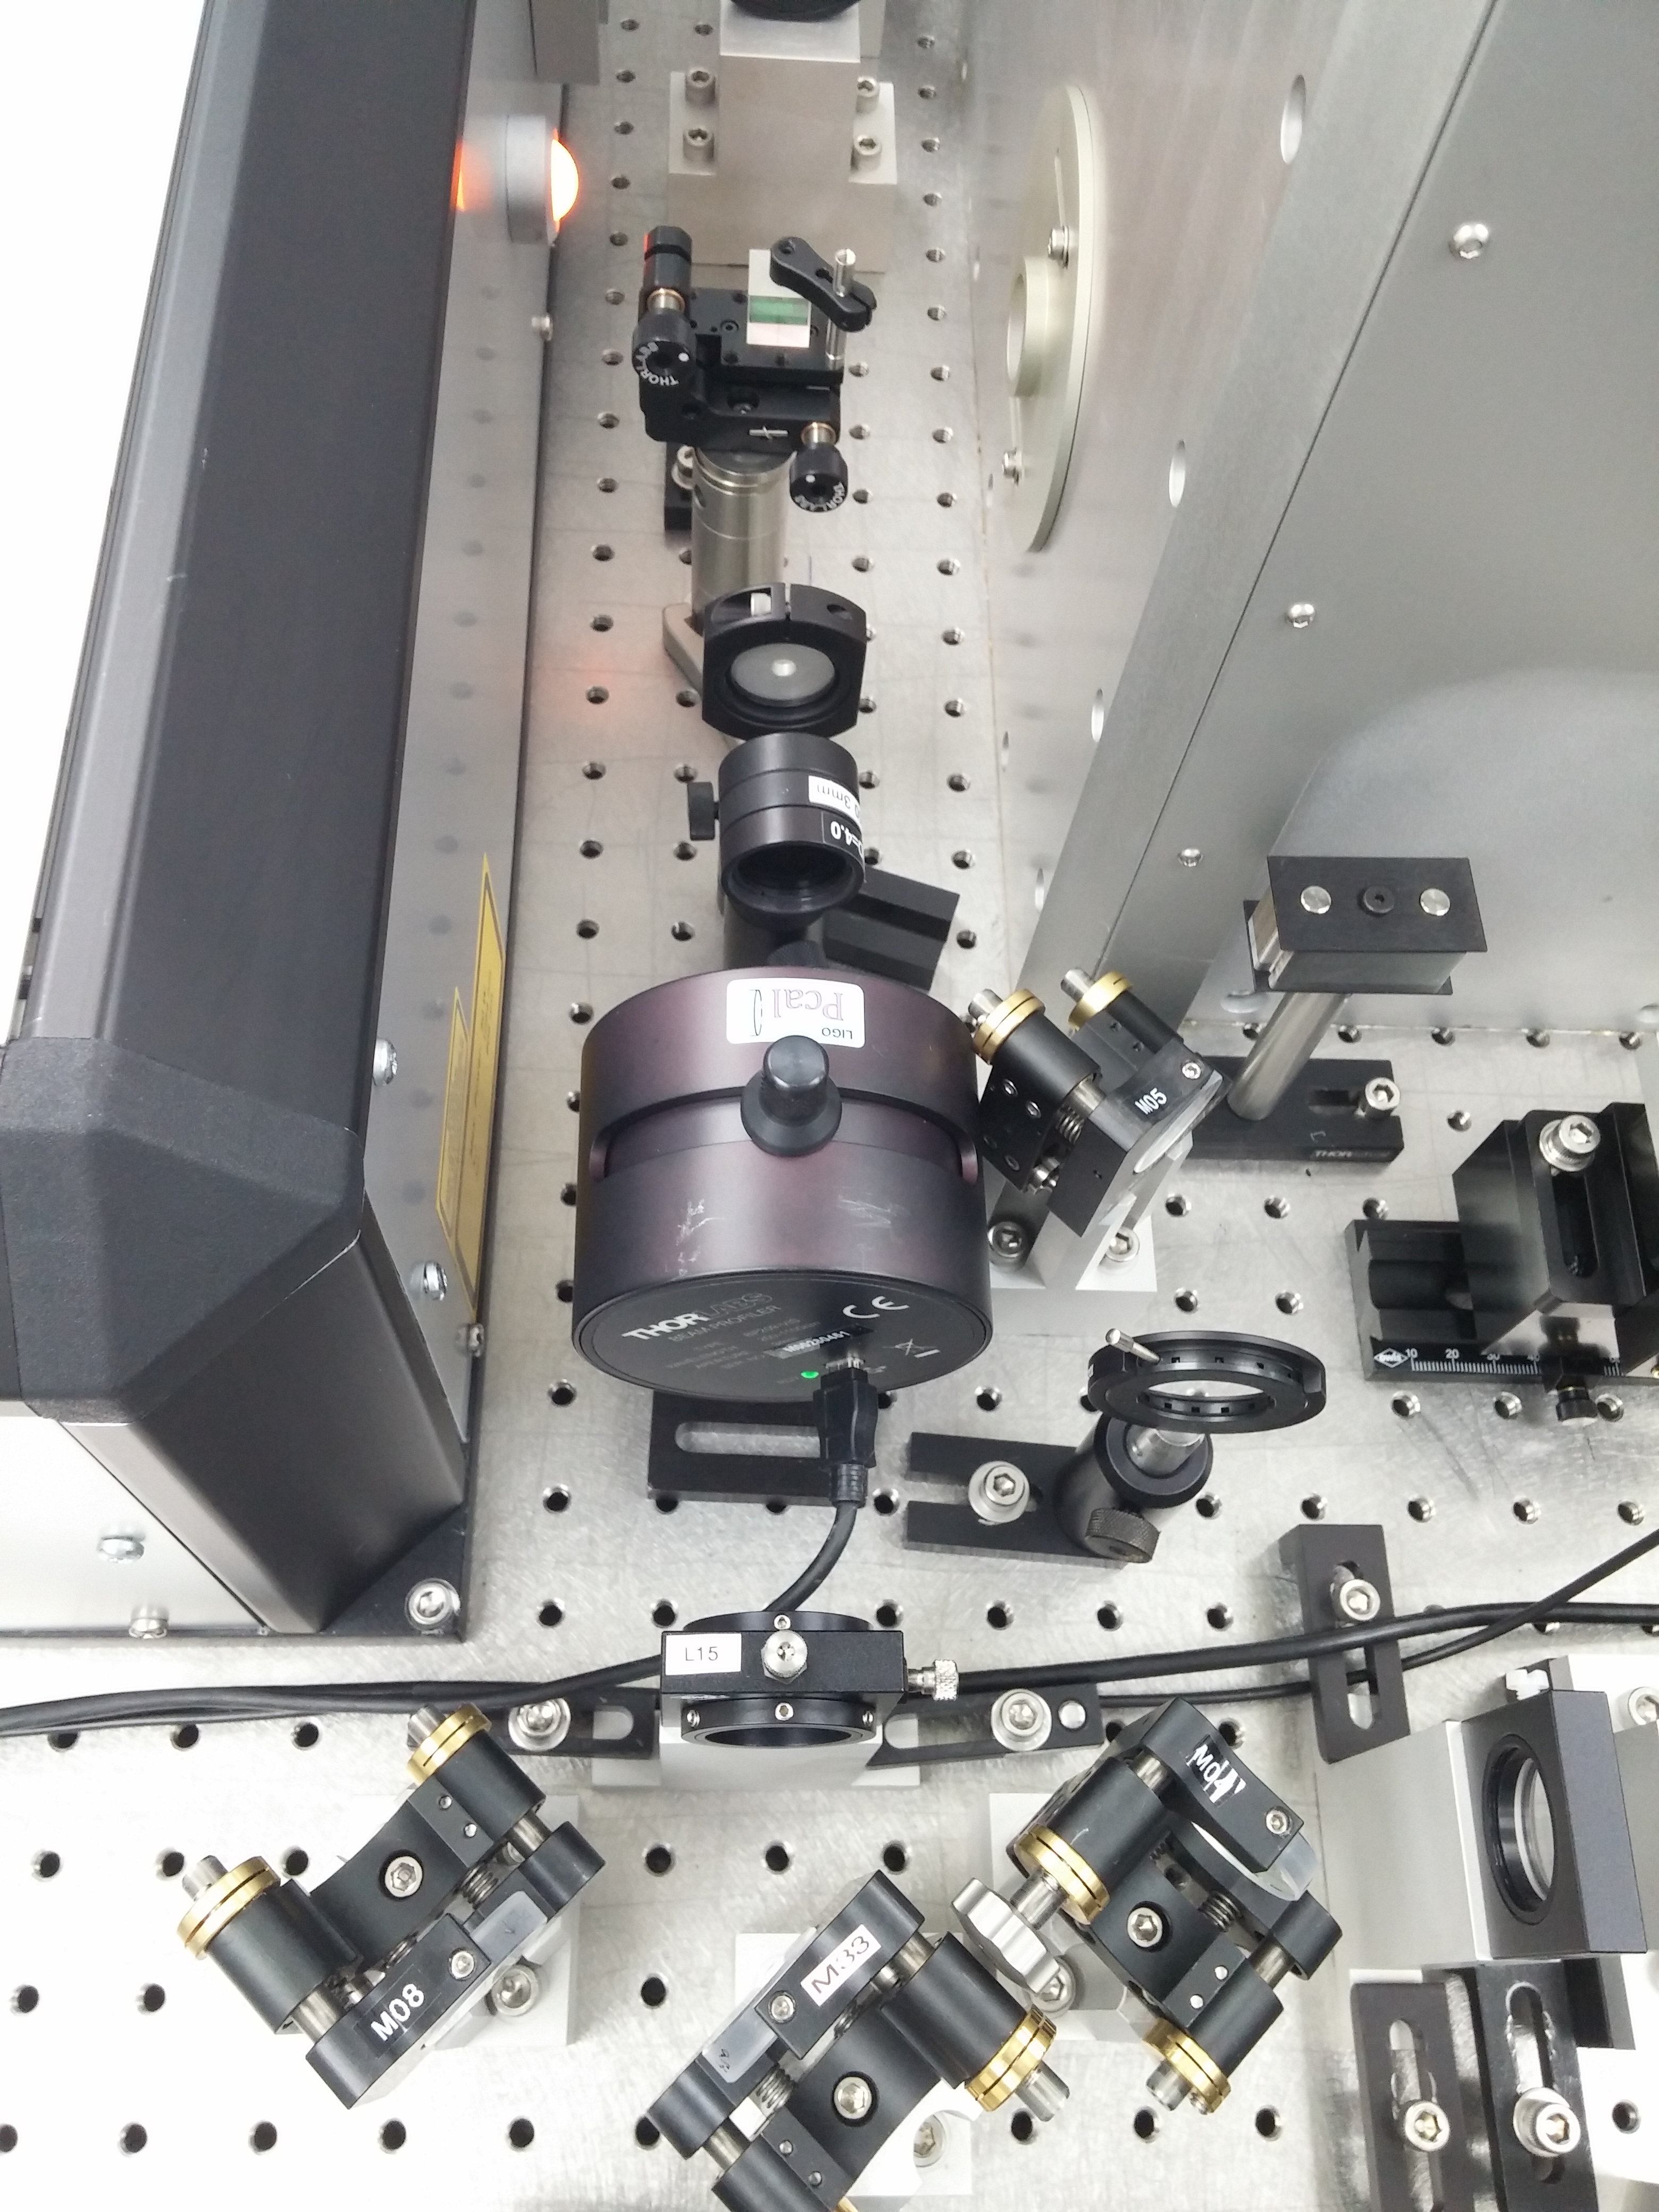
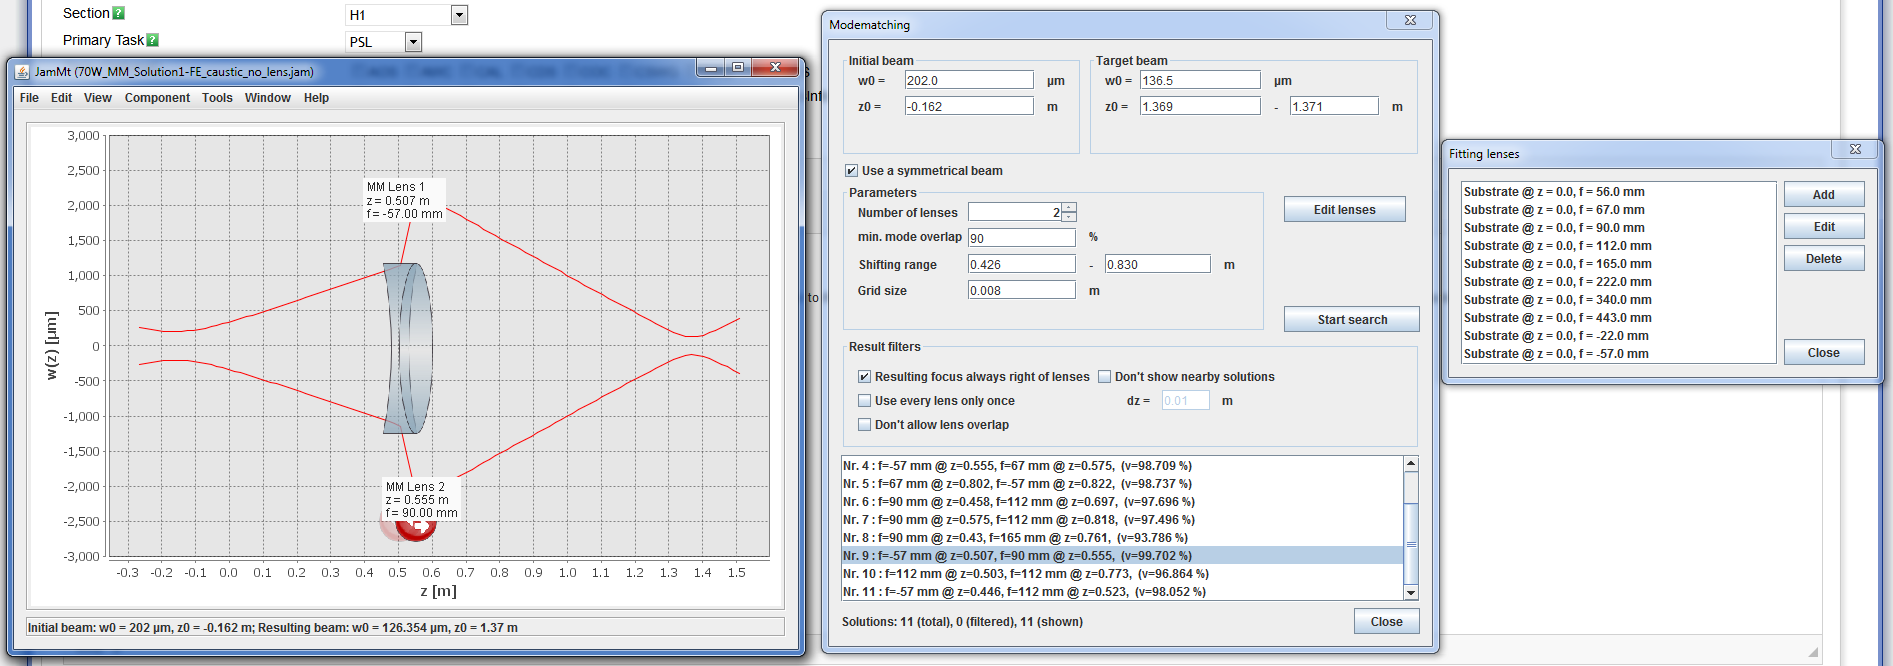
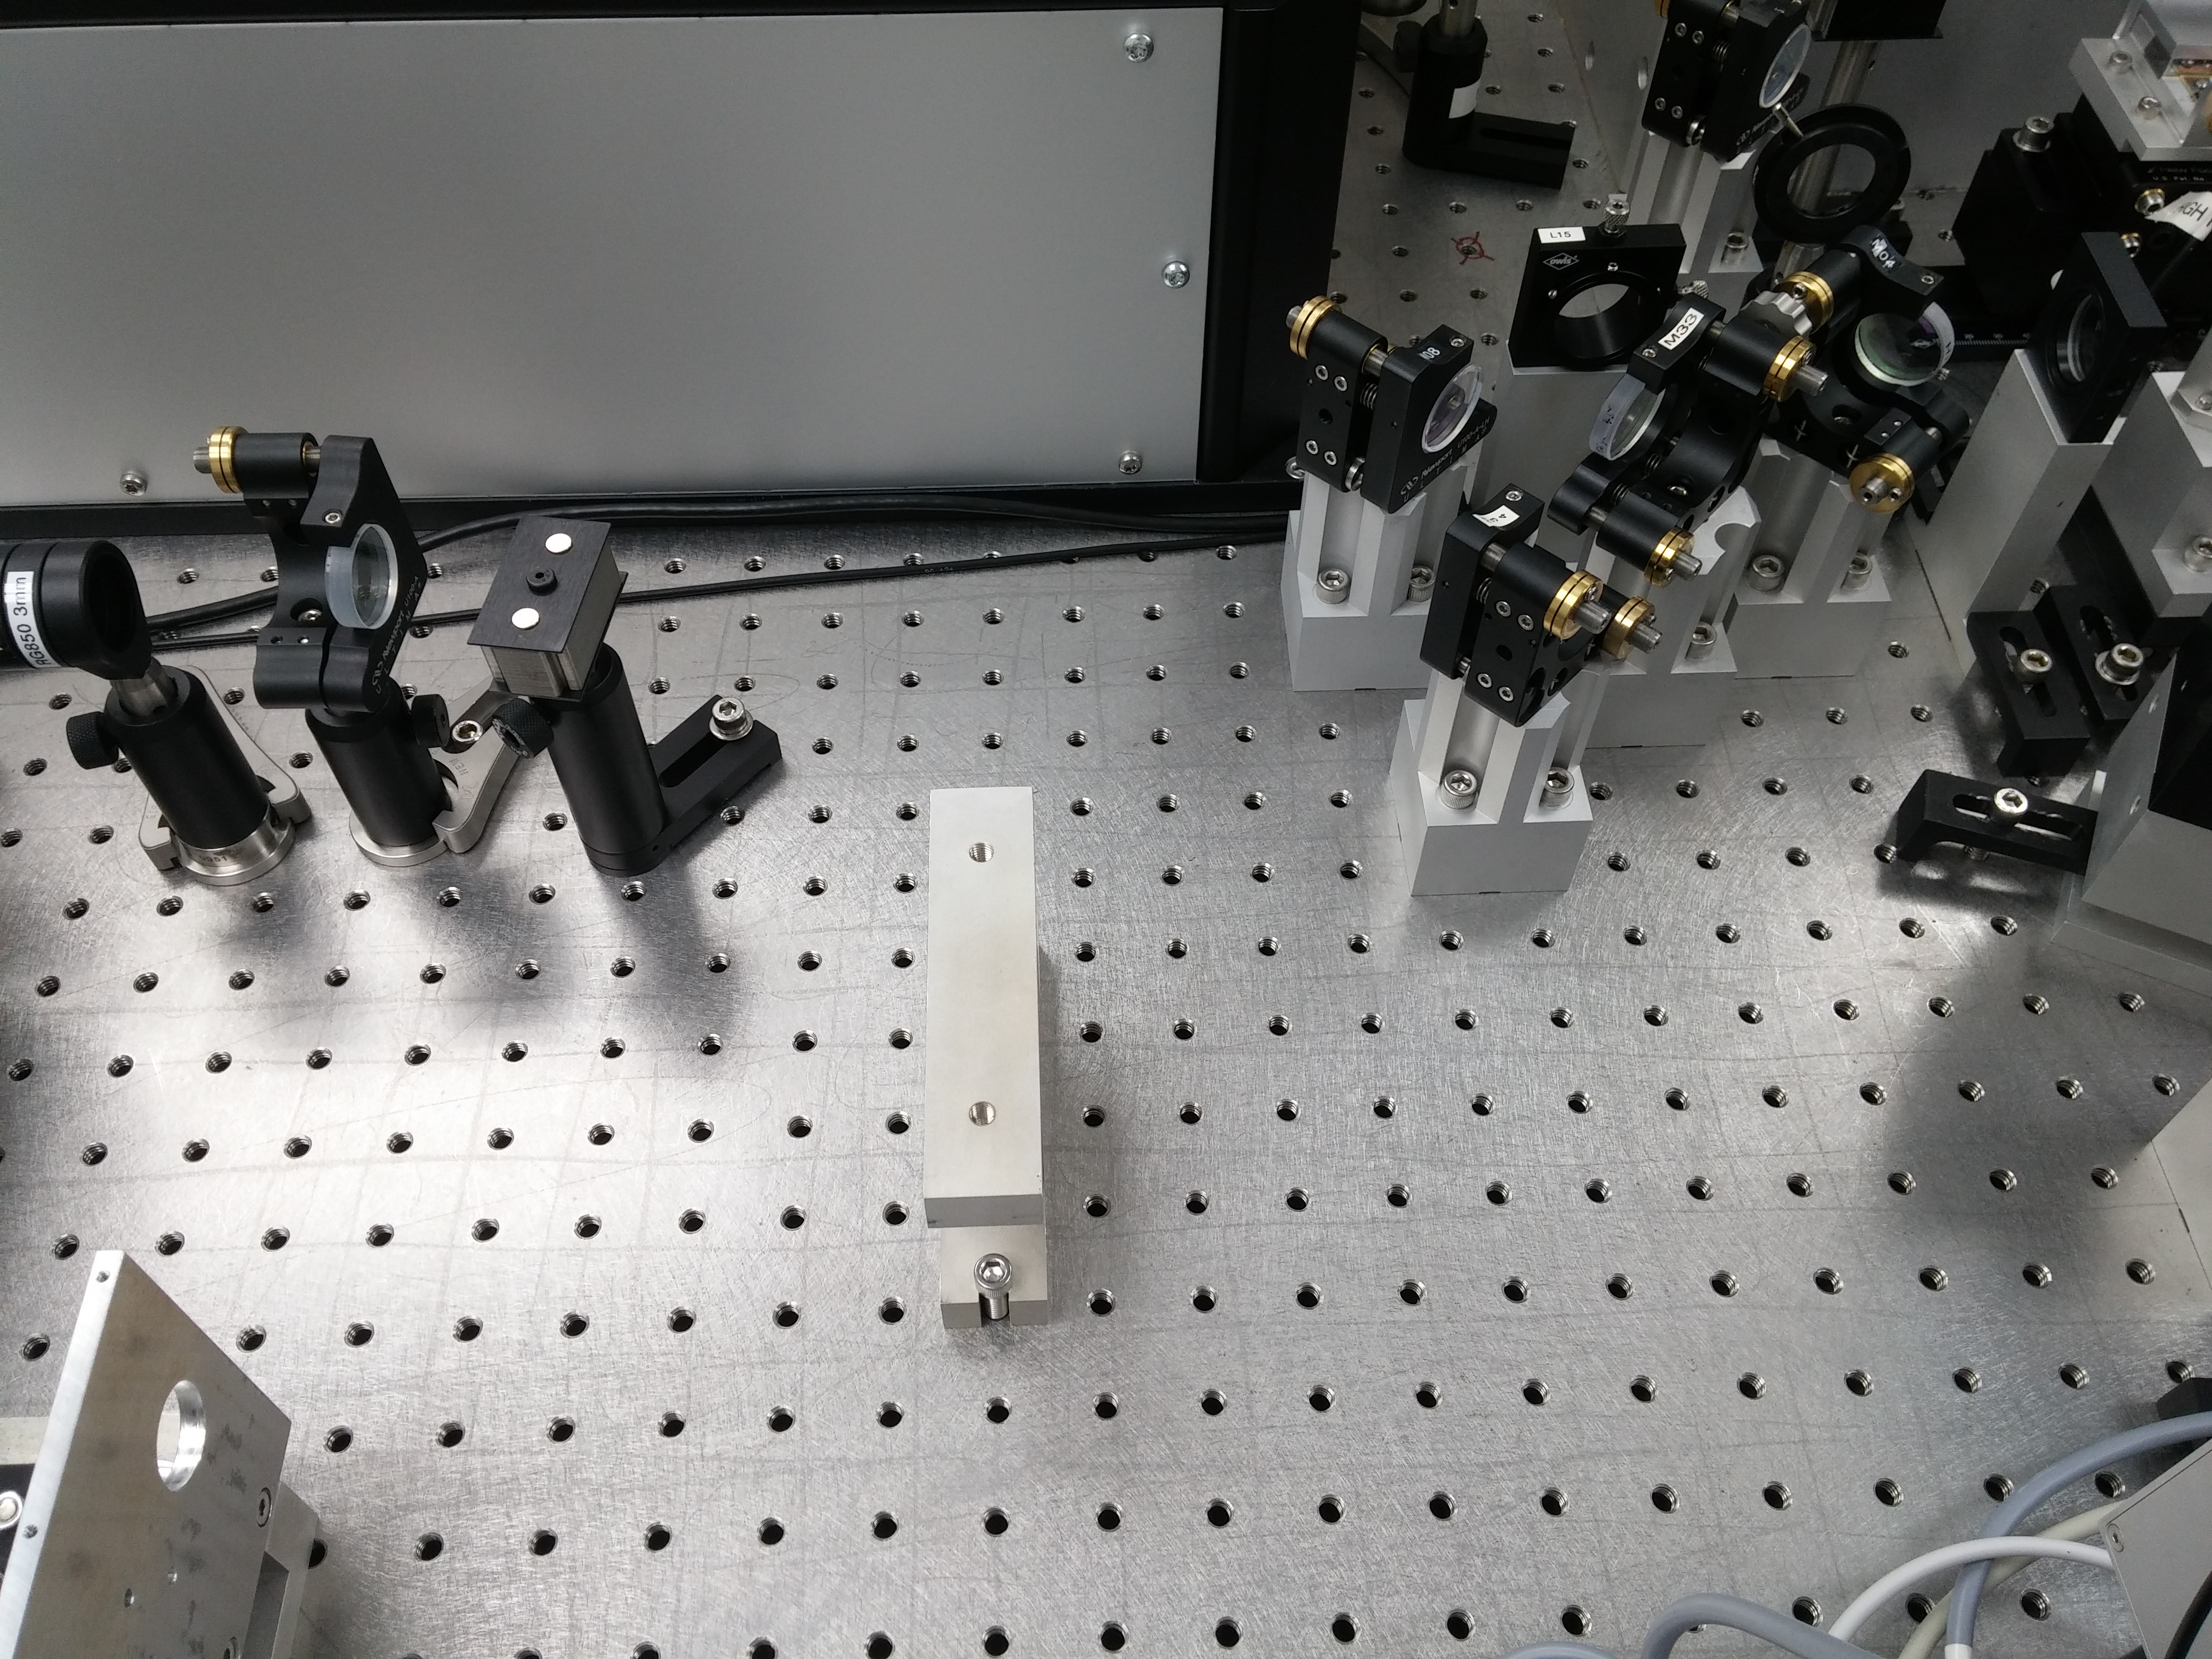
Today we confirmed our initial measurements of the FE beam propagation. Ed and I took a couple of extra data points closer to the FE (attached as LHO_FE_Caustic_no_lens.txt, the setup can be seen in the 1st attached picture; WP02 and PBS02 had to be removed to accommodate the beam profiler) in order to more tightly constrain the divergence angle. This was done because fits done yesterday by myself and Peter were producing different results, and indication of a possible problem with the measurement. I used a Matlab script provided by Rick to fit this data to a Gaussian beam; Peter did the same using a gnuplot script he developed. The 2 separate methods produced the same result: beam waist radius of 202 µm, positioned 162mm inside of the FE box. Using JamMT to model mode matching solutions, one stood out as giving good overlap and also not giving us an intermediate focus between the lenses (which can cause problems). This is attached in the 2nd picture as 70W_MM_Solution1-FE_caustic_no_lens.png; included is the setup for the mode matching model, with the chosen solution #9 highlighted, and the list of lenses used (all LINOS lenses we have readily on hand). The focal lengths given are the lens focal lengths at 1064nm, taken directly from the LINOS product page.
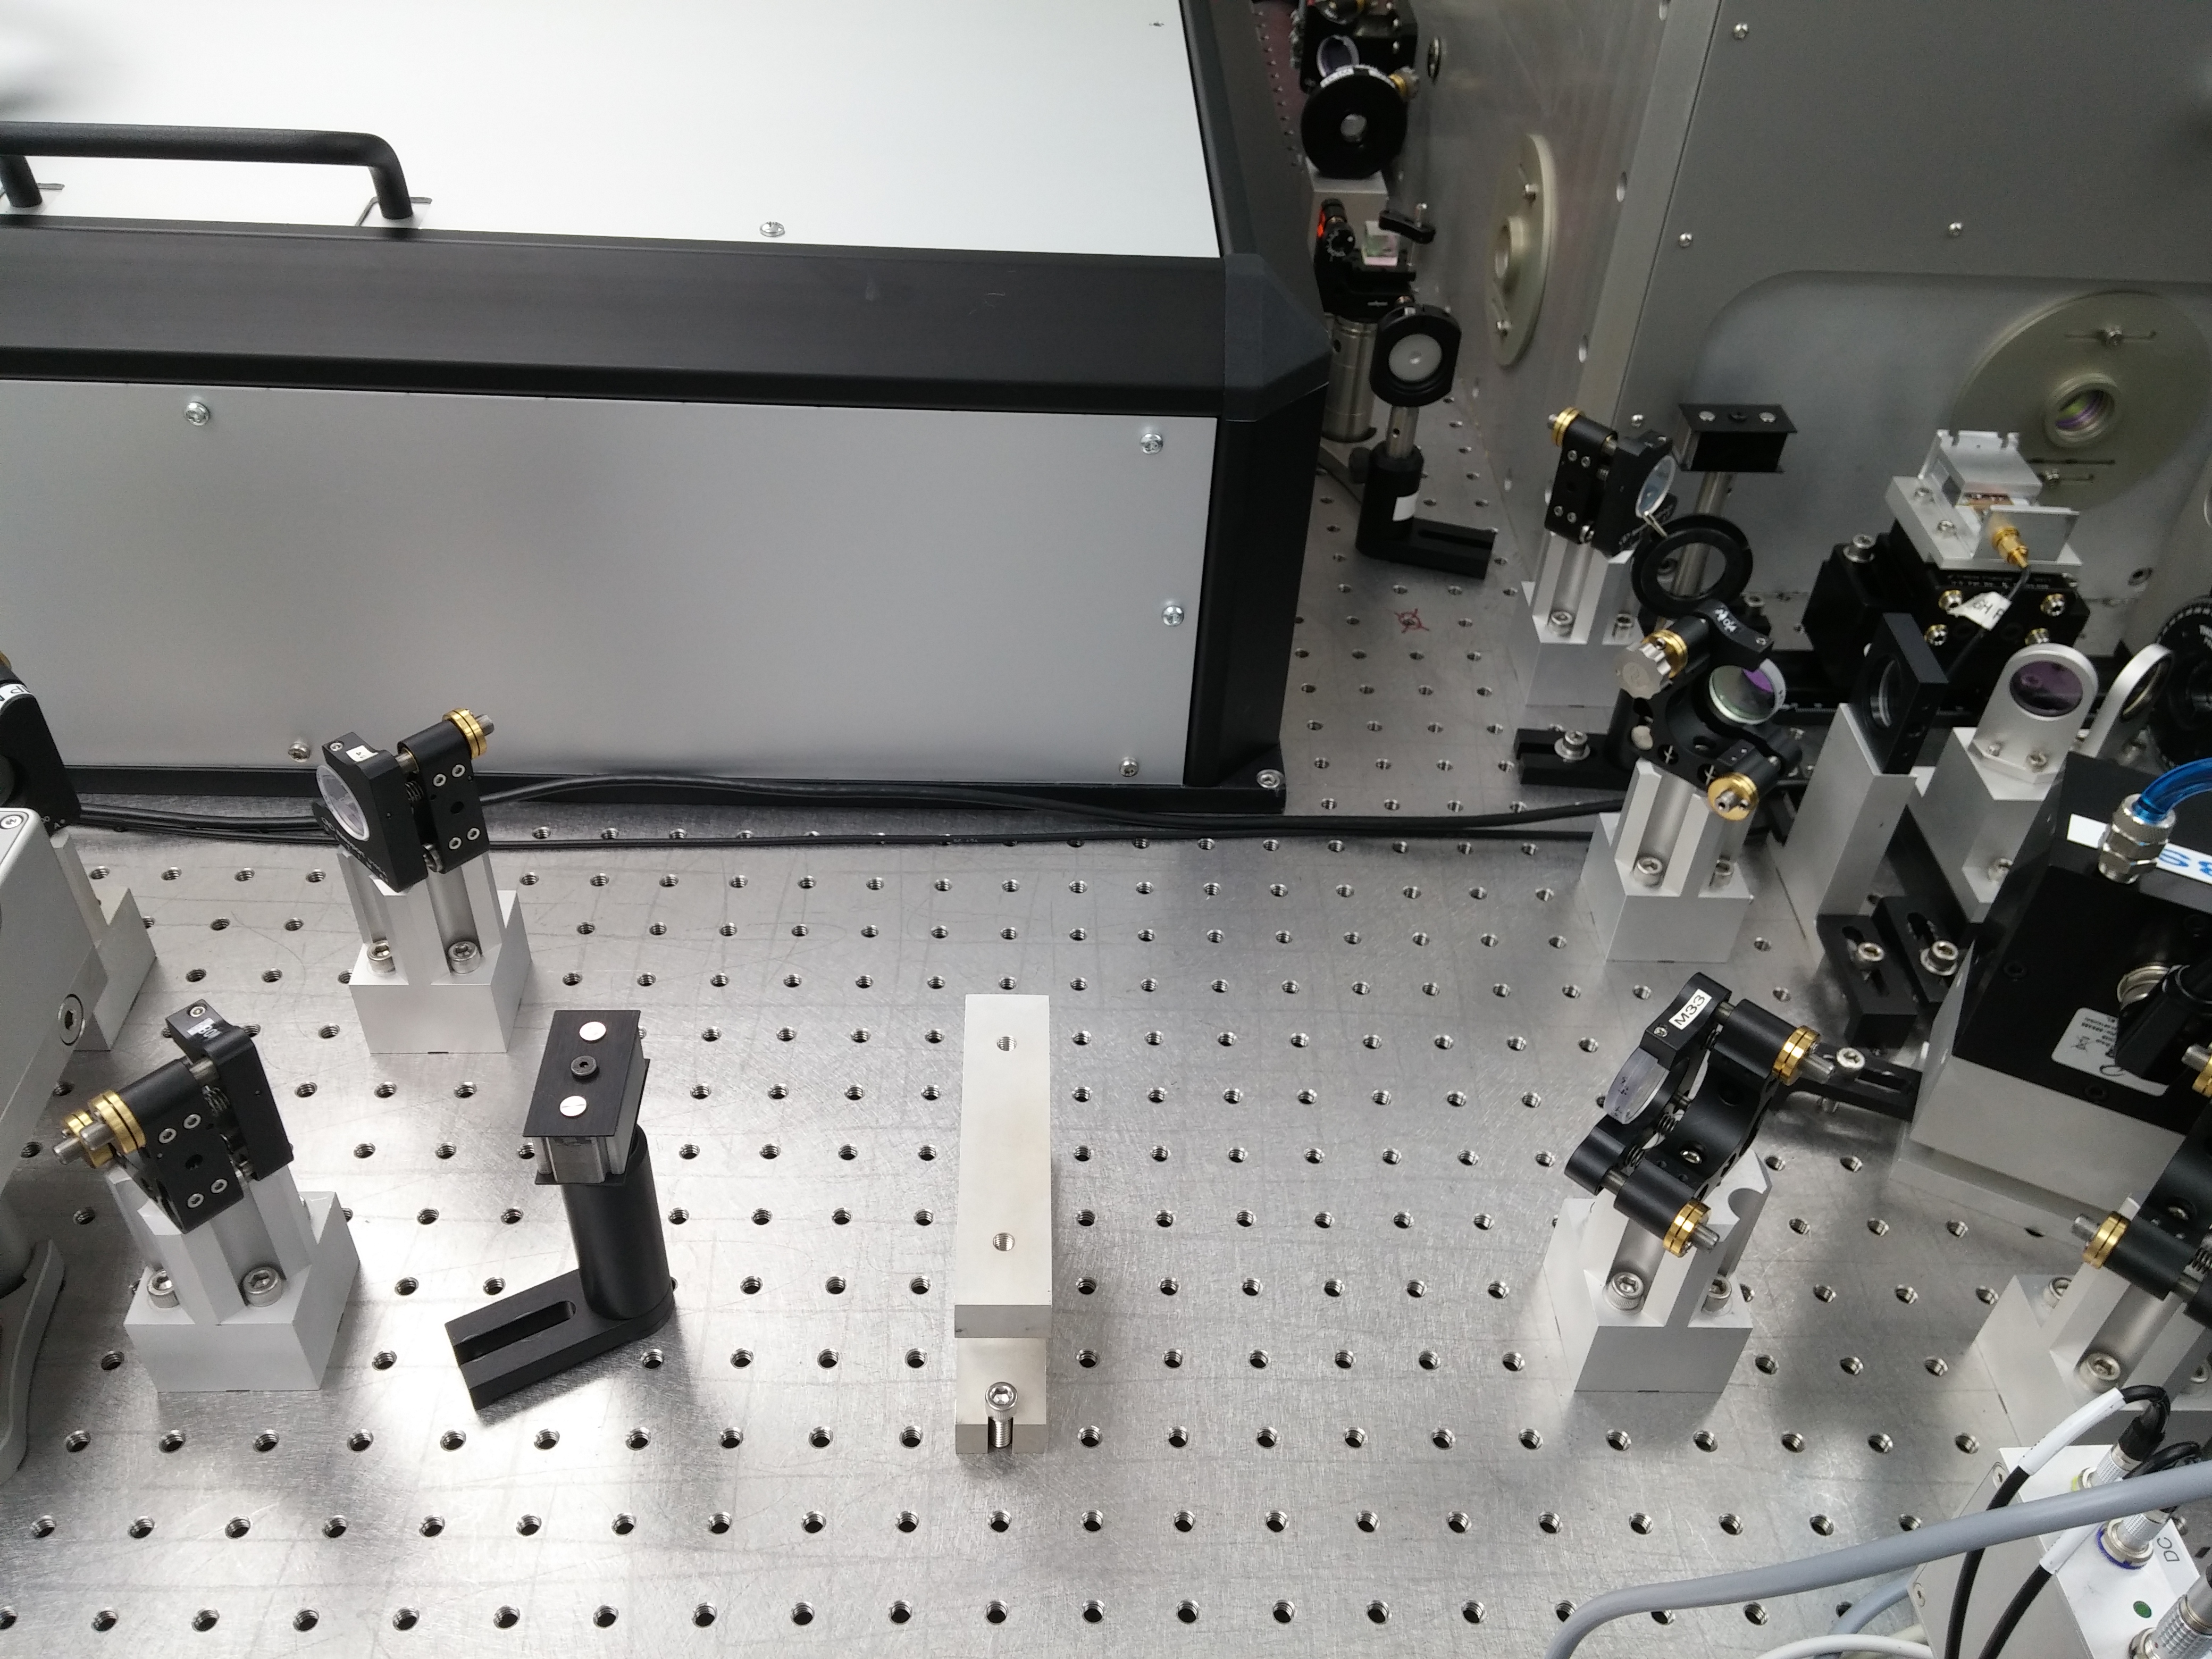
While working all this out, we noticed something in the layout that we didn't like. As currently laid out, any change in the beam alignment to the 70W amplifier also causes a change in alignment through the Faraday isolator (AMP_FI). This can have an effect on the isolation provided by AMP_FI, which can in turn present a danger to the FE should a beam get back-reflected and not be properly isolated by AMP_FI (can cause crystal damage to the FE MOPA, or if we're really unlucky could amplify that back-reflection and damage down-stream components in the FE); there are also personnel safety issues to consider should a slightly off-axis beam make it back through the FE MOPA while someone is working inside the FE box. To fix this, we removed the little zig-zag made by mirrors M33, M08, and M34. M33 was moved 6 hole patterns further down the table (thereby giving more room for mode matching solutions as well), while mirrors M08 and M34 will serve to direct the beam onto AMP_M01 and then into the 70W amp. AMP_FI will now reside between mirrors M33 and M08, while mirrors M34 and AMP_M01 will be the alignment mirrors for the 70W amplifier; now aligning the beam through the amplifier will not change the beam alignment through AMP_FI (before and after pictures are attached). Ed and I placed the 70W amp in its location on the table (per the layout) and finished the change with mirrors M33, M08, and M34; there is still some alignment work to do with these mirrors.
On Monday we will install and align the mode matching lenses from the attached solution and align the beam through its new path to M34. We will then set up the beam profiler at the waist location given to us by NeoLASE and optimize the mode matching lens alignment to get the proper beam size for the 70W amplifier.
Edit to add: As a precaution, we installed the 80W air cooled beam dump after mirror M33. The FE laser is ON, with watchdogs active.