chandra.romel@LIGO.ORG - posted 22:19, Tuesday 06 March 2018 - last comment - 12:01, Wednesday 07 March 2018(40869)
CP4 regen bake
(late entry from today's work)
Today we valved in heated gas N2 to allow it to flow through the CP4 reservoir. We learned a few things:
- The regen heater has a thermocouple sensor (+ a second spare TC) at the heater elements (TE253B & TE235C), which is used as an over-temperature protection connected to a temperature limit switch inside the Watlow controller. The limit switch works; I was able to trip the heater a few times, mostly when heater is on with no GN2 flow. BTW, it appears TE253B does not work - I haven't looked at the field wiring to see if leads are connected at the heater; we simply switched leads to TE253C inside controller.
- I started GN2 flow when the bake enclosure was reading around 90C at TC#1 (supply air). This is when things got fun. The enclosure heater increased to full-on 100%, but all four temps we monitor were not increasing. Turns out the GN2 was absorbing all the excess heat. The regen pipe was warm at the entrance of the enclosure but the exhaust pipe was hot to the touch. The GN2 supply was not nearly as warm - measuring around 30C at the TC outside the building, just downstream of the heater. I adjusted proportional gain setting in Beckhoff between values of 1 and 6, trying to ramp up the temp. of the GN2 relatively fast to more closely match the enclosure air temp. This process of beginning to warm up GN2 and equalize both systems takes a lot longer than I had time for this afternoon, so I will try again starting early tomorrow morning. For tonight there is no GN2 flow.
- We have a bug in the bake enclosure's PLC controls that needs to be worked out with vendor. Read aLOG for more details: https://alog.ligo-wa.caltech.edu/aLOG/index.php?callRep=40867
I insulated the exposed regen and exhaust pipes and wrapped the exposed purge valve underneath CP4 with Al foil. Also replaced broken TC#2 that measures air a few feet away from supply near top of enclosure (mounted to regen pipe).

Starting again this morning. Flowing small amount of GN2 to start (1/4 turn on valve ~ 20-40 scfhx100). So far no change on heat output from enclosure. Proportional gain set to 3, cycle time 0.1s and zeros for the I. and D. portions of Beckhoff PID parameters. Regen setpoint at 80C. Bake enclosure currently at 82C at TC#1 and heater at 41%.
The PSI procedure calls for 50 gram/s of GN2 flow rate. 1 kg of GN2 = 30.42 cf, so 50 grams/s = 5476 scfh (our flow meter reads in multiple of x100, so the marker should fall roughly around 55 scfhx100.
Increased flow by opening valve another 1/4 turn (open 1/2 turn total) to achieve 55 scfhx100. Regen temp peaks at around 75C and then falls to 55C and goes back up, with current P(ID) settings. No change on enclosure heater - still at 41%.
NOTE: flow bounces around between 30-45 schfx100 because of the vaporizer. When it settles for moments, it reads around 20 scfhx100. I will continue to slowly open ball valve, referred to as the "vaporizer feed valve (V-11) in PSI documentation. Also note that the valve they refer to as "regeneration vent valve" (HV107) does not exist at LHO.
Taking detailed notes for future reference and for LLO's upcoming CP regen.
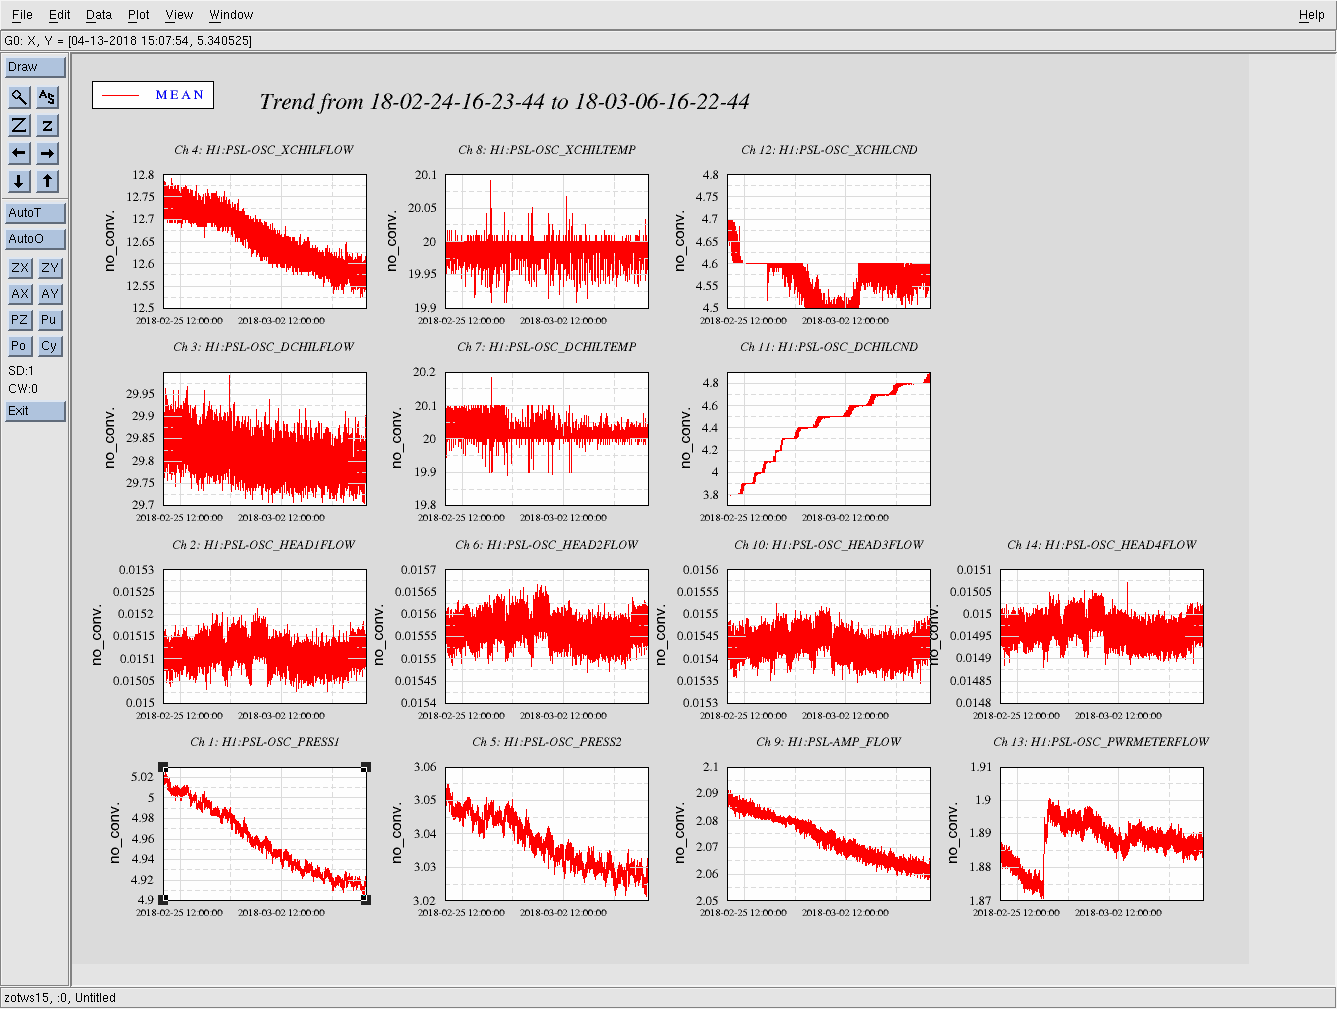
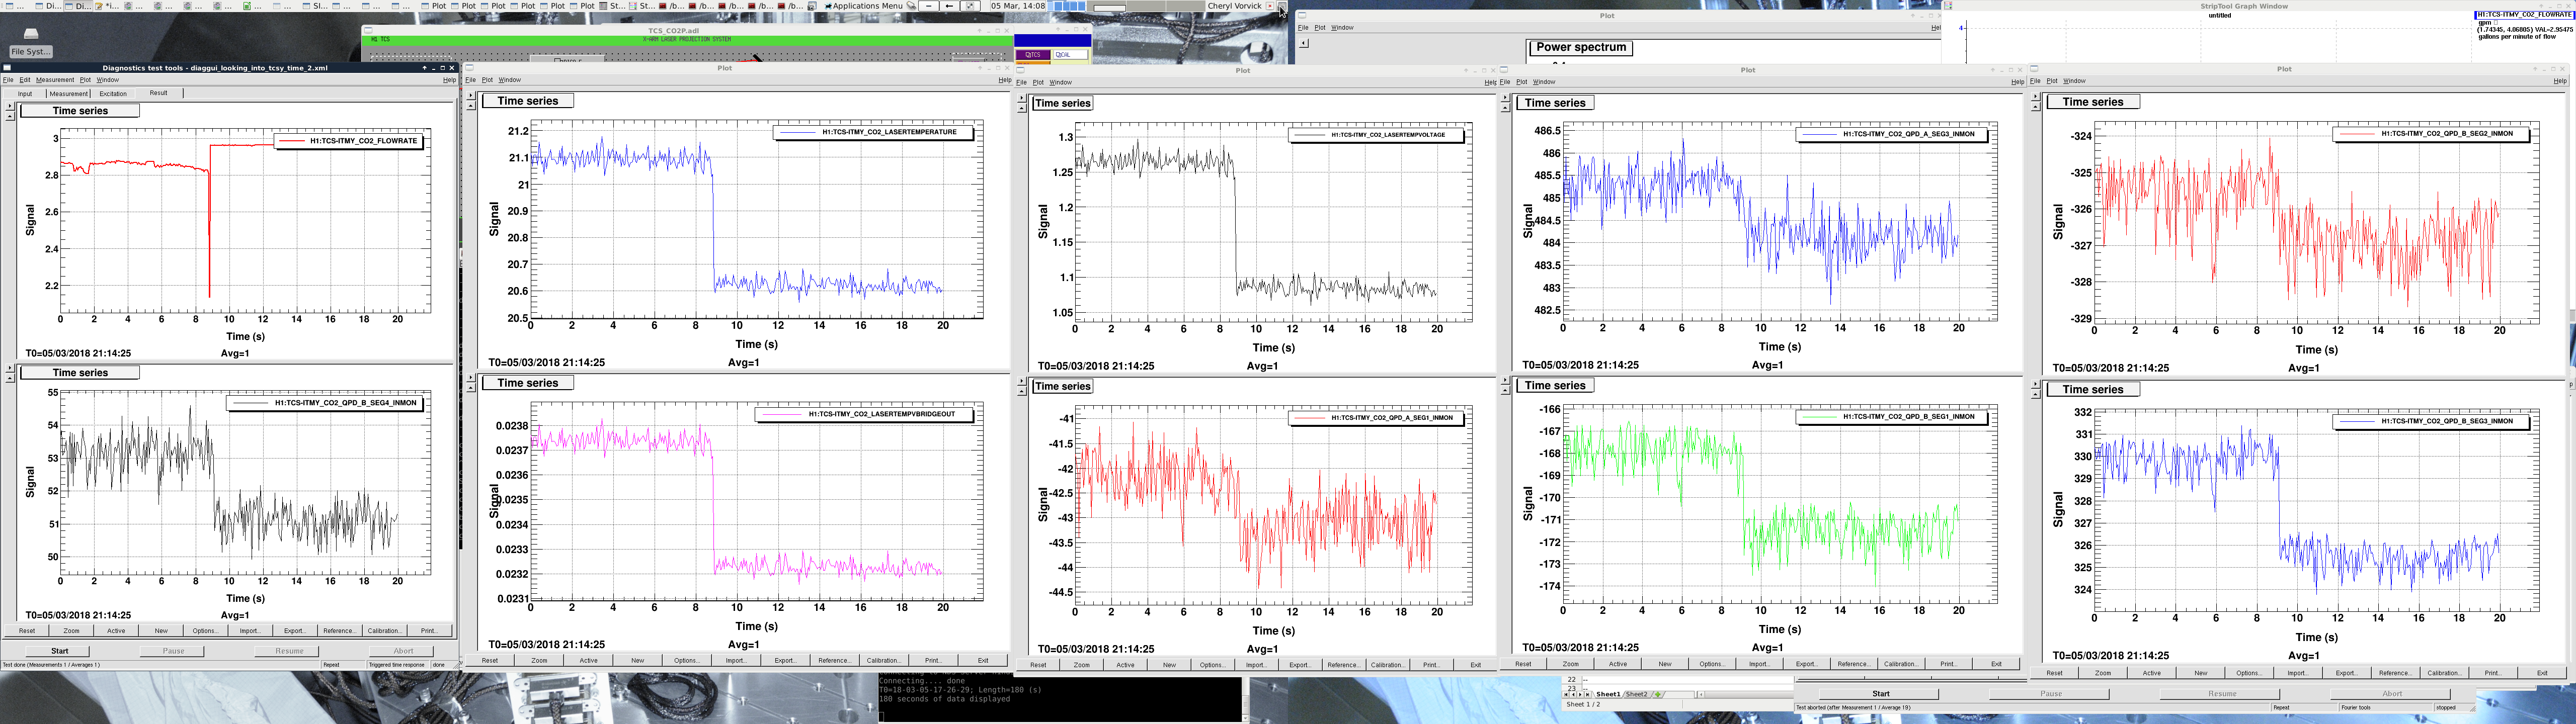
Trend of regen temp (measured just downstream of heater outside in a TC well) and exhaust temp, measured by TC that is routed up the exhaust exit pipe a few feet (modified from original TC well from days of manual/sem-auto overfilling).
Opened up vaporizer feed valve by another 1/4 turn (3/4 turn total). More fluctuations in flow rate. Will continue to monitor as it settles. No change in enclosure heater (41%).
Increased GN2 flow again (now valve is opened one full turn) with fluctuations around 40 scfhx100 or less. Also increased proportional gain setting to 5 to get regen temp closer to setpoint (80C). It was cycling around 60C with a setting of 3.
Opened up vaporizer feed valve another 1/4 turn (1-1/4 turns so far), inching towards 55 scfhx100 flow (around 40 now). Also raised the prop. gain setting to 7 to get regen temp closer to set point of 80C.
Enclosure heater now at 42% output and supply temp reads 85C. We will need to raise the setpoint today. I contacted the vendor about the bug in code (?) when we raise set point. We're finding we need a hard reboot of the system so the heater doesn't overshoot and push to 100% output.
Opend vaporizer feed valve another 1/2 turn for a total of two full turns open. Flow is hovering around 40 scfhx100. Increased regen GN2 setpoint to 95C with prop. gain setting at 7. Enclosure heater output is 43%.