J. Oberling, E. Merilh
The last couple of days have been somewhat frustrating. After installing the new FE pick-off last Friday, Ed and I attempted to re-acquire the PMC alignment, and failed. While we were successfully re-aligning the beam to the PMC, we were also misaligning the beam path towards the future home of the 70W amplifier; the beam was being driven too low and was beginning to clip on PBS02. We removed the FE pick-off and re-established our PMC alignment, and took the opportunity to install 2 irises; one between mirrors M04 and M05 and one between mirrors M06 and M07 (we would have preferred to have this iris between mirror M07 and the PMC, but there wasn't room to install the iris without blocking the reflected PMC beam). This was completed by COB Monday. This done, we re-installed the pick-off on Tuesday morning and, using primarily mirror M02 (but some adjustment of M01 was necessary), were able to recover the PMC alignment while mostly maintaining our beam path towards the 70W amp. We then tweaked the pick-off alignment, which resulted in a necessary small re-tweak of the PMC alignment. We took visibility measurements both before and after the pick-off installation:
- Before pick-off installation
- PMC locked: -0.043 V
- PMC unlocked: -0.603 V
- Visibility: 92.9%
- After pick-off installation
- PMC locked: -0.034 V
- PMC unlocked: -0.600 V
- Visibility: 94.3%
One thing we noted was a loss of power incident on the PMC. Before the pick-off installation we had ~25W incident on the PMC; after the installation and alignment we only had ~23W incident on the PMC. We could find no obvious place where we are losing 2W of power; no obvious clipping or misalignments. Perhaps some clipping in the new pick-off? More on that below.
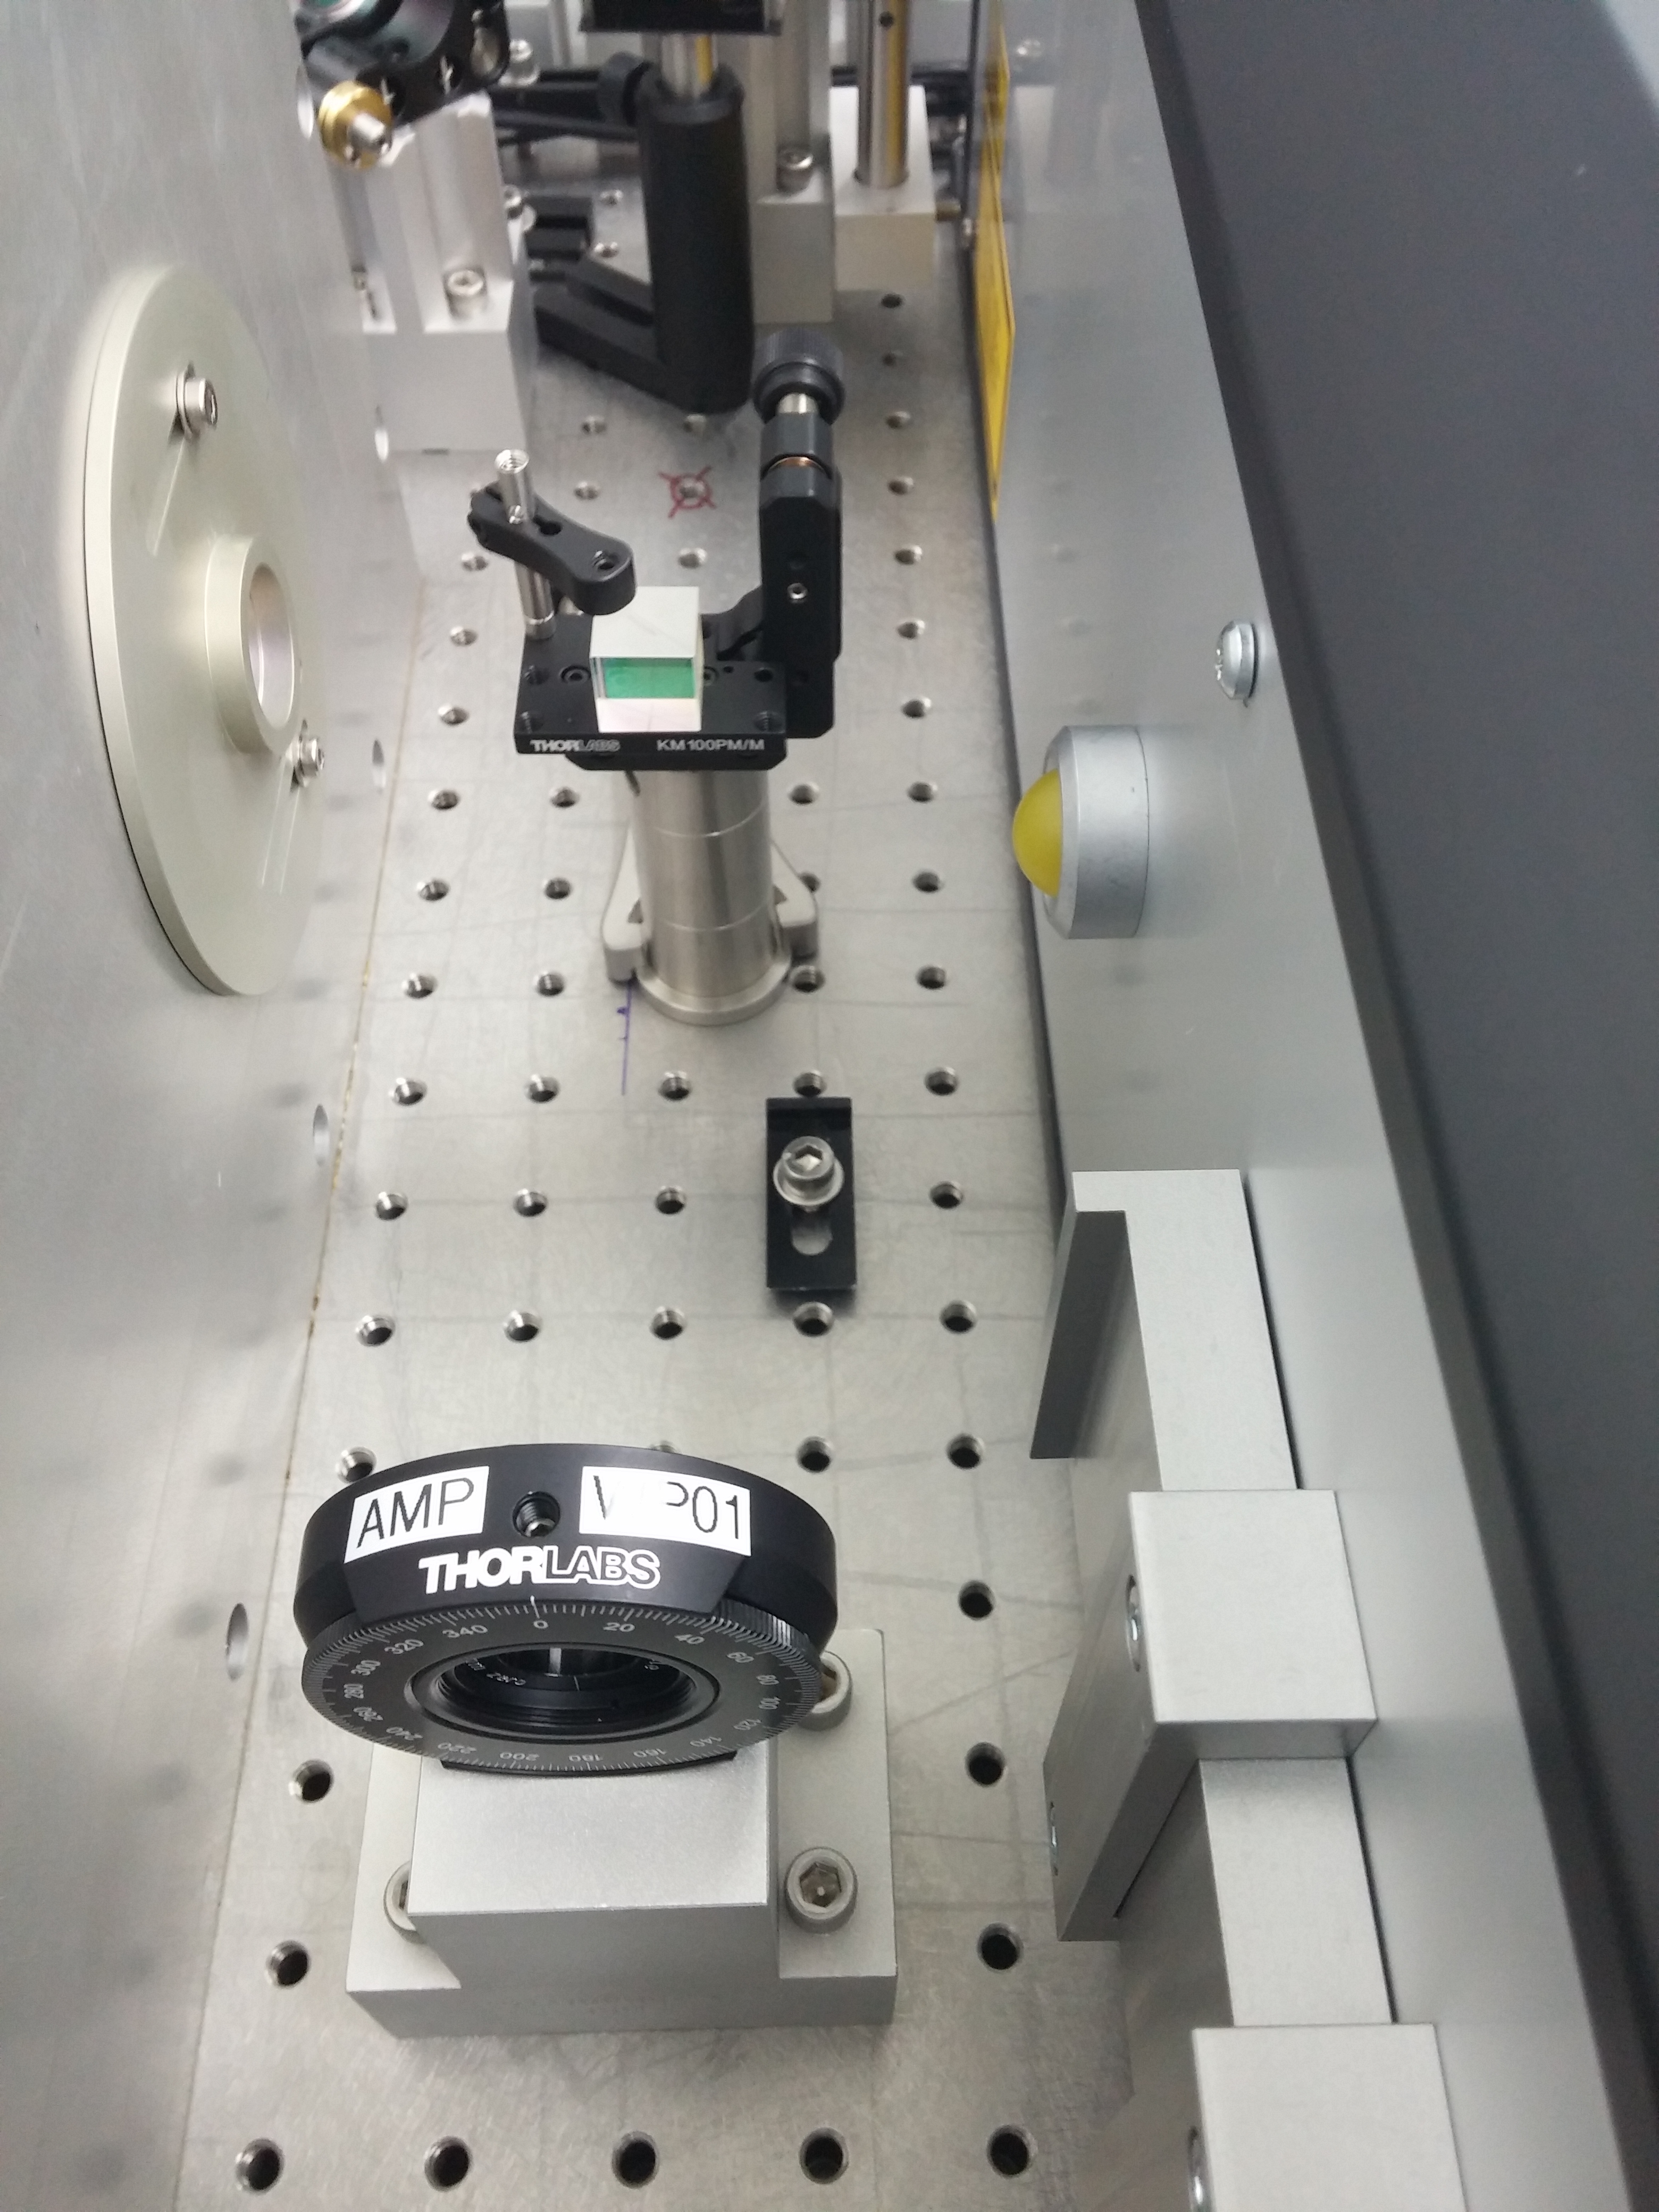
To begin this morning, we installed the Wincam to take a quick beam profile measurement of the FE beam to check if there was any obvious clipping from the new pick-off. There wasn't, the beam looked as it did after our first install attempt last Friday, and very close to when we finished the NPRO swap in September 2017. We decided to move on to installation of AMP_WP01 and PBSC01, the first new on-table components for the 70W amplifier; PBSC01 replaces mirror M02, and together with AMP_WP01 gives us the ability to switch back and forth between 70W amplifier and FE-only operation. We reduced the power from the FE to ~300mW using the HWP inside the FE (thereby reducing the NPRO power delivered to the MOPA) and installed AMP_WP01. We then made some rough marks on the table to roughly assist with installation of PBSC01, and then removed mirror M02. PBSC01 was installed on the table in place of M02 and we began alternating translation of the mount and yaw of the optic to recover the PMC alignment.
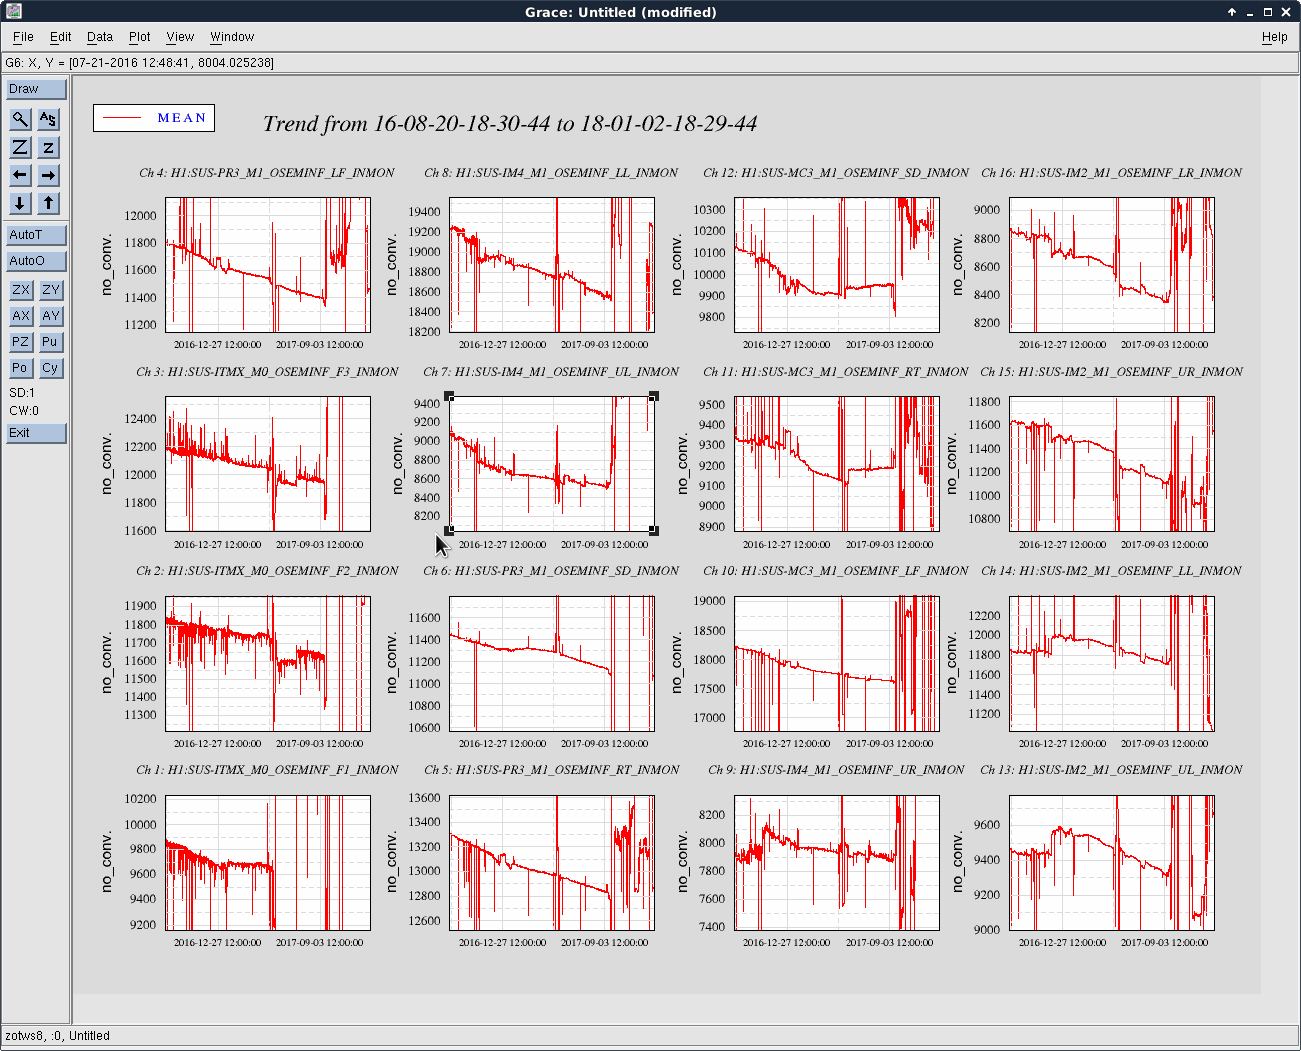
During this process we noticed that the output power of the FE was changing. Without touching any power control optics, the FE power had drifted from 300mW to ~6.9W. We decided to lower the NPRO power by reducing the injection current from the NPRO power supply; we dropped it to ~1.26A from its operating point of 2.222A, which brought the FE output power back to ~300mW. Continuing the alignment, the FE power continued to increase on its own, getting up to 1.5W. At this point I noticed that I could adjust the HWP in the FE to reduce the power slightly, which indicates a possible shift in polarization from the NPRO. At this point we broke for lunch and to consult with Matt regarding this. Maybe they had seen similar behavior at LLO? Turns out they had not. We took some trends and to the best we could tell the FE power was following the NPRO power (I'll post the trends as a comment to this alog tomorrow). At this time we also noticed that when the FE is running at full power, the new pick-off is saturating; we will adjust this after PBSC01 installation. We decided to continue on with the alignment after lunch, this time putting the FE and NPRO output powers on a StripTool so we could monitor it in real-time while we worked. Continuing the alignment, the FE outuput power continued to slowly increase on its own. Once it got to ~800mW, we decided to lower the NPRO injection current again. I dropped it from 1.26A to 1.0A; this lowered the FE output power to ~300mW, where it stayed for the remainder of the afternoon. I have never seen this behavior before and am unclear as to the cause.
Regardless, by slowly translating and yawing PBSC01, using progressively further away alignment references, we are able to recover the majority of the PMC alignment; we did not have to touch mirror M01 at all. We fine-tuned the PMC alignment with mirrors M06 and M07 and took a visibility measurement:
- Visibility after PBSC01 installation
- PMC locked: -0.025 V
- PMC unlocked: -0.508 V
- Visibility: 95.1%
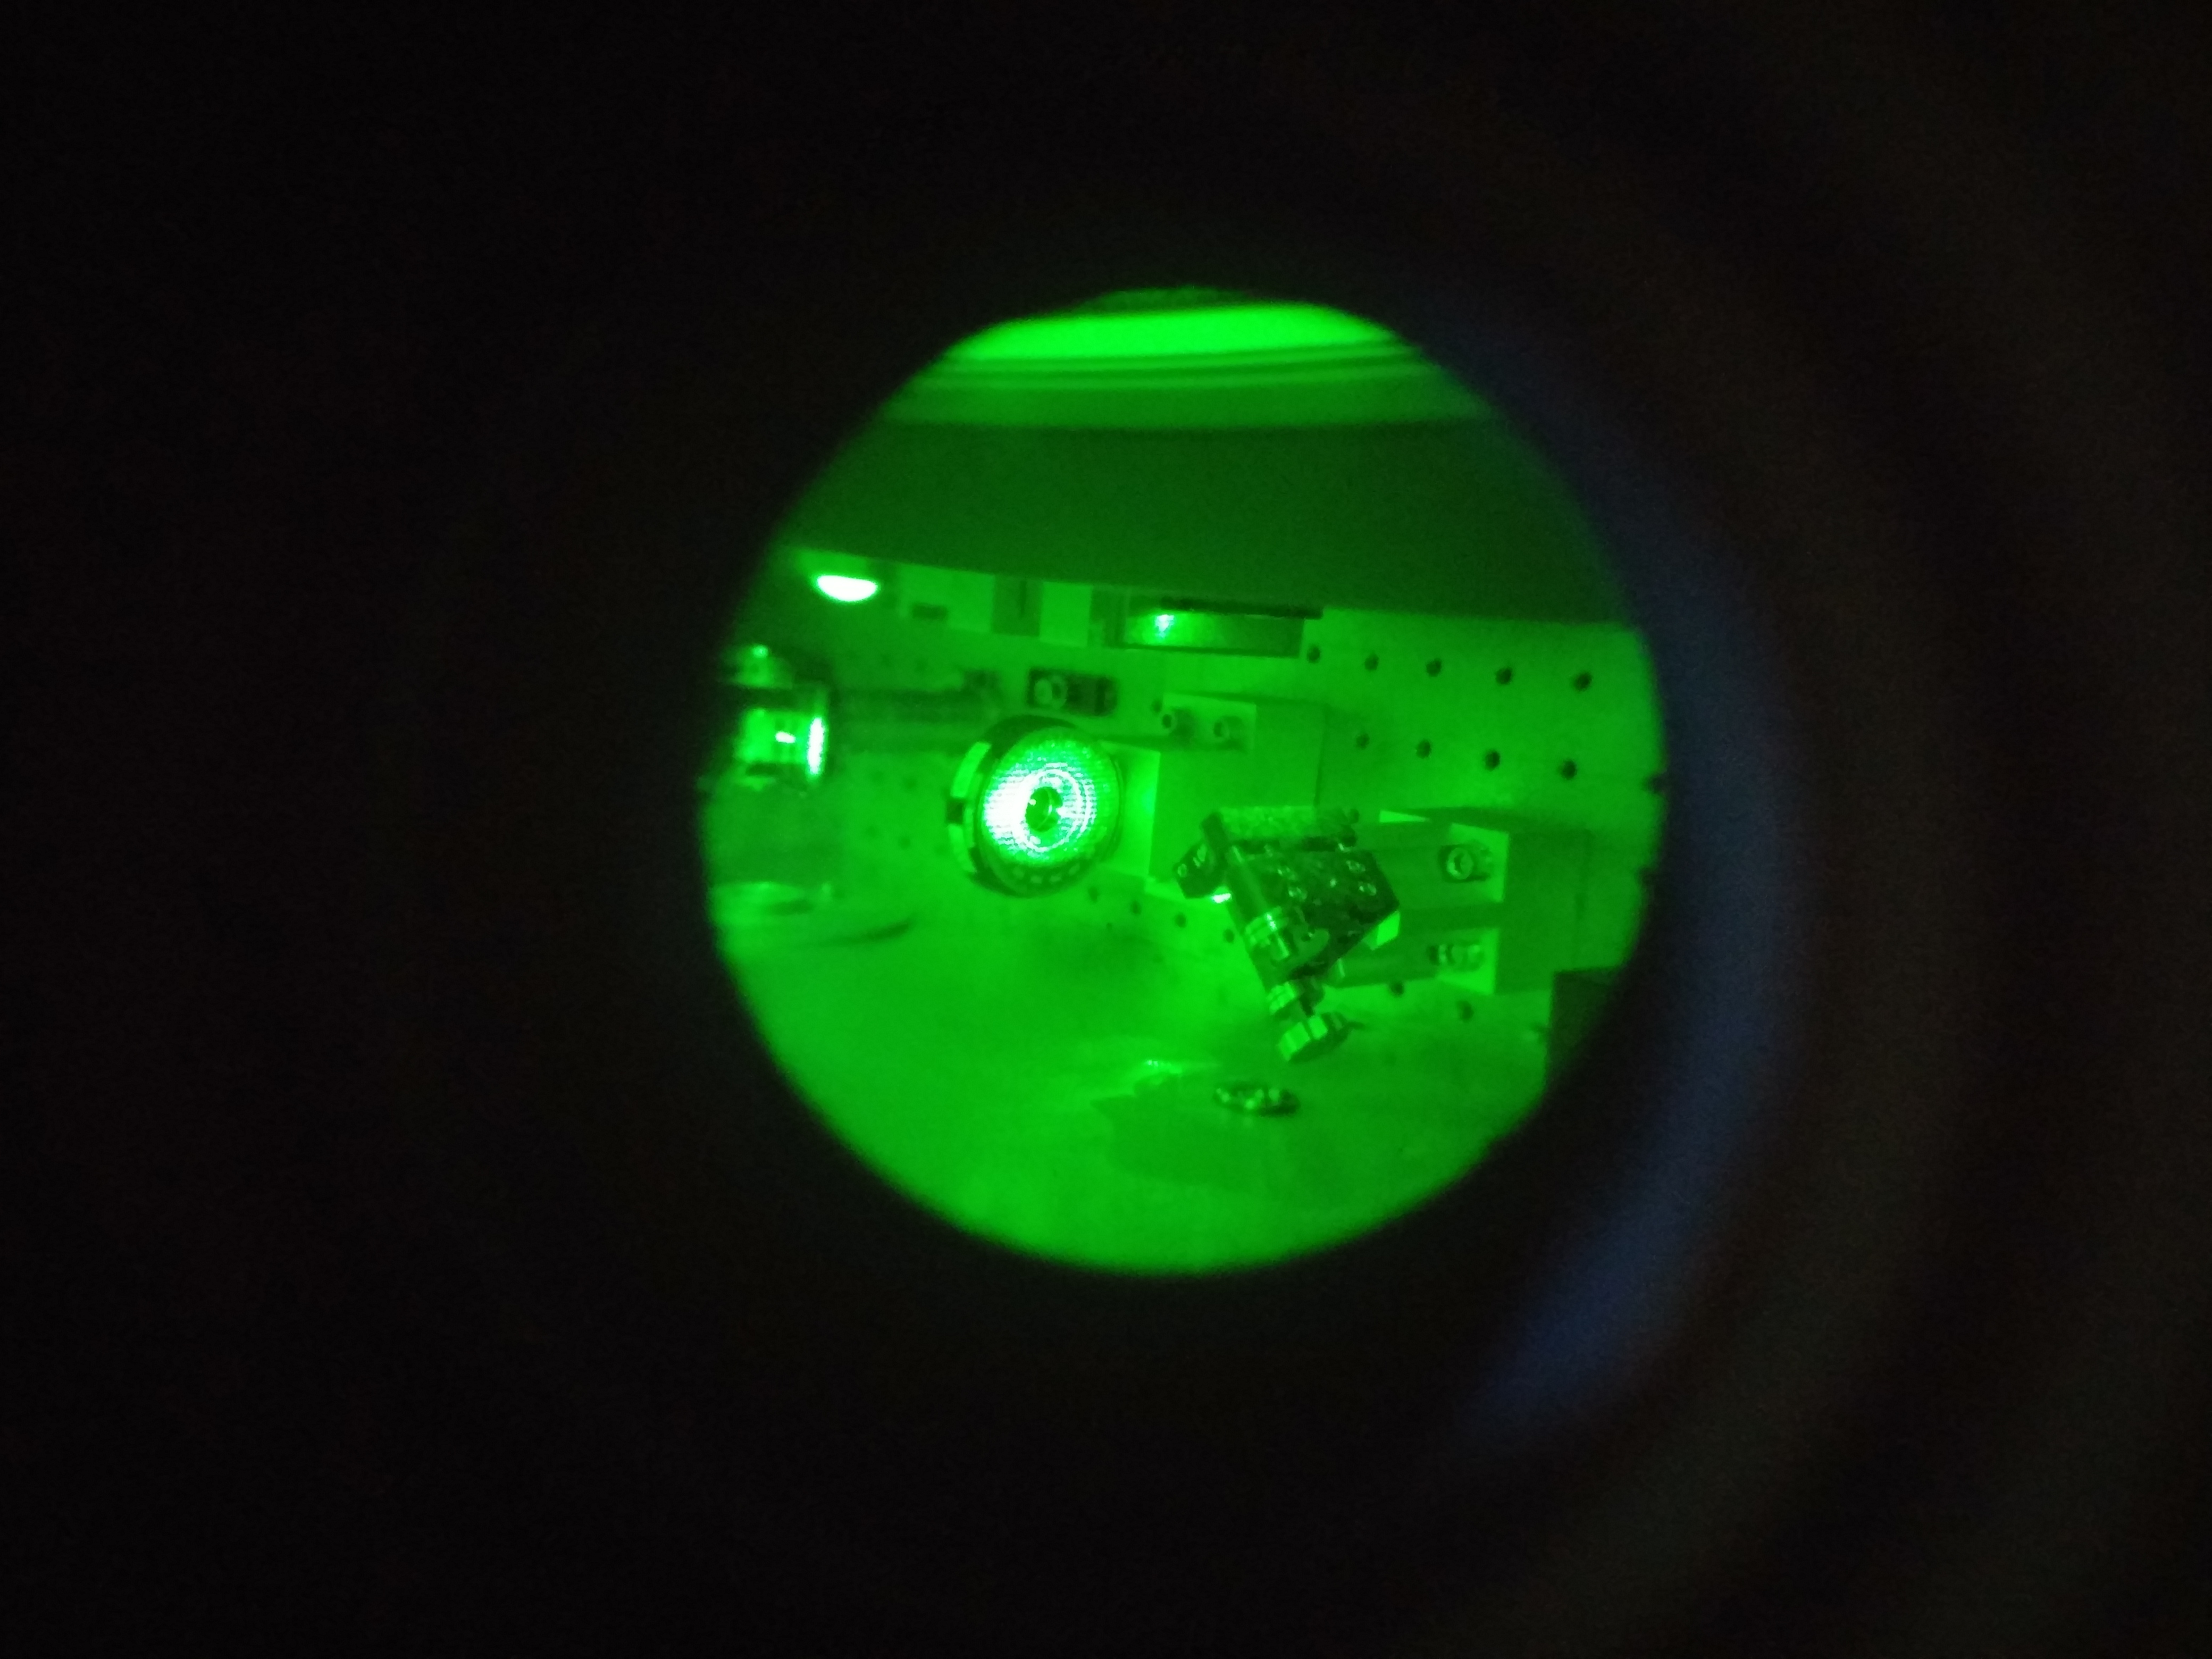
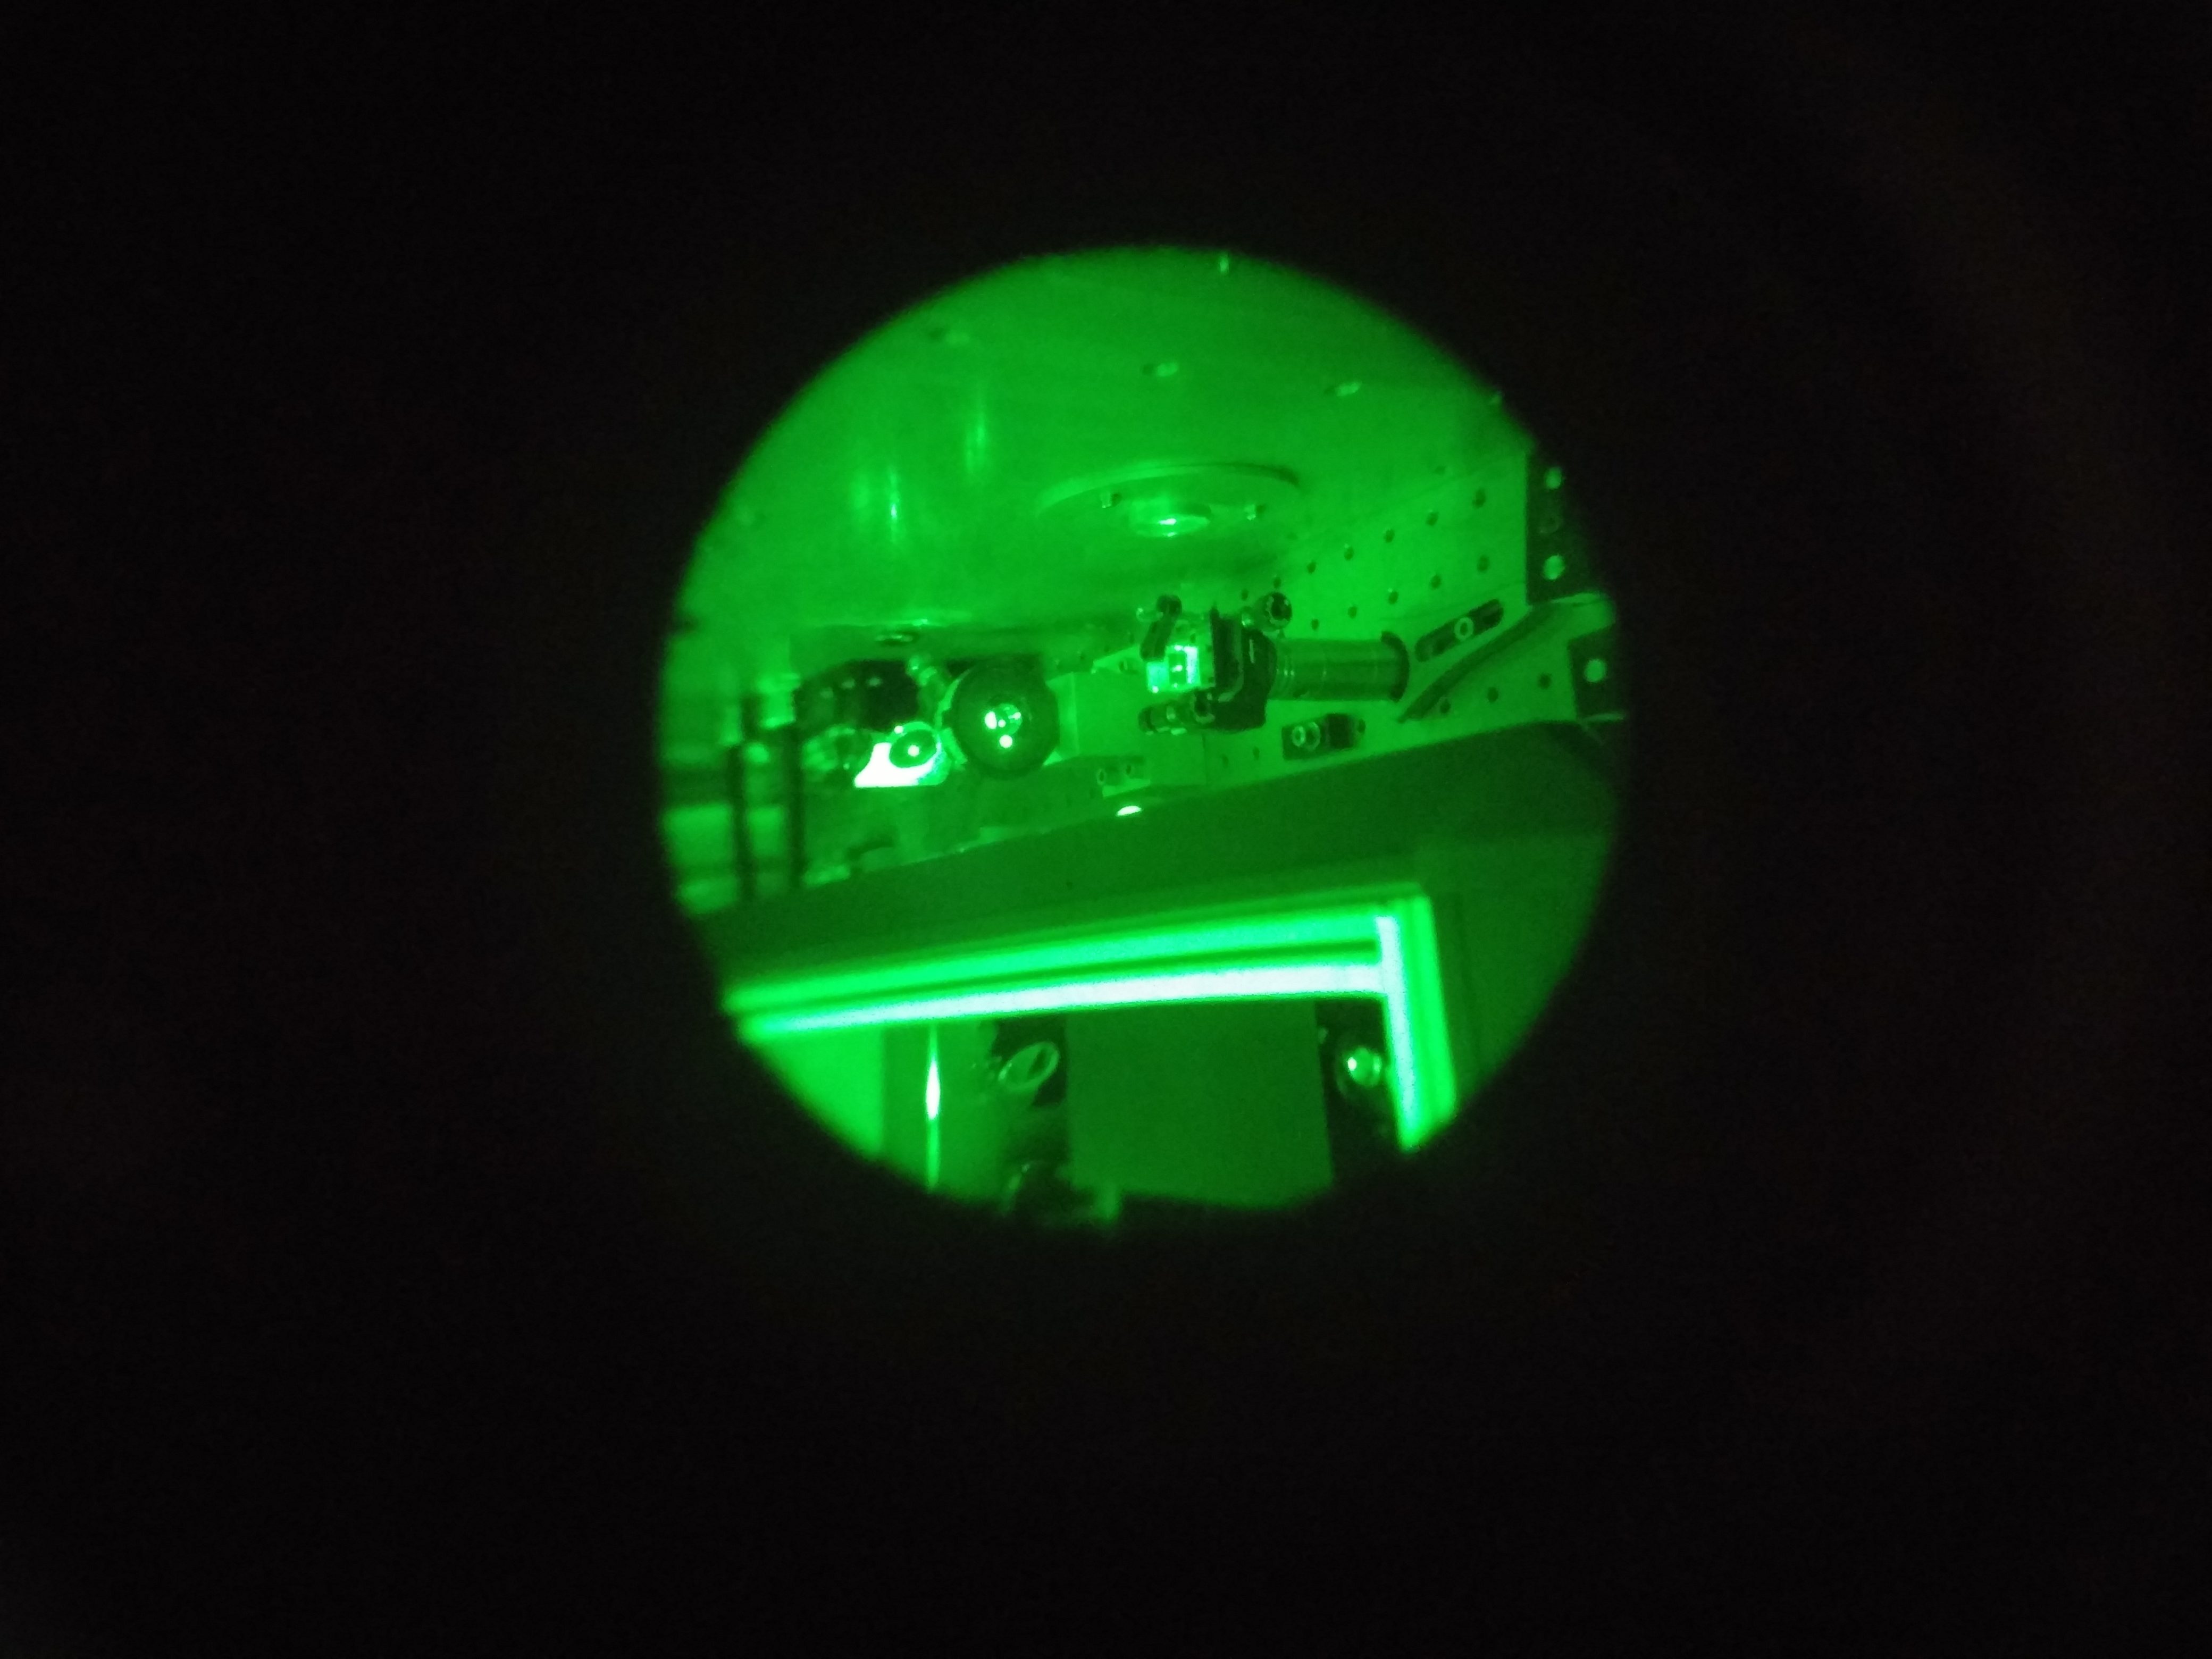
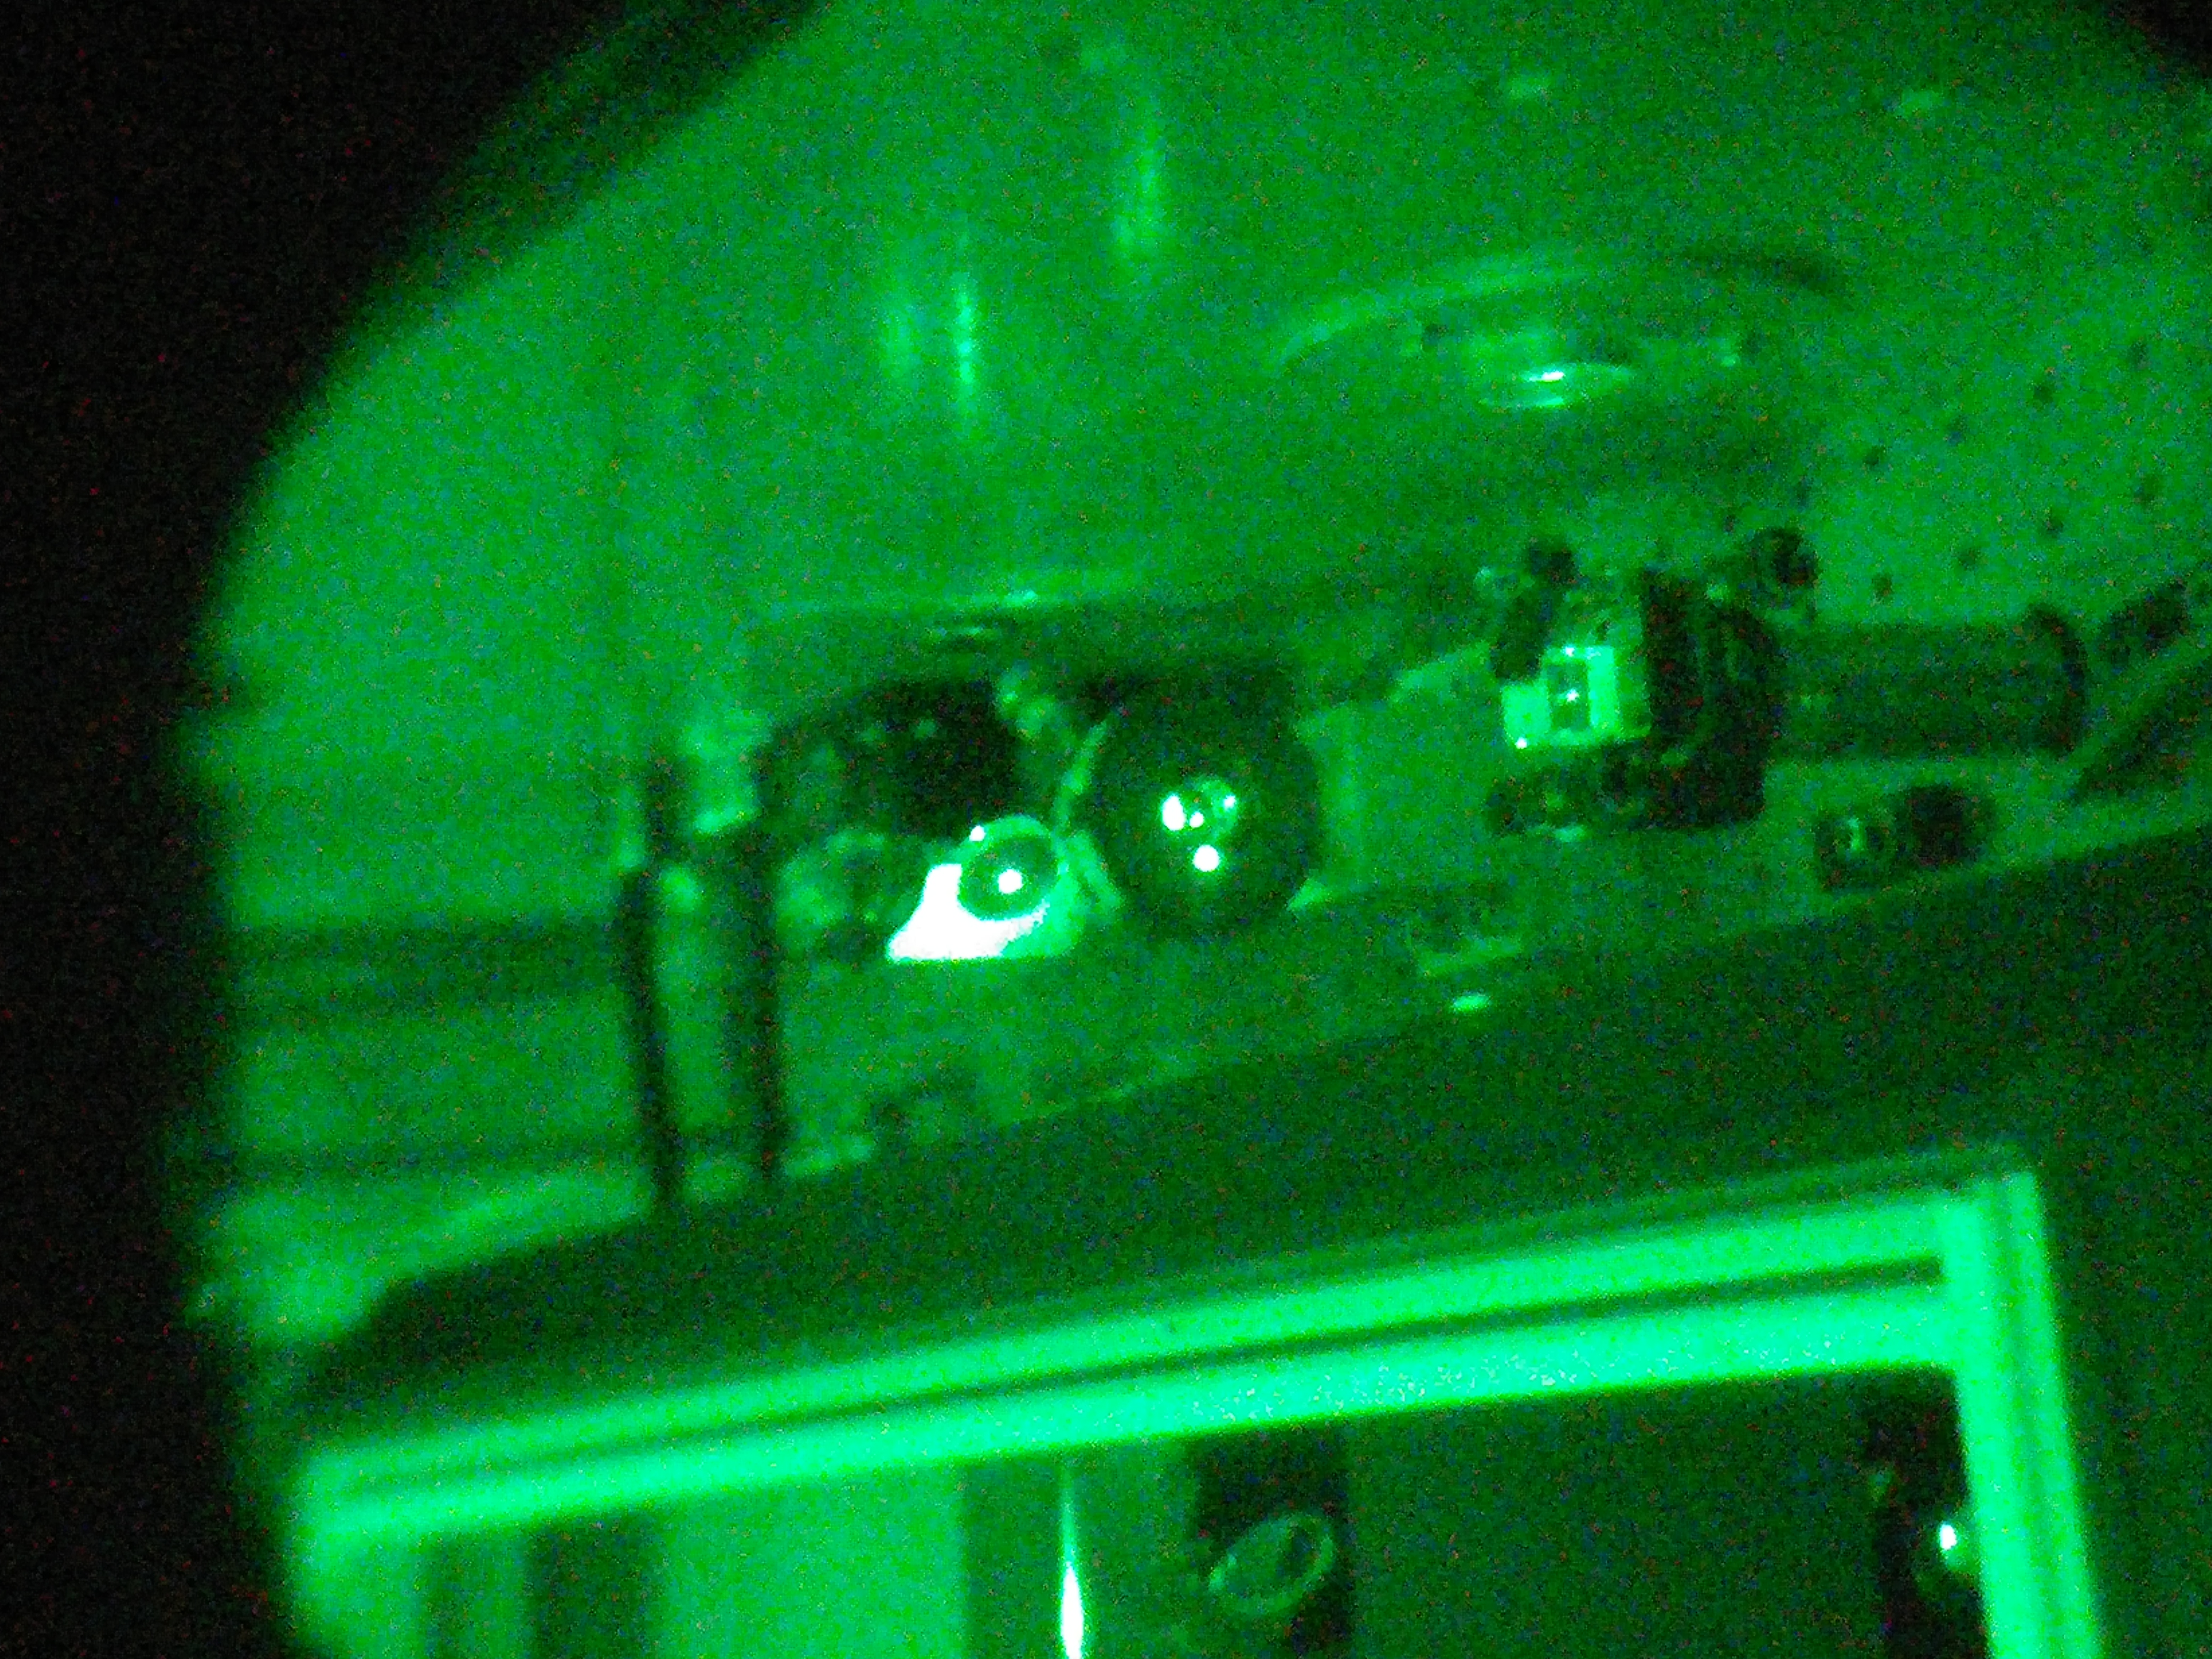
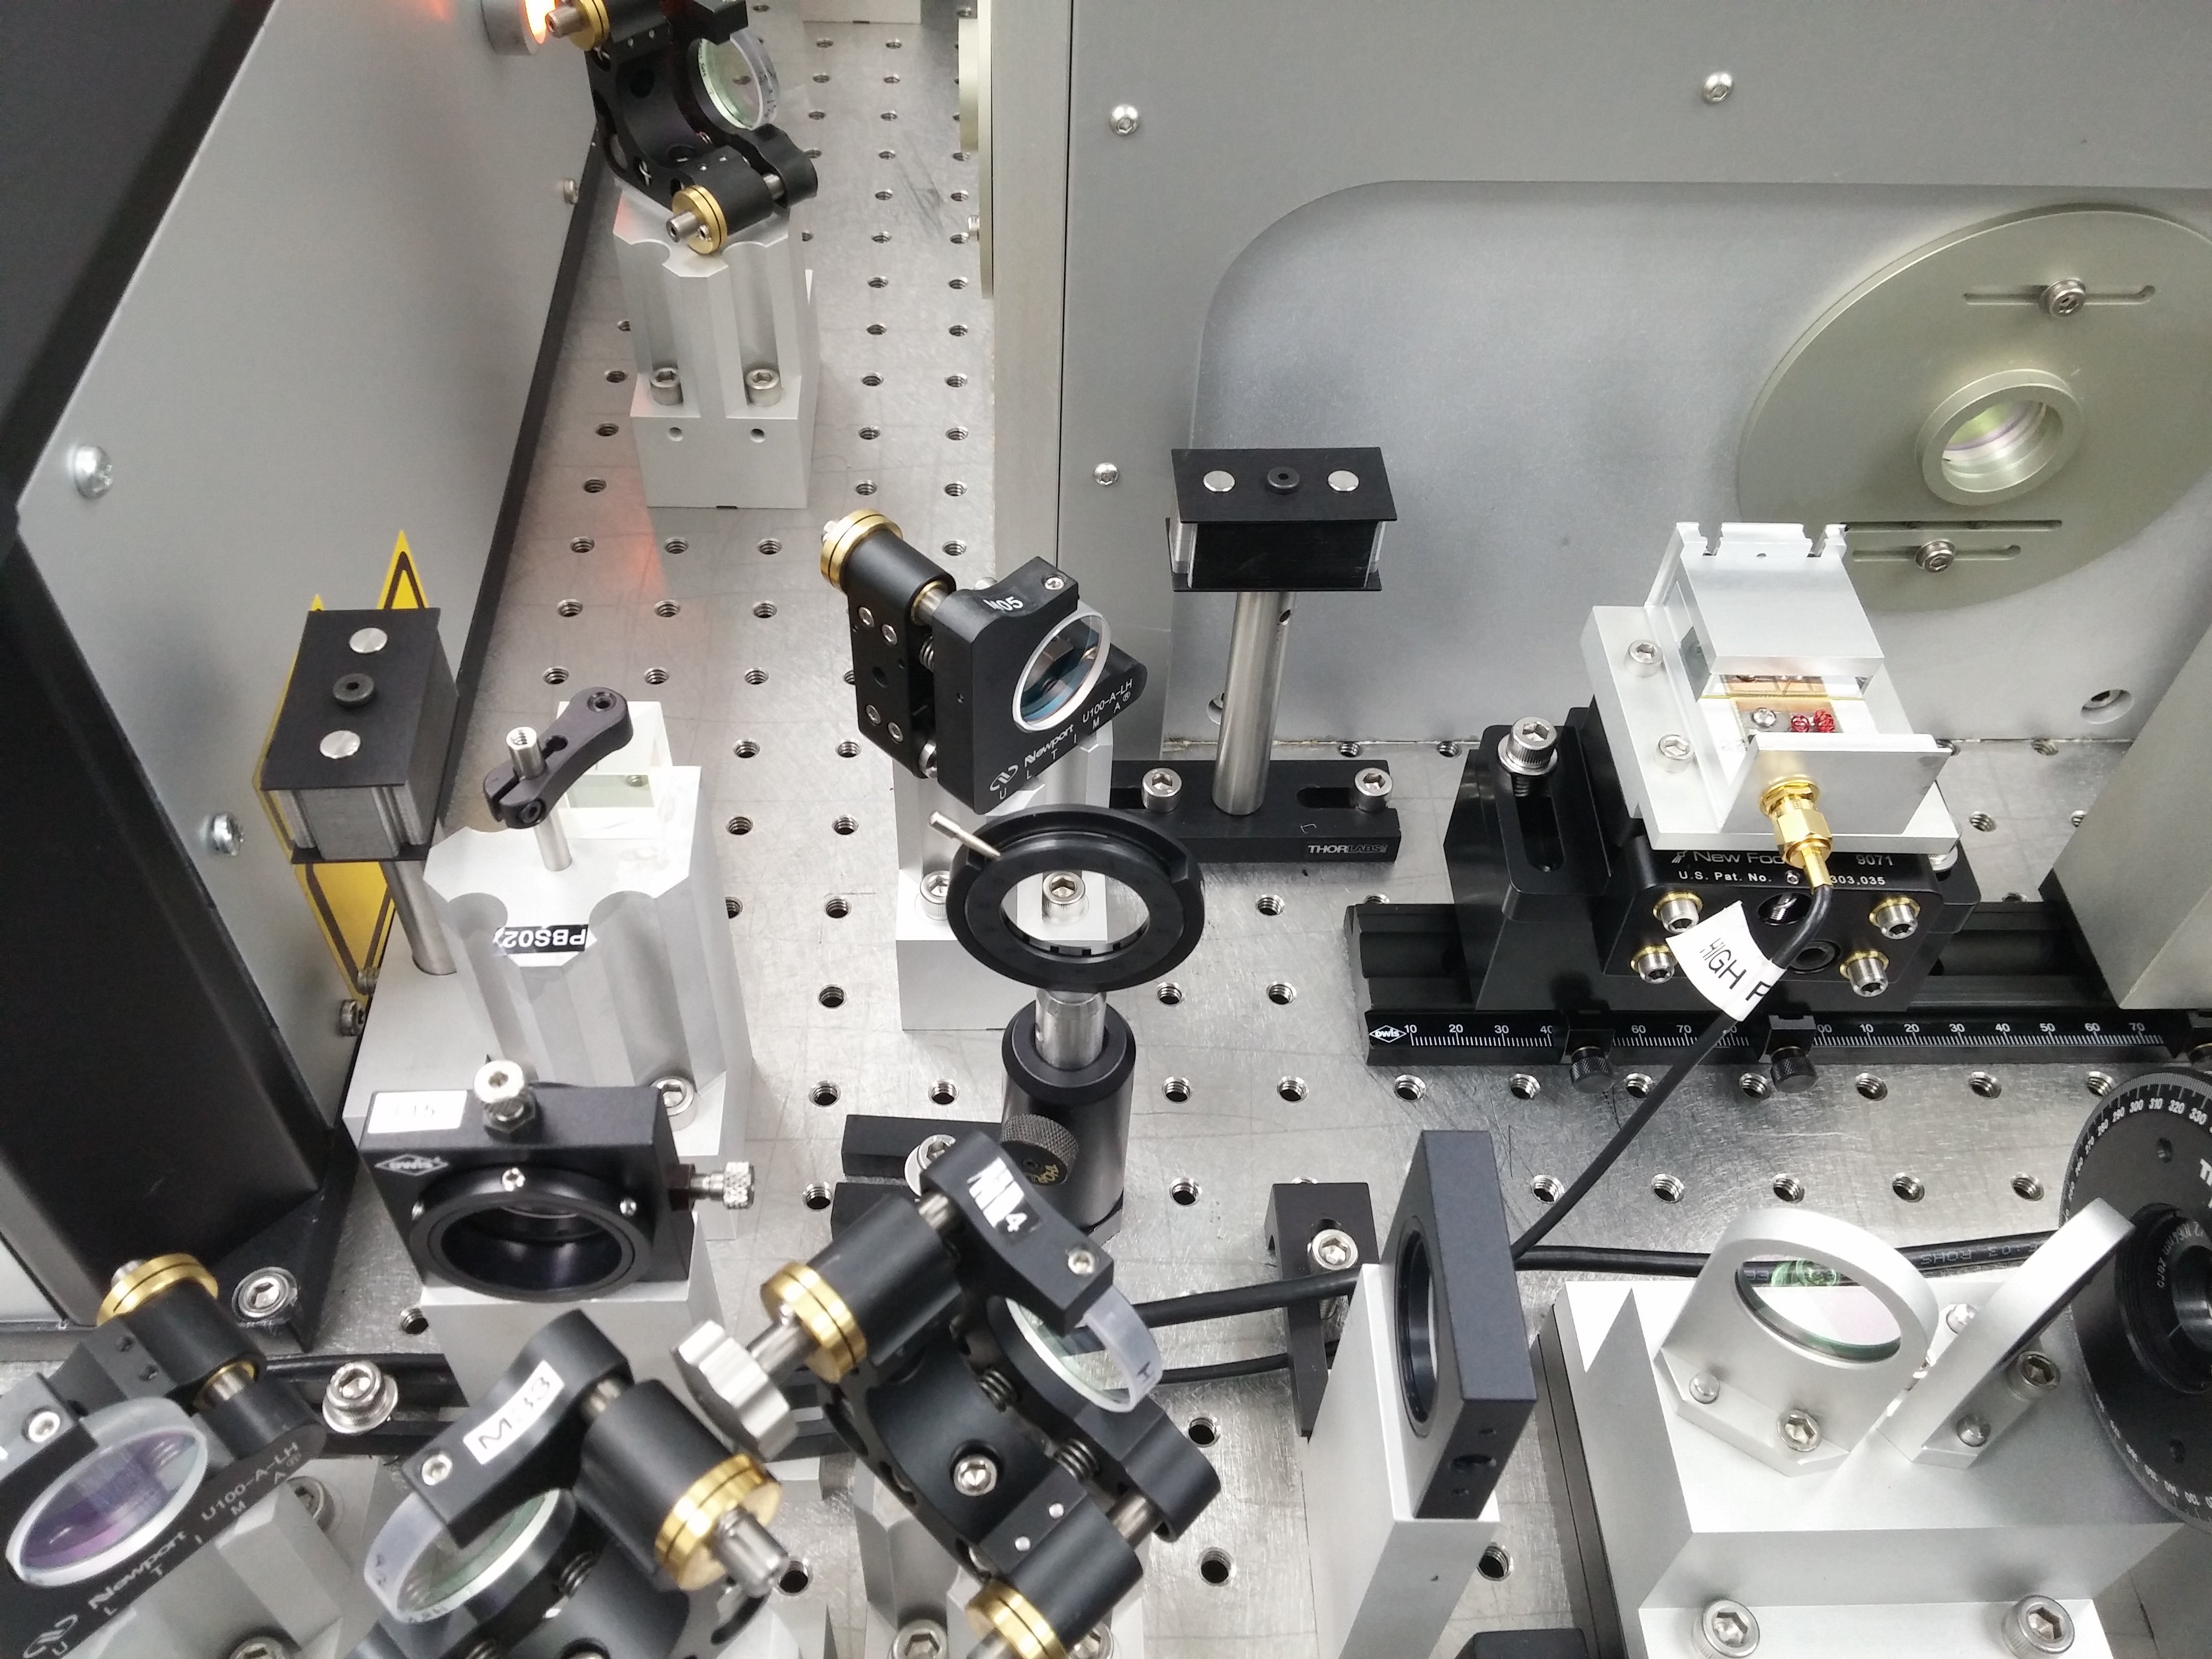
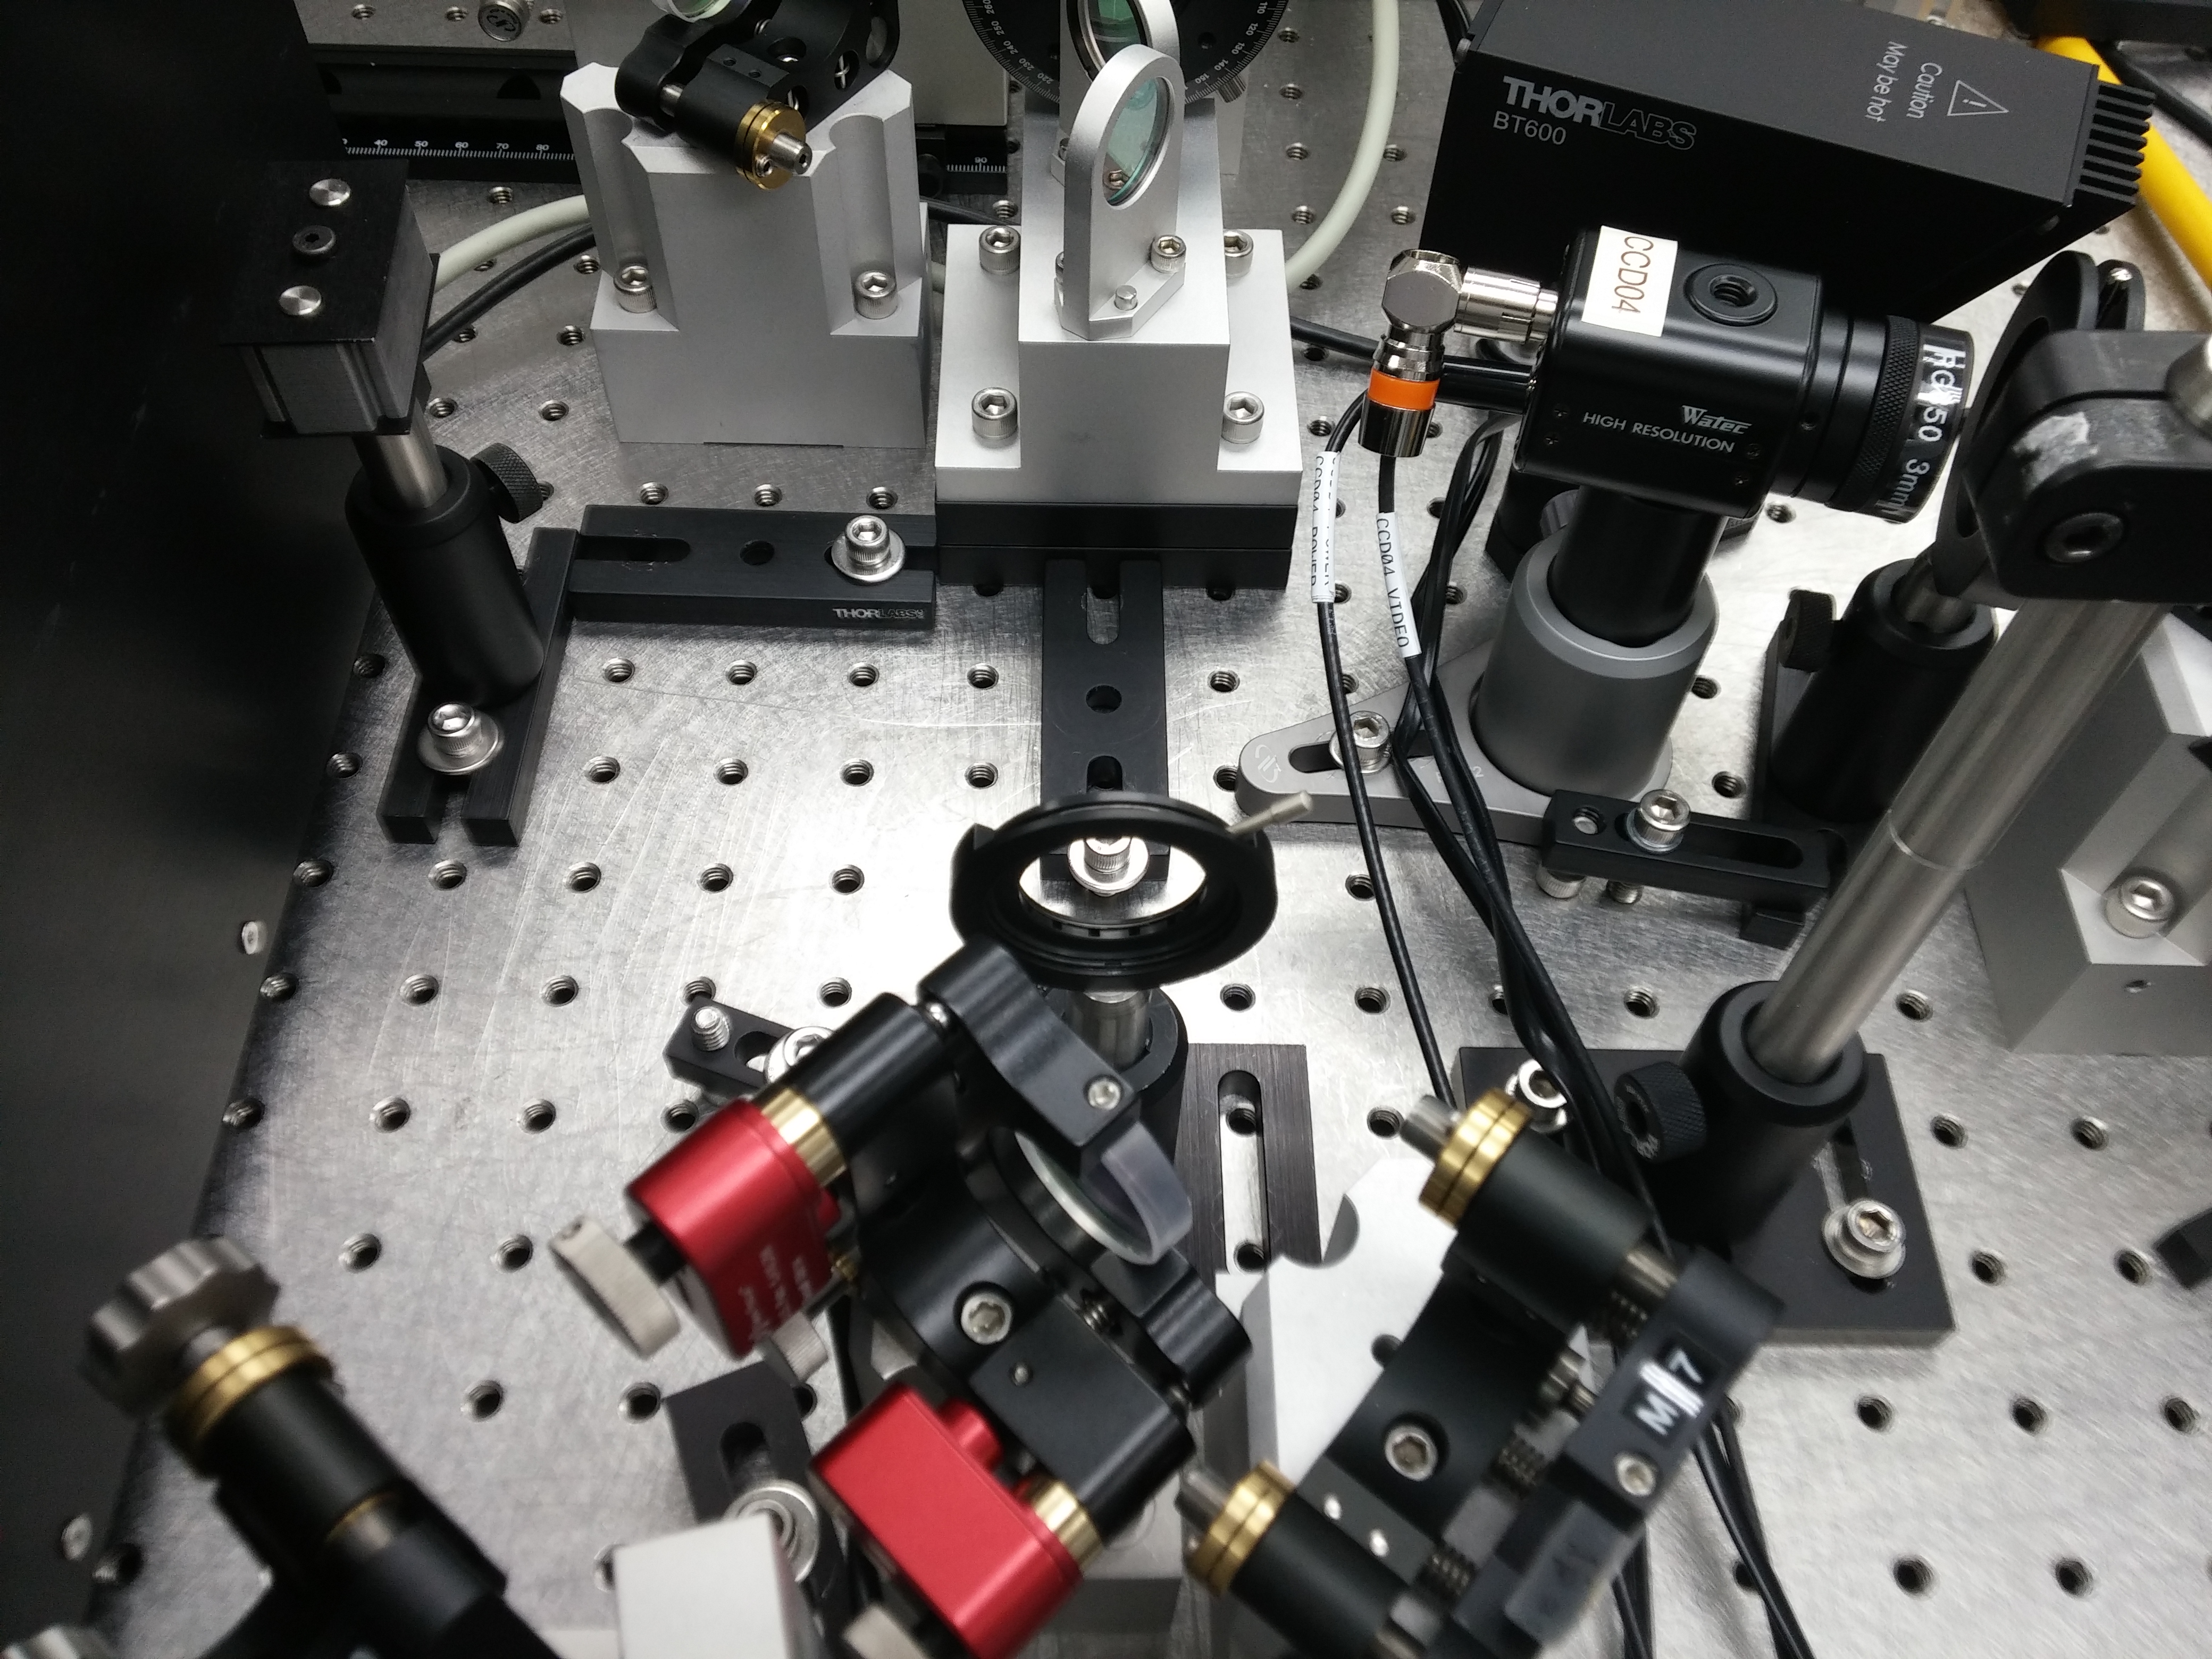
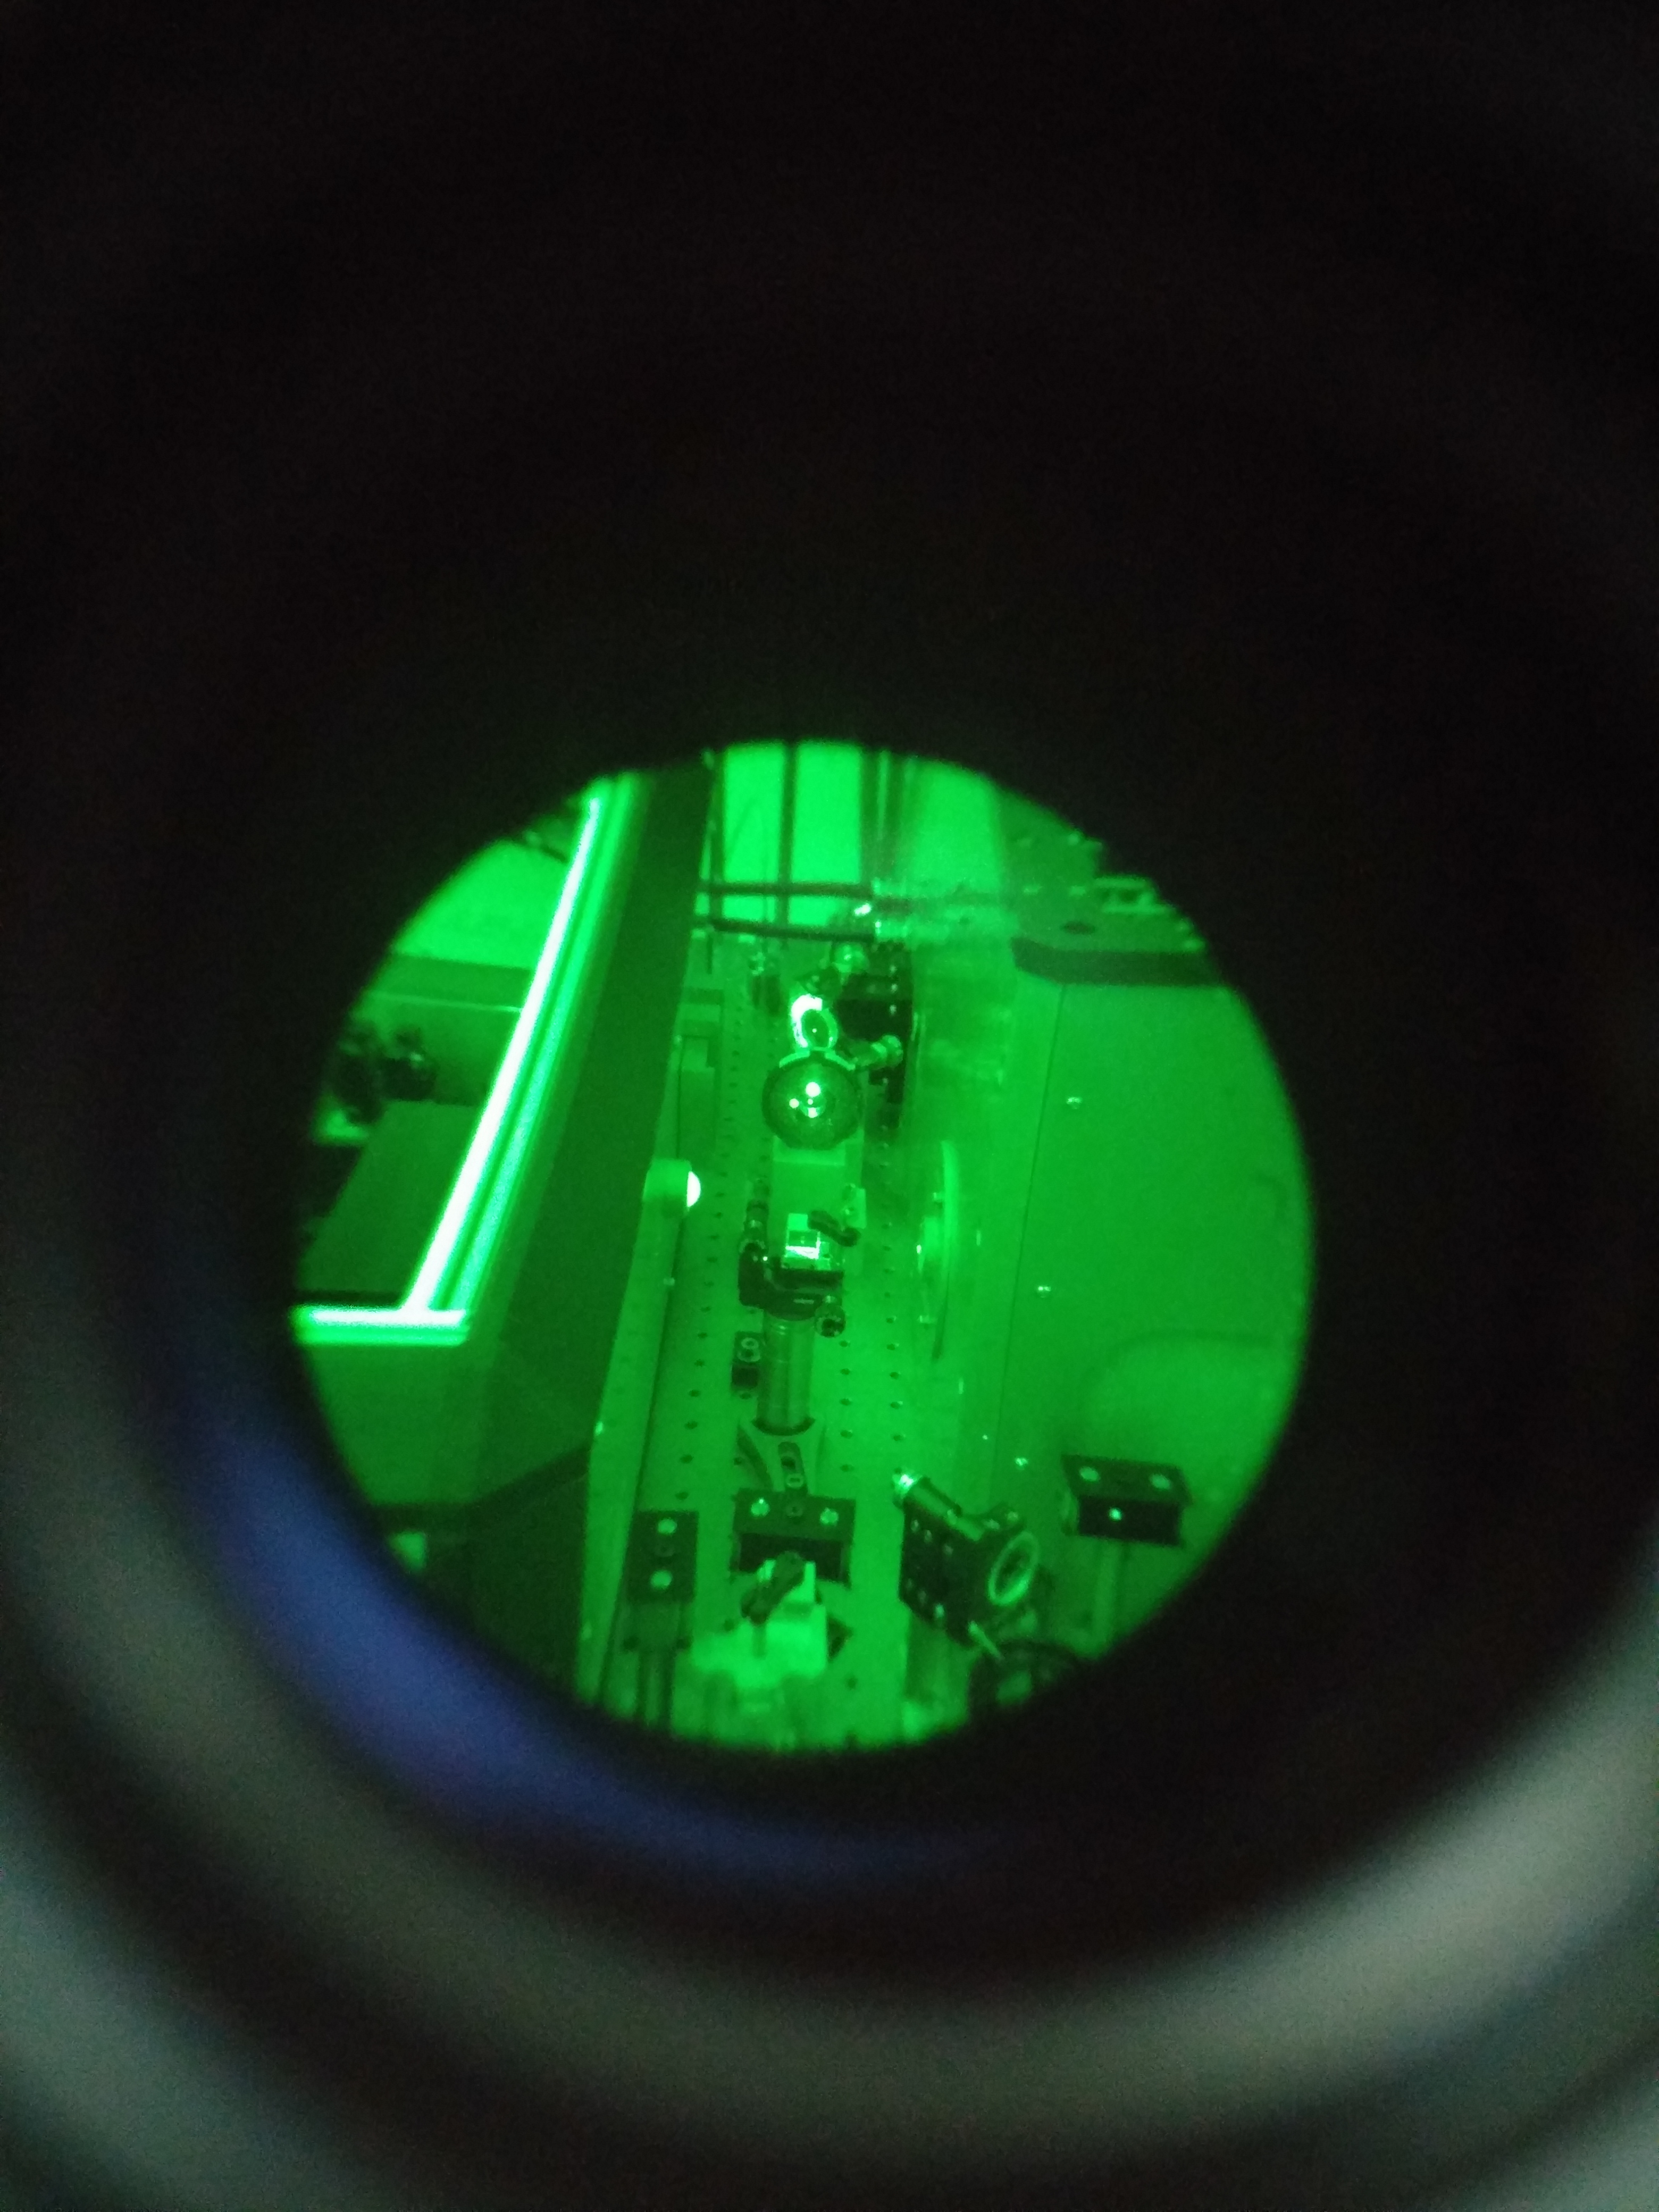
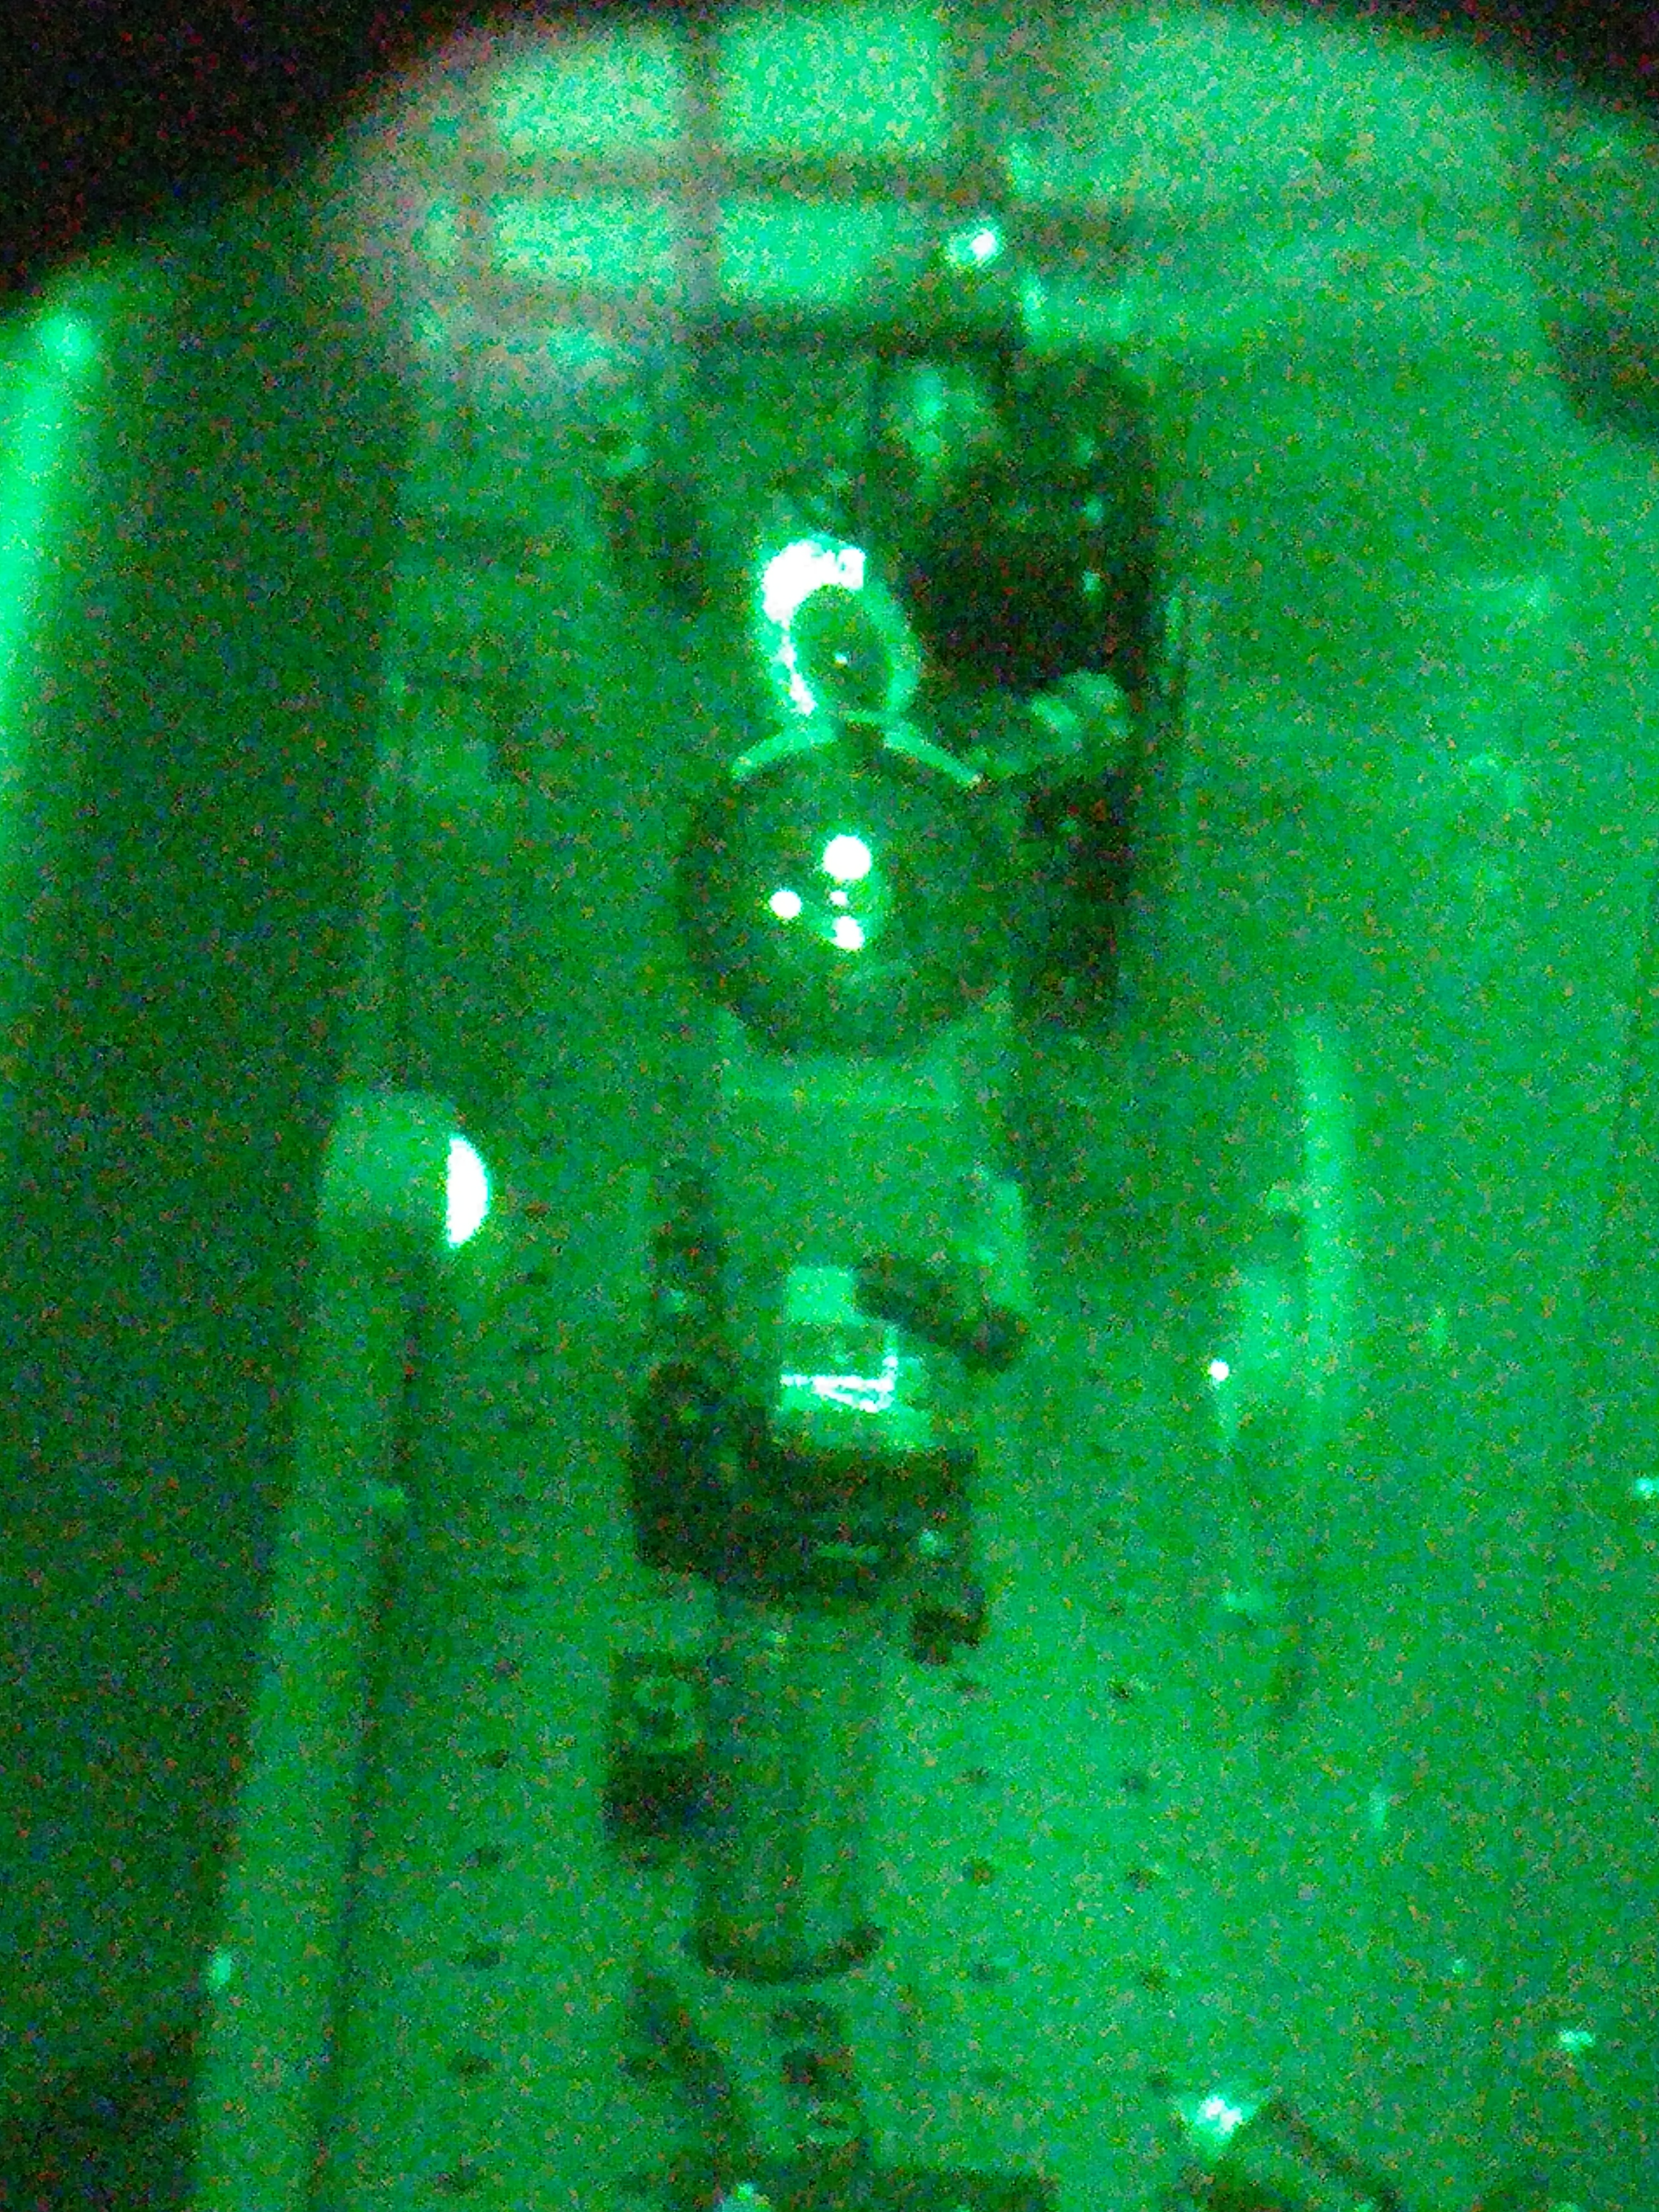
One thing to note is we are once again down in power incident on the PMC. Before PBSC01 installation there was ~23W incident on the PMC; after installation there is ~20.5W incident on the PMC. While there is some leakage from PBSC01 towards the 70W amplifier beam path, it's not 2.5W worth. Once again we could find no obvious clipping or misalignment downstream of PBSC01 that would cause this loss of power. Looking upstream however, we see a good deal of scatter. Can't easily tell where it's coming from, I'm suspecting scatter from the new pick-off. I've attached a couple pictures showing this scatter.
Tomorrow our plan is to get a picture of the beam profile post-PBSC01 installation, and then to begin investigating this scatter. We know we need to adjust the alignment of the pick-off to prevent saturation of the PD, maybe that will help with the scatter as well. Once that is taken care of we plan on moving on to measuring the beam caustics of the FE for mode matching modeling.
Attachments:
- Pic 094829: Iris between M04 and M05
- Pic 094836: Iris between M06 and M07
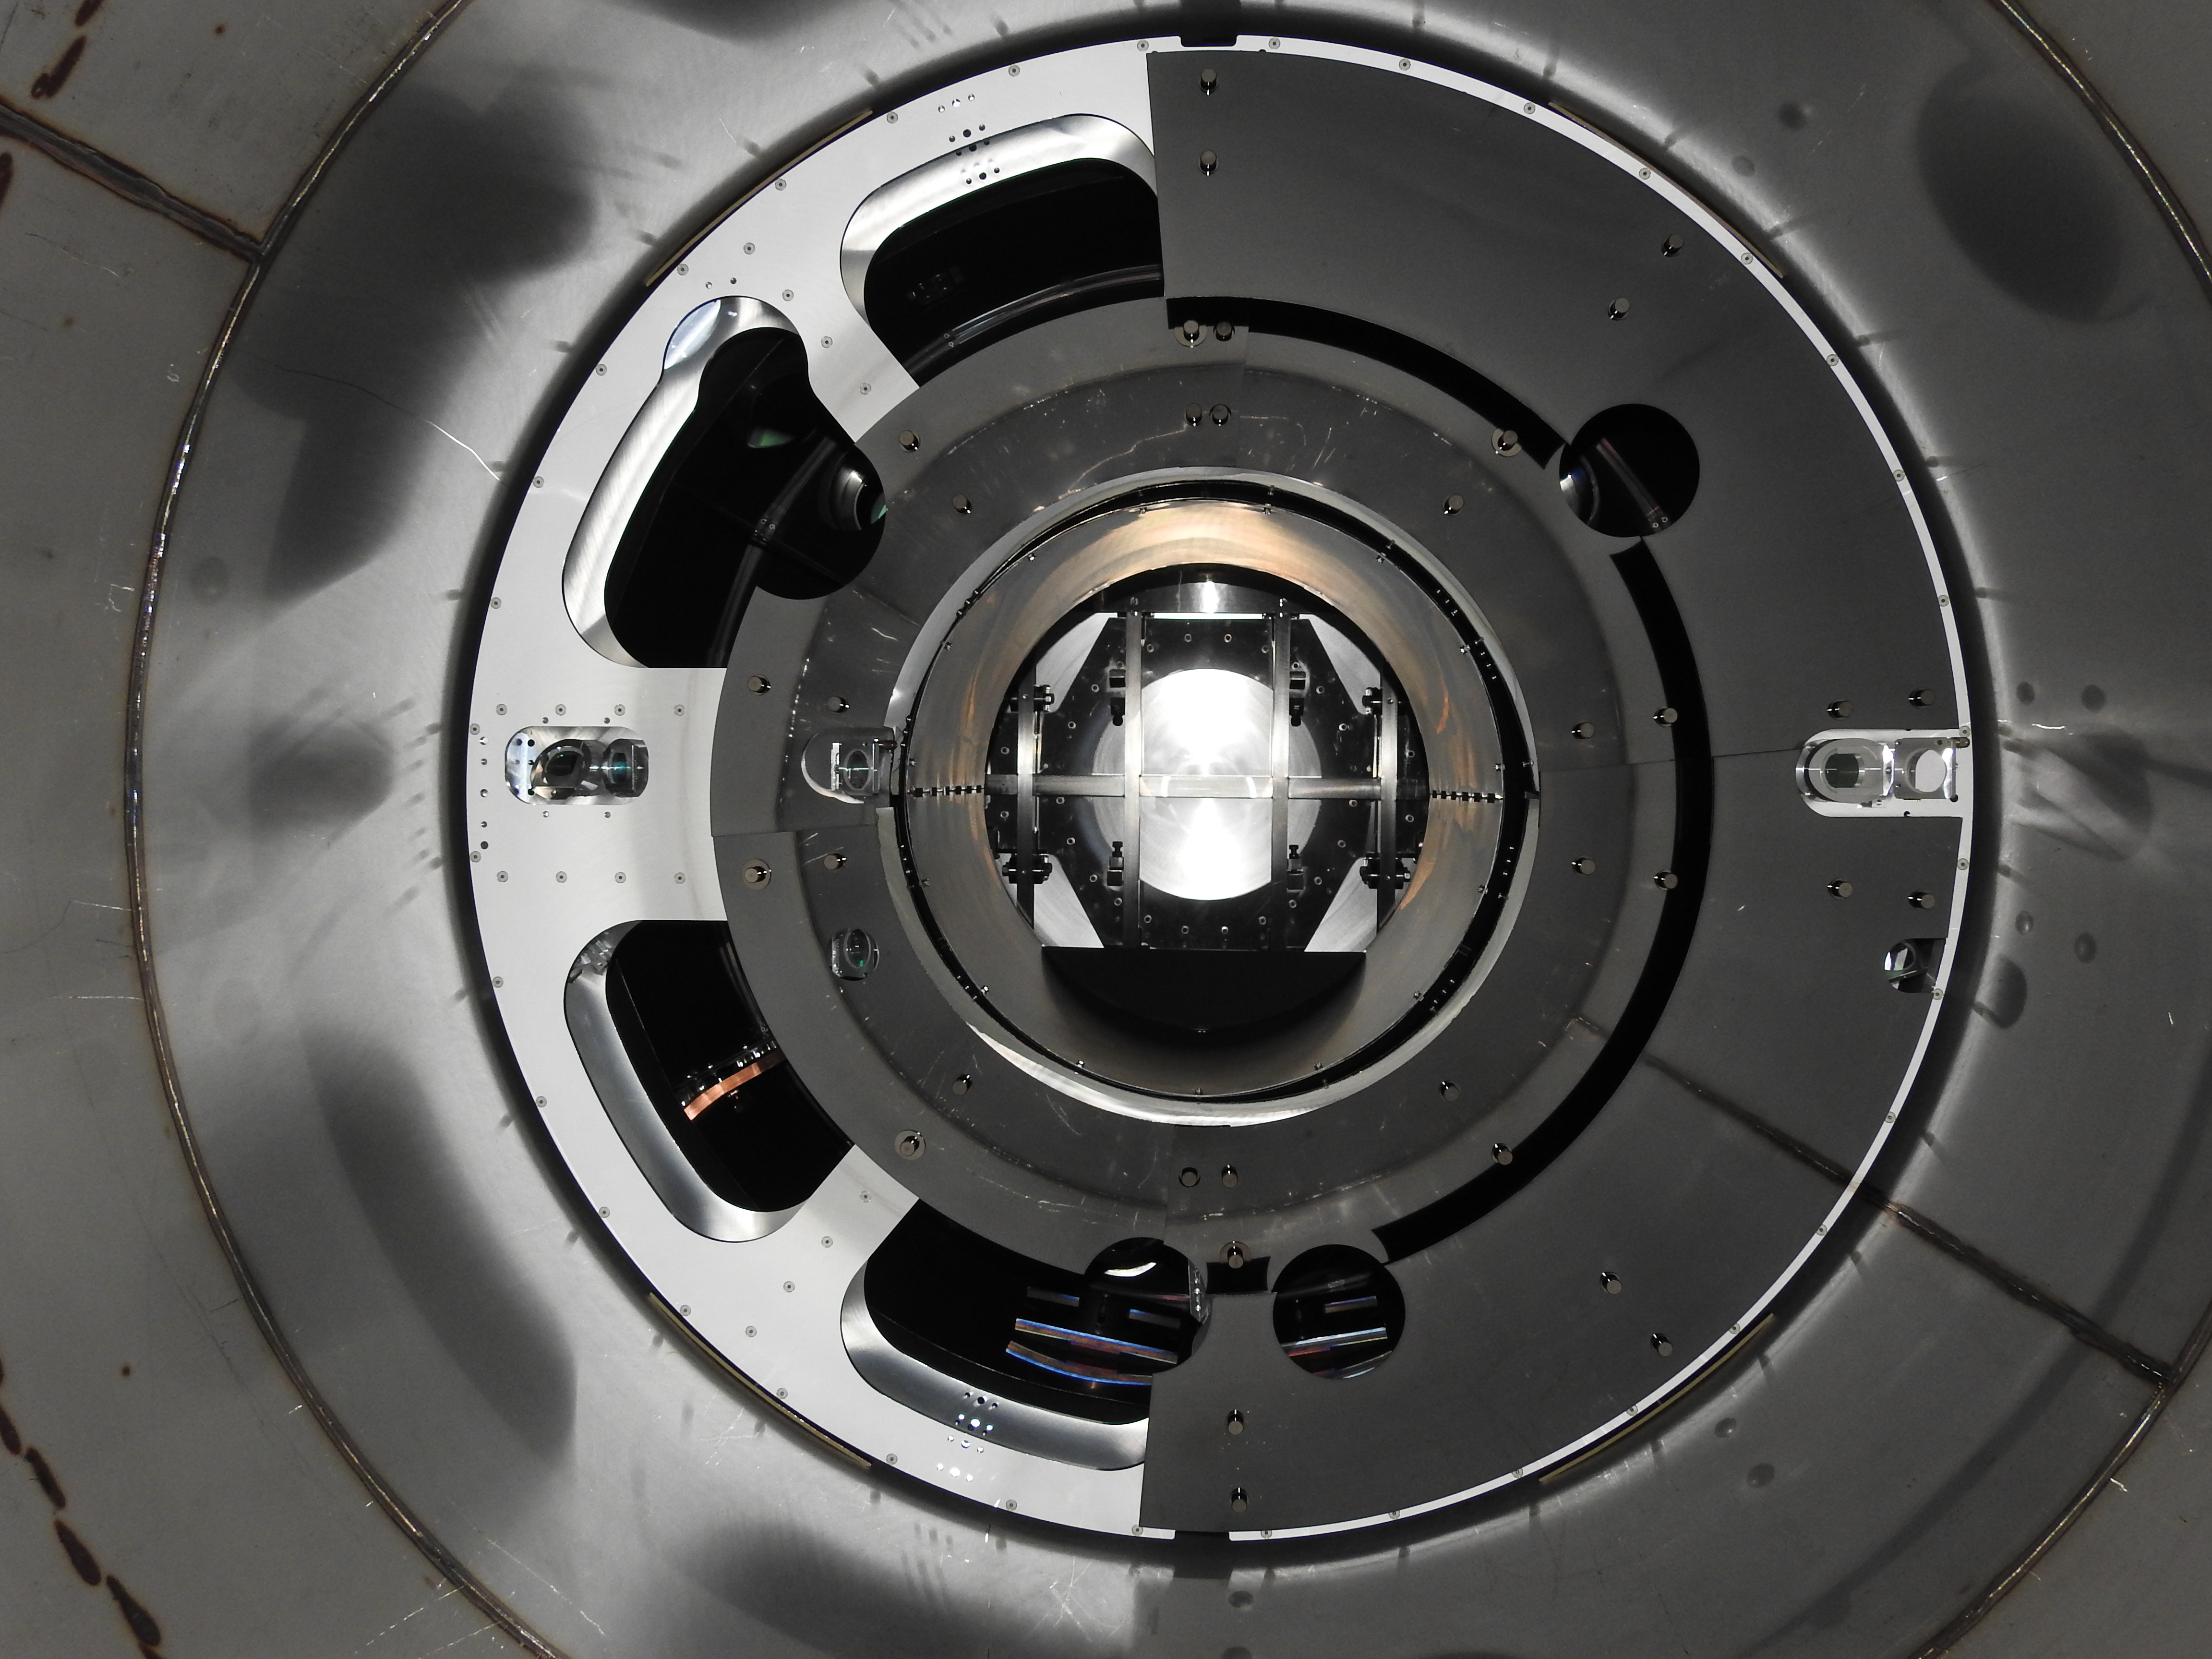
- Pic 161946: AMP_WP01 and PBSC01 as installed
- Pics 154644 and 154712: Scatter seen around FE output