Ops Shift Log: 02/26/2018, Day Shift 16:00 – 08:00 (08:00 - 16:00) Time - UTC (PT)
State of H1: Unlocked - Vent
Intent Bit: Engineering
Support: N/A
Incoming Operator: N/A
Shift Summary: Take over for Cheryl. Transition LVEA to laser safe
Activity Log: Time - UTC (PT)
19:15 (11:15) Take over Cheryl
19:22 (11:22) Betsy & Travis – Back from End-Y
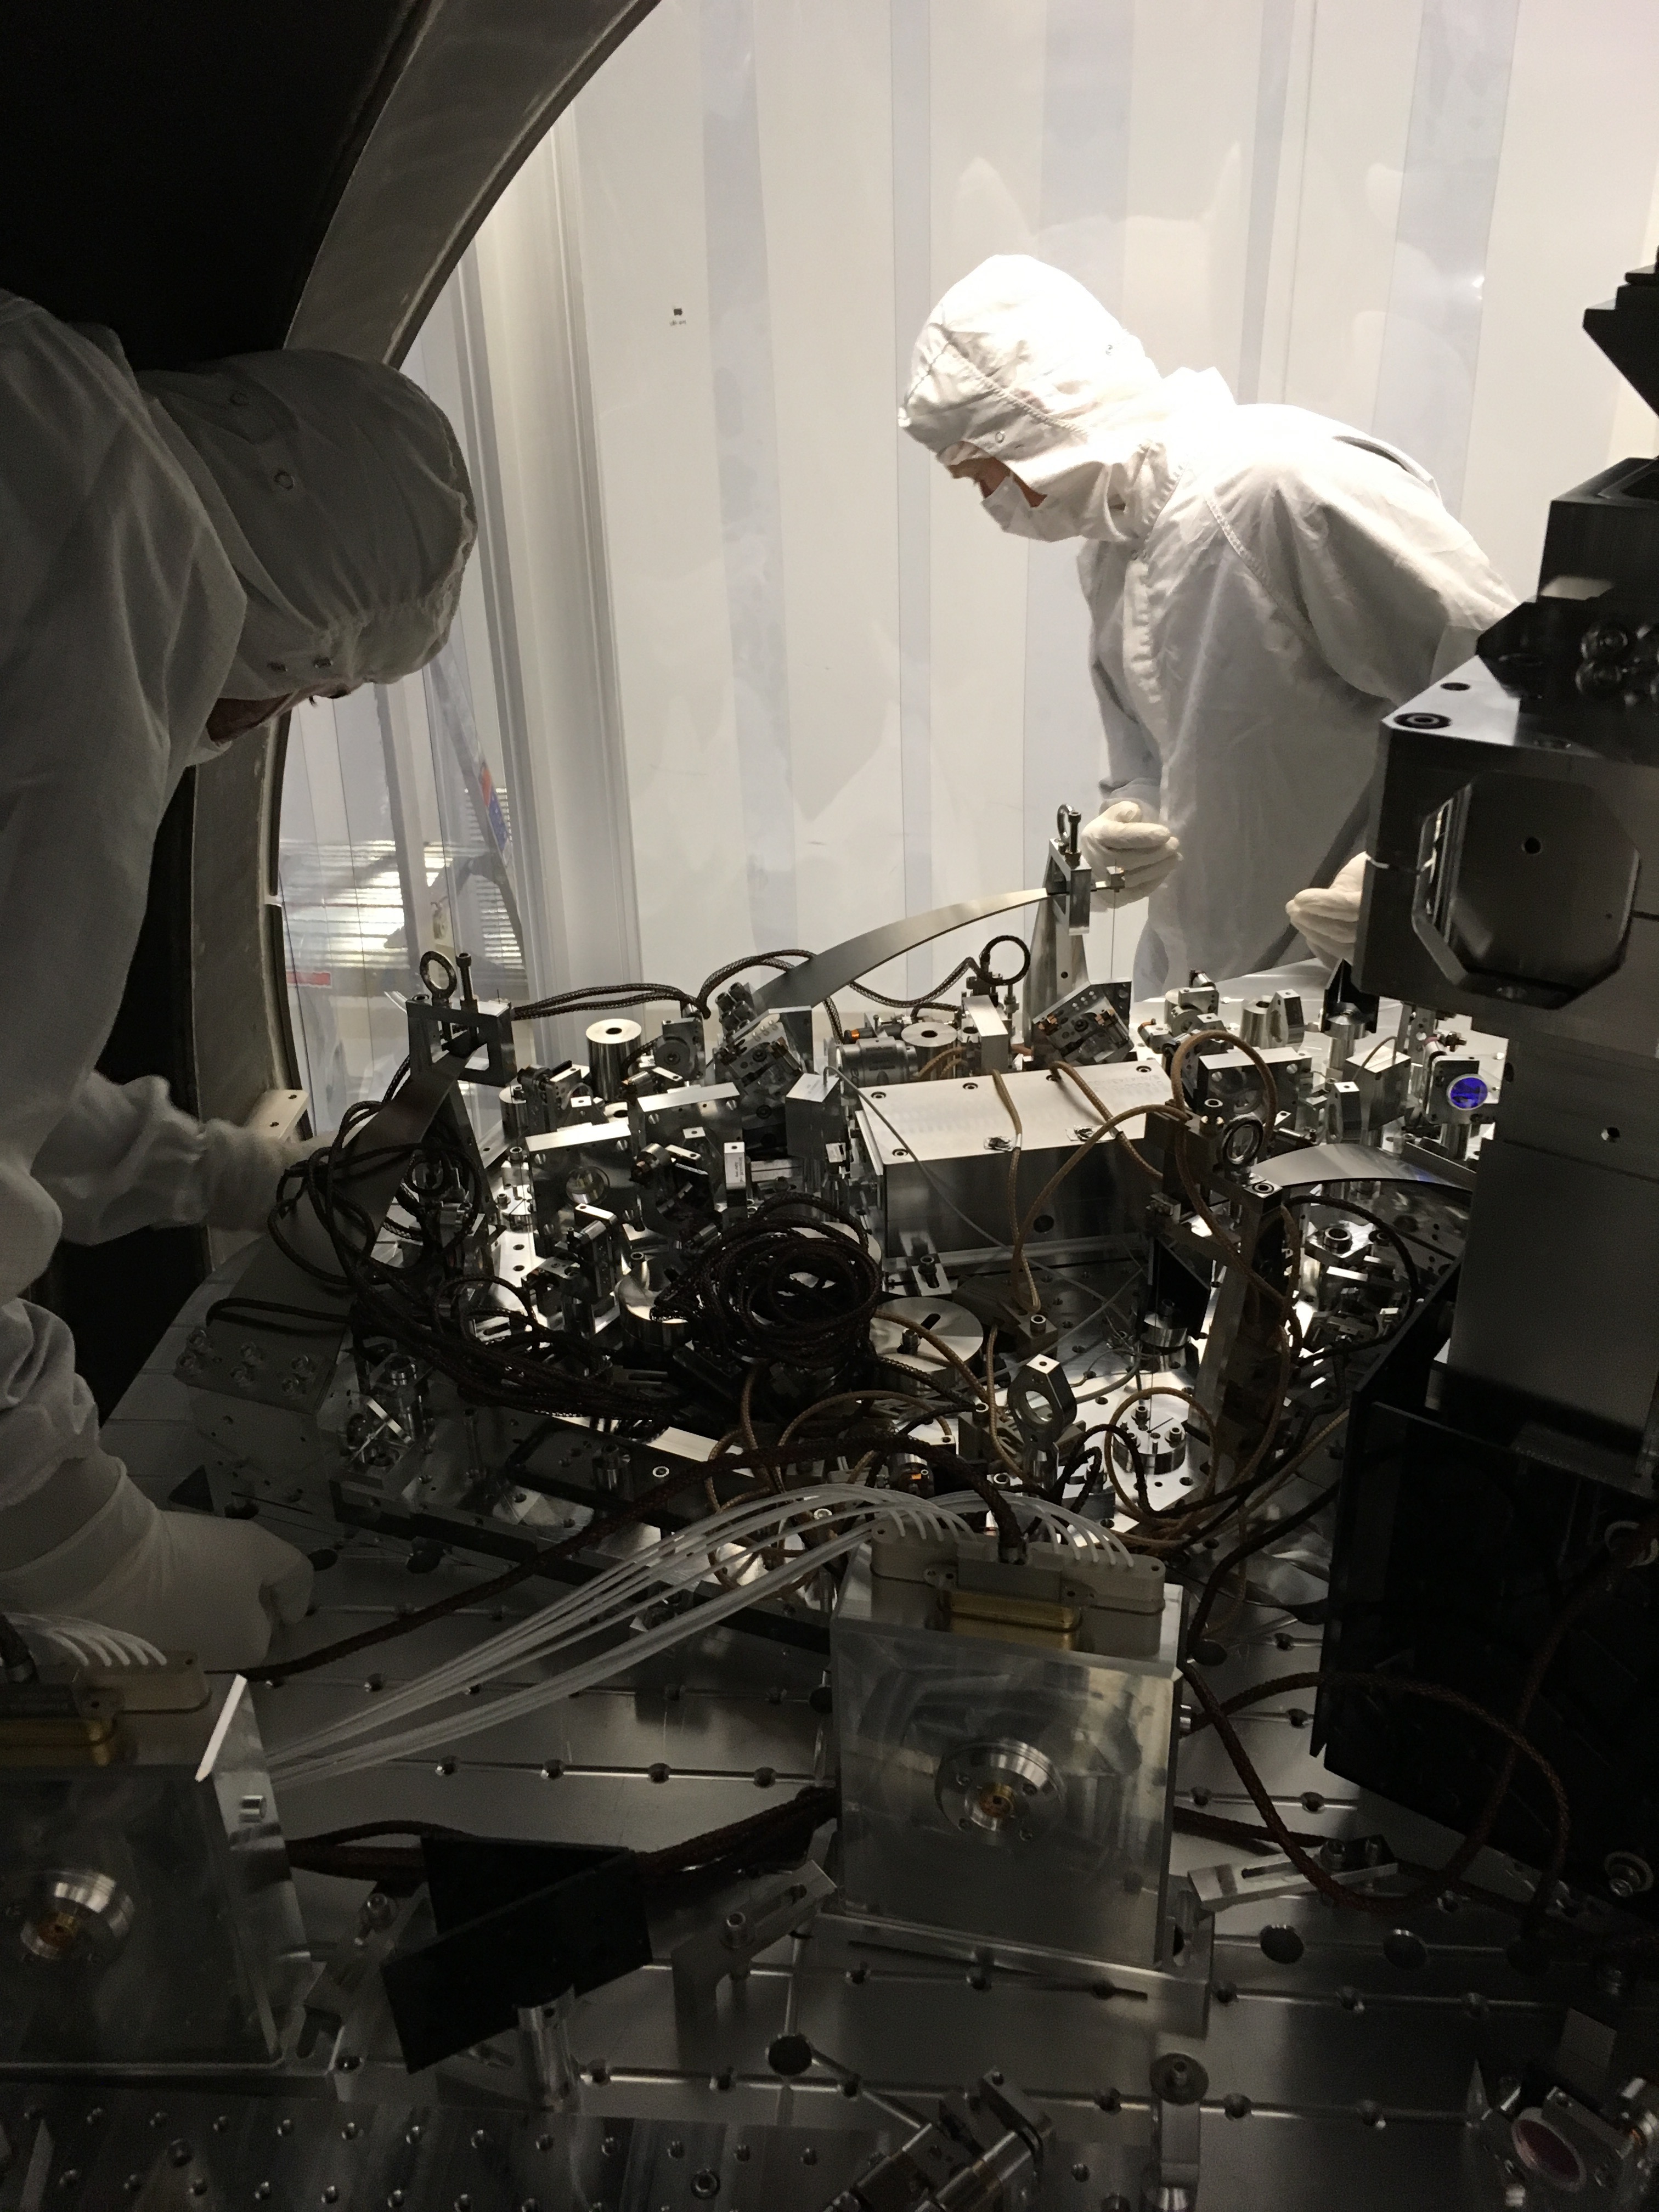
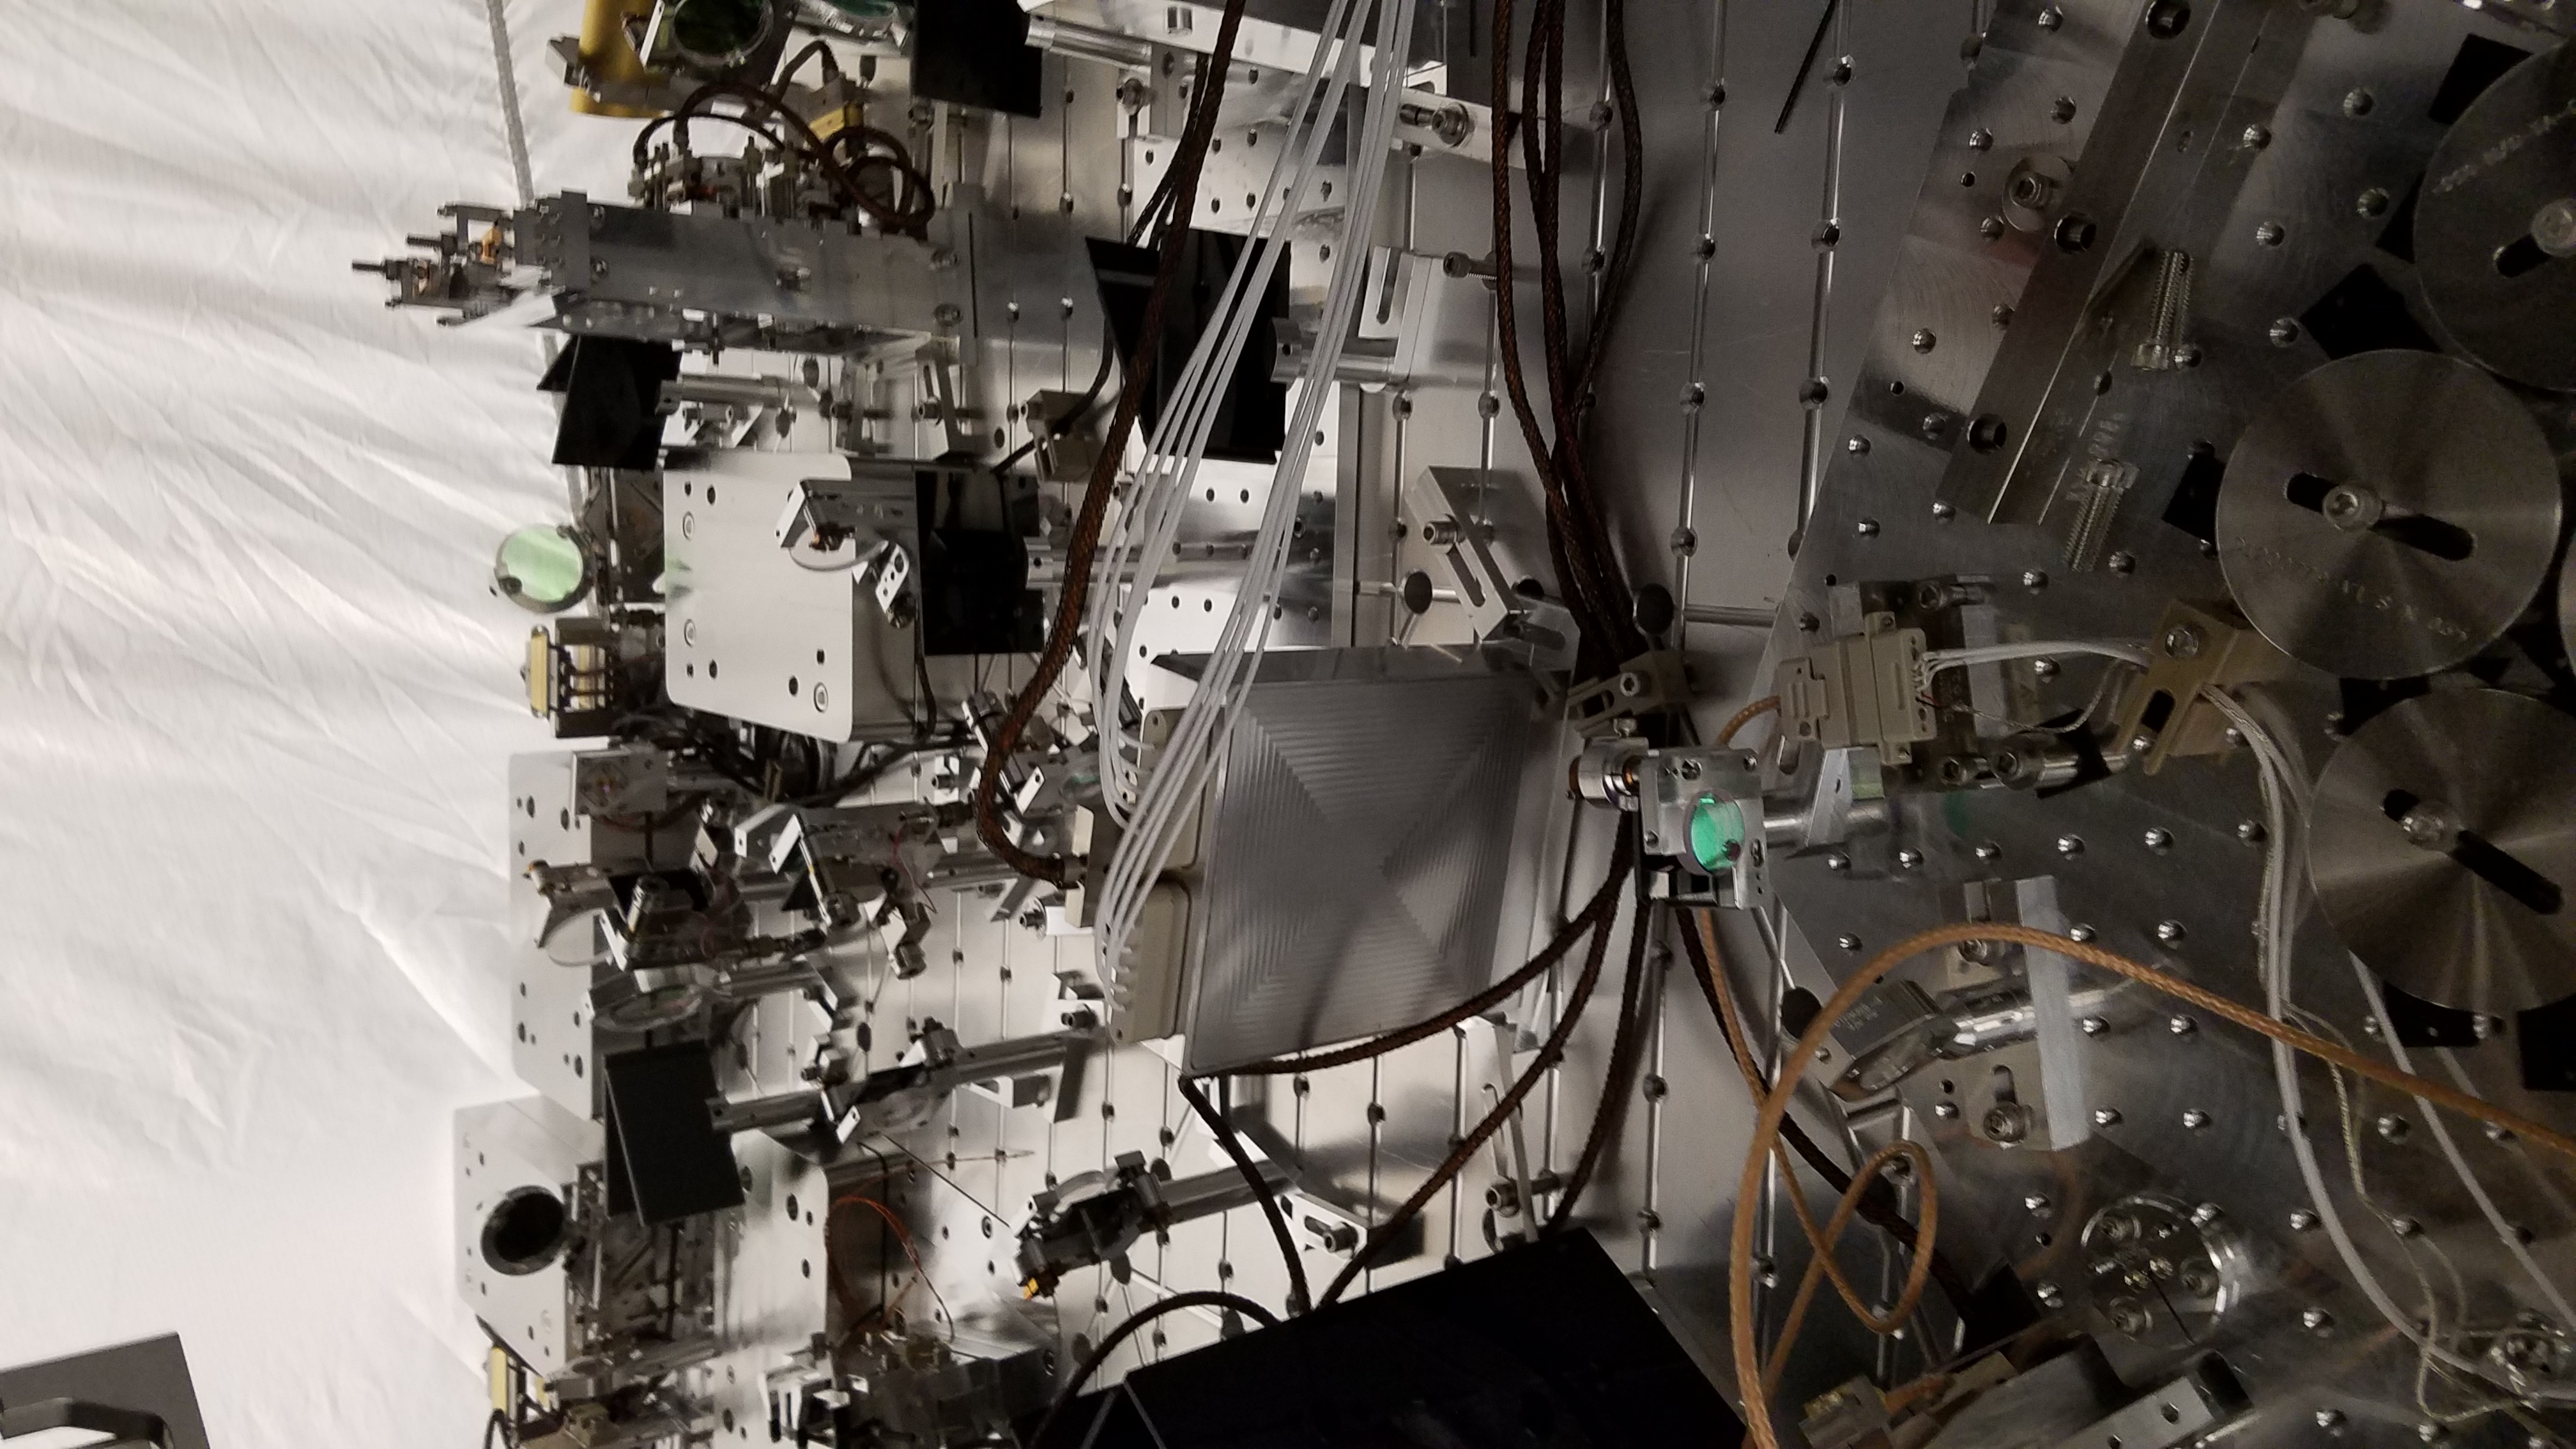
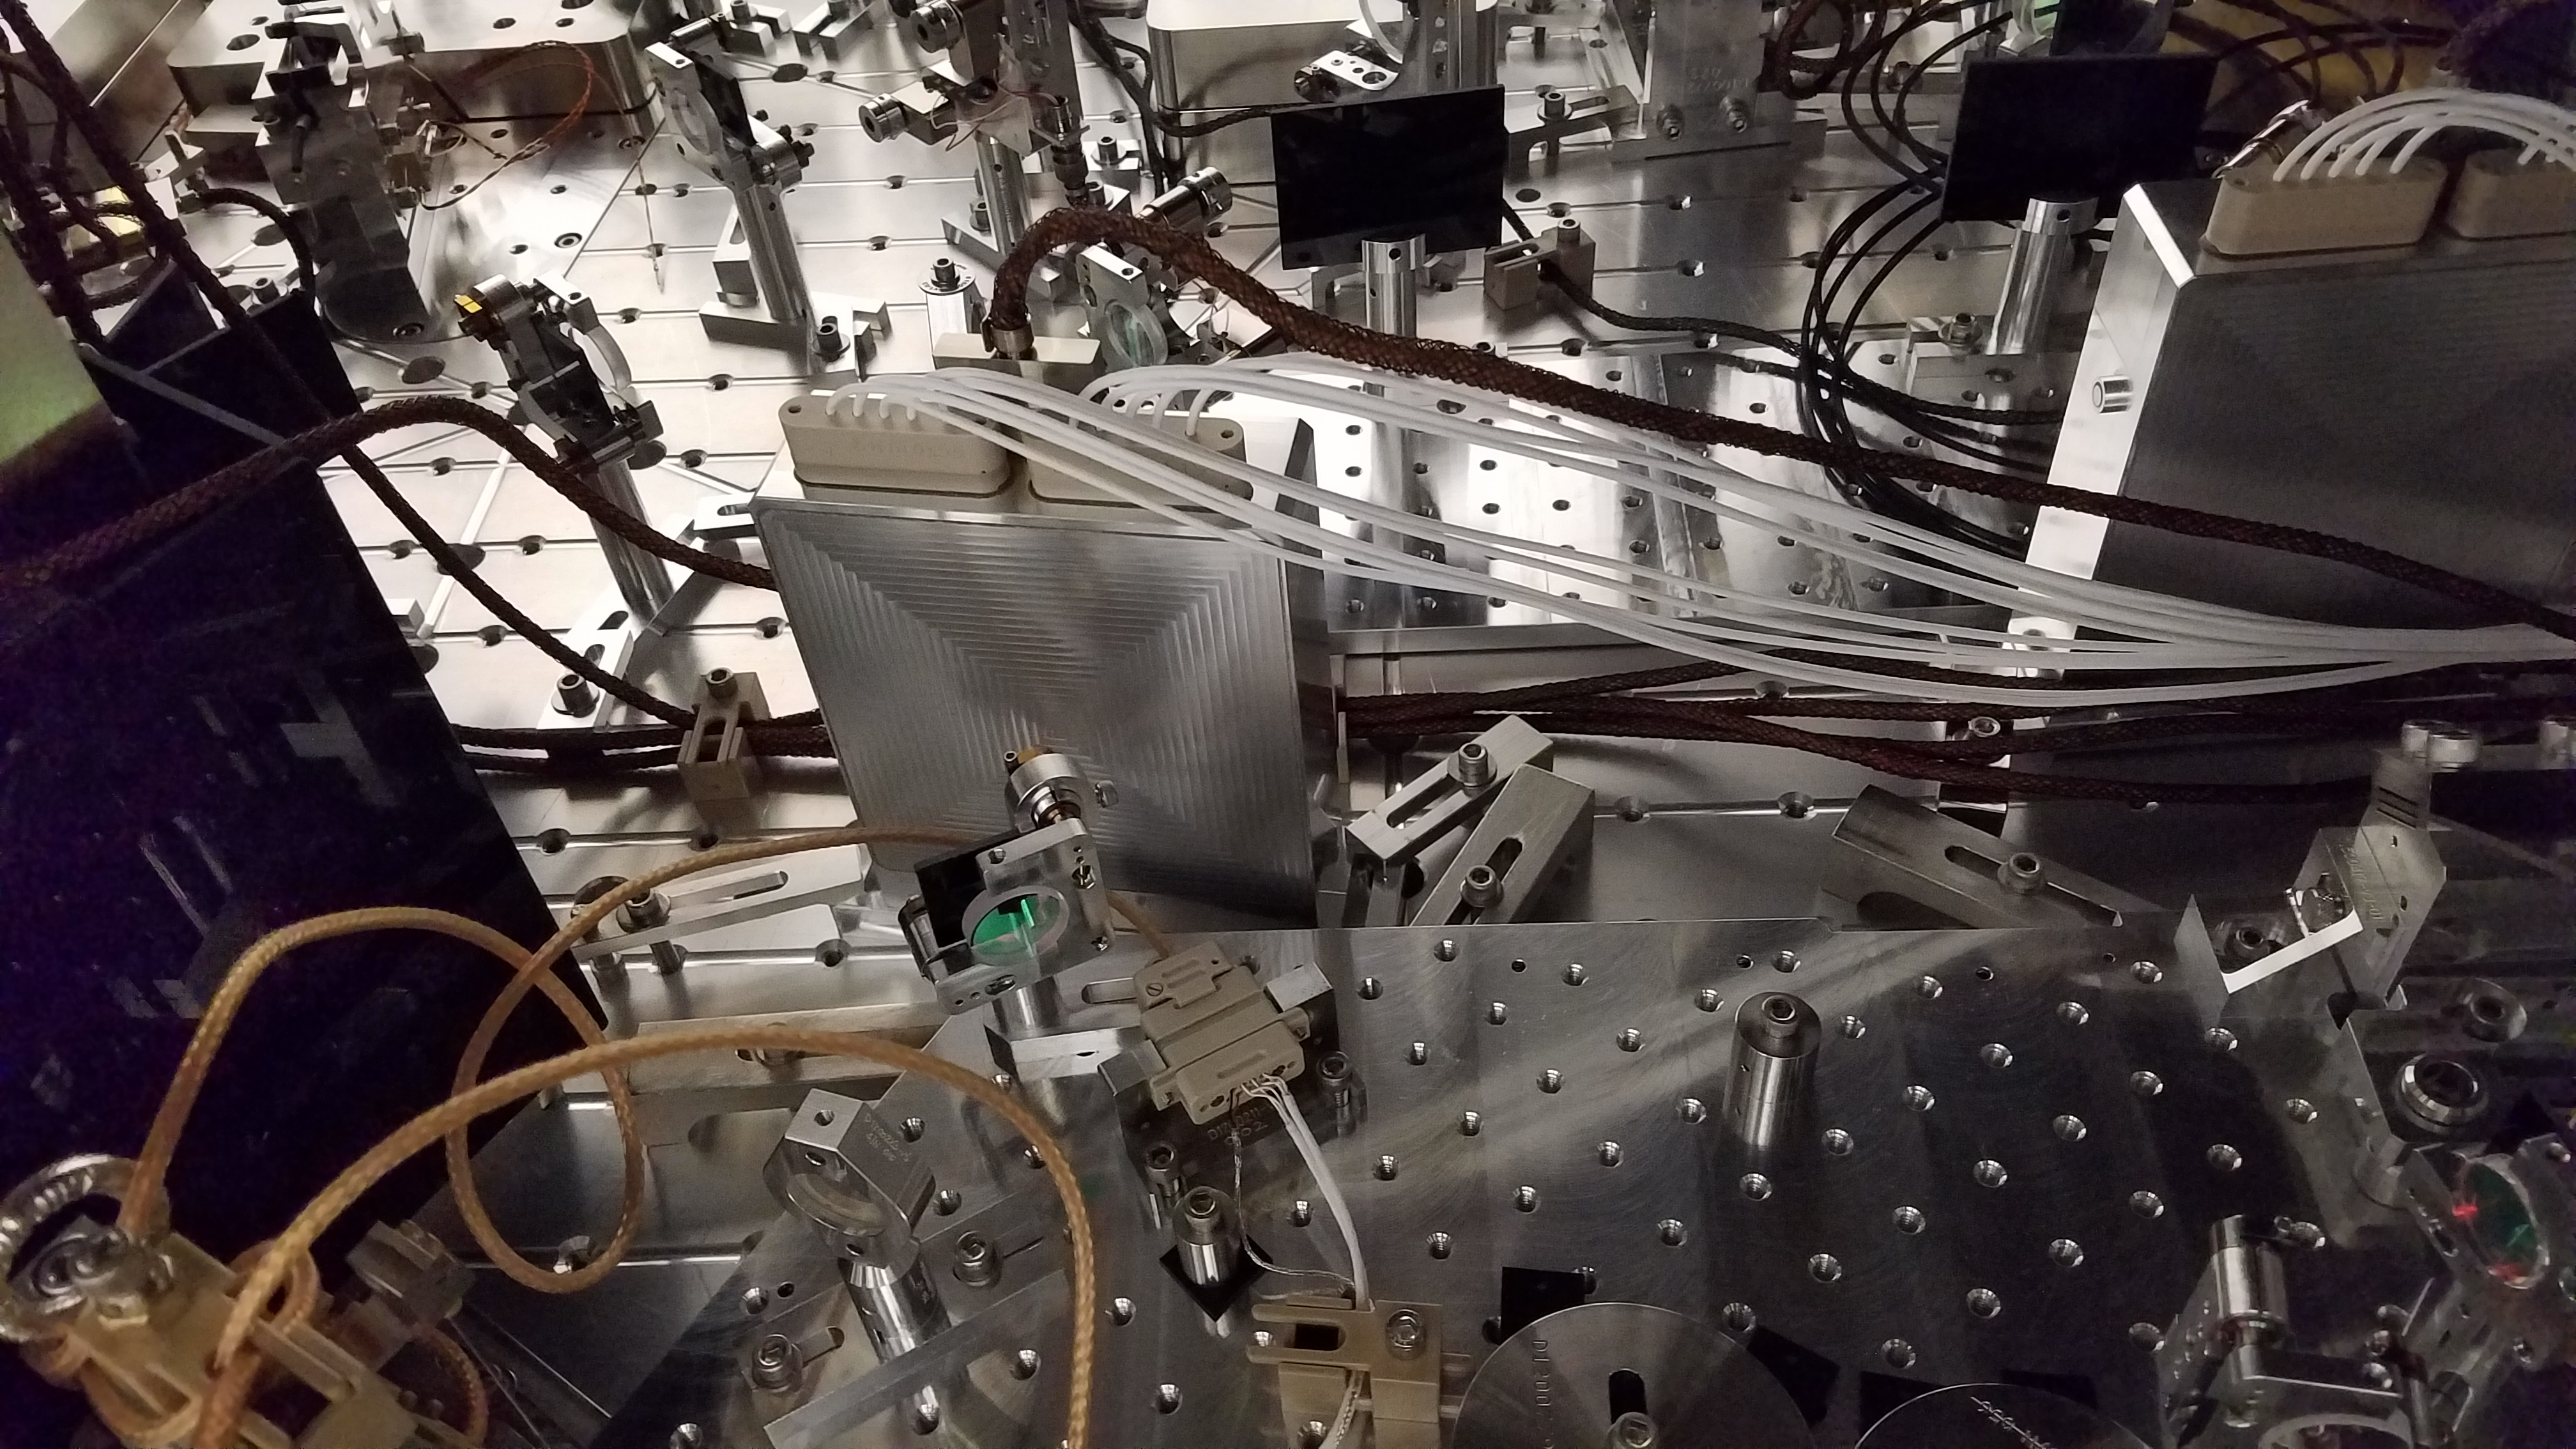
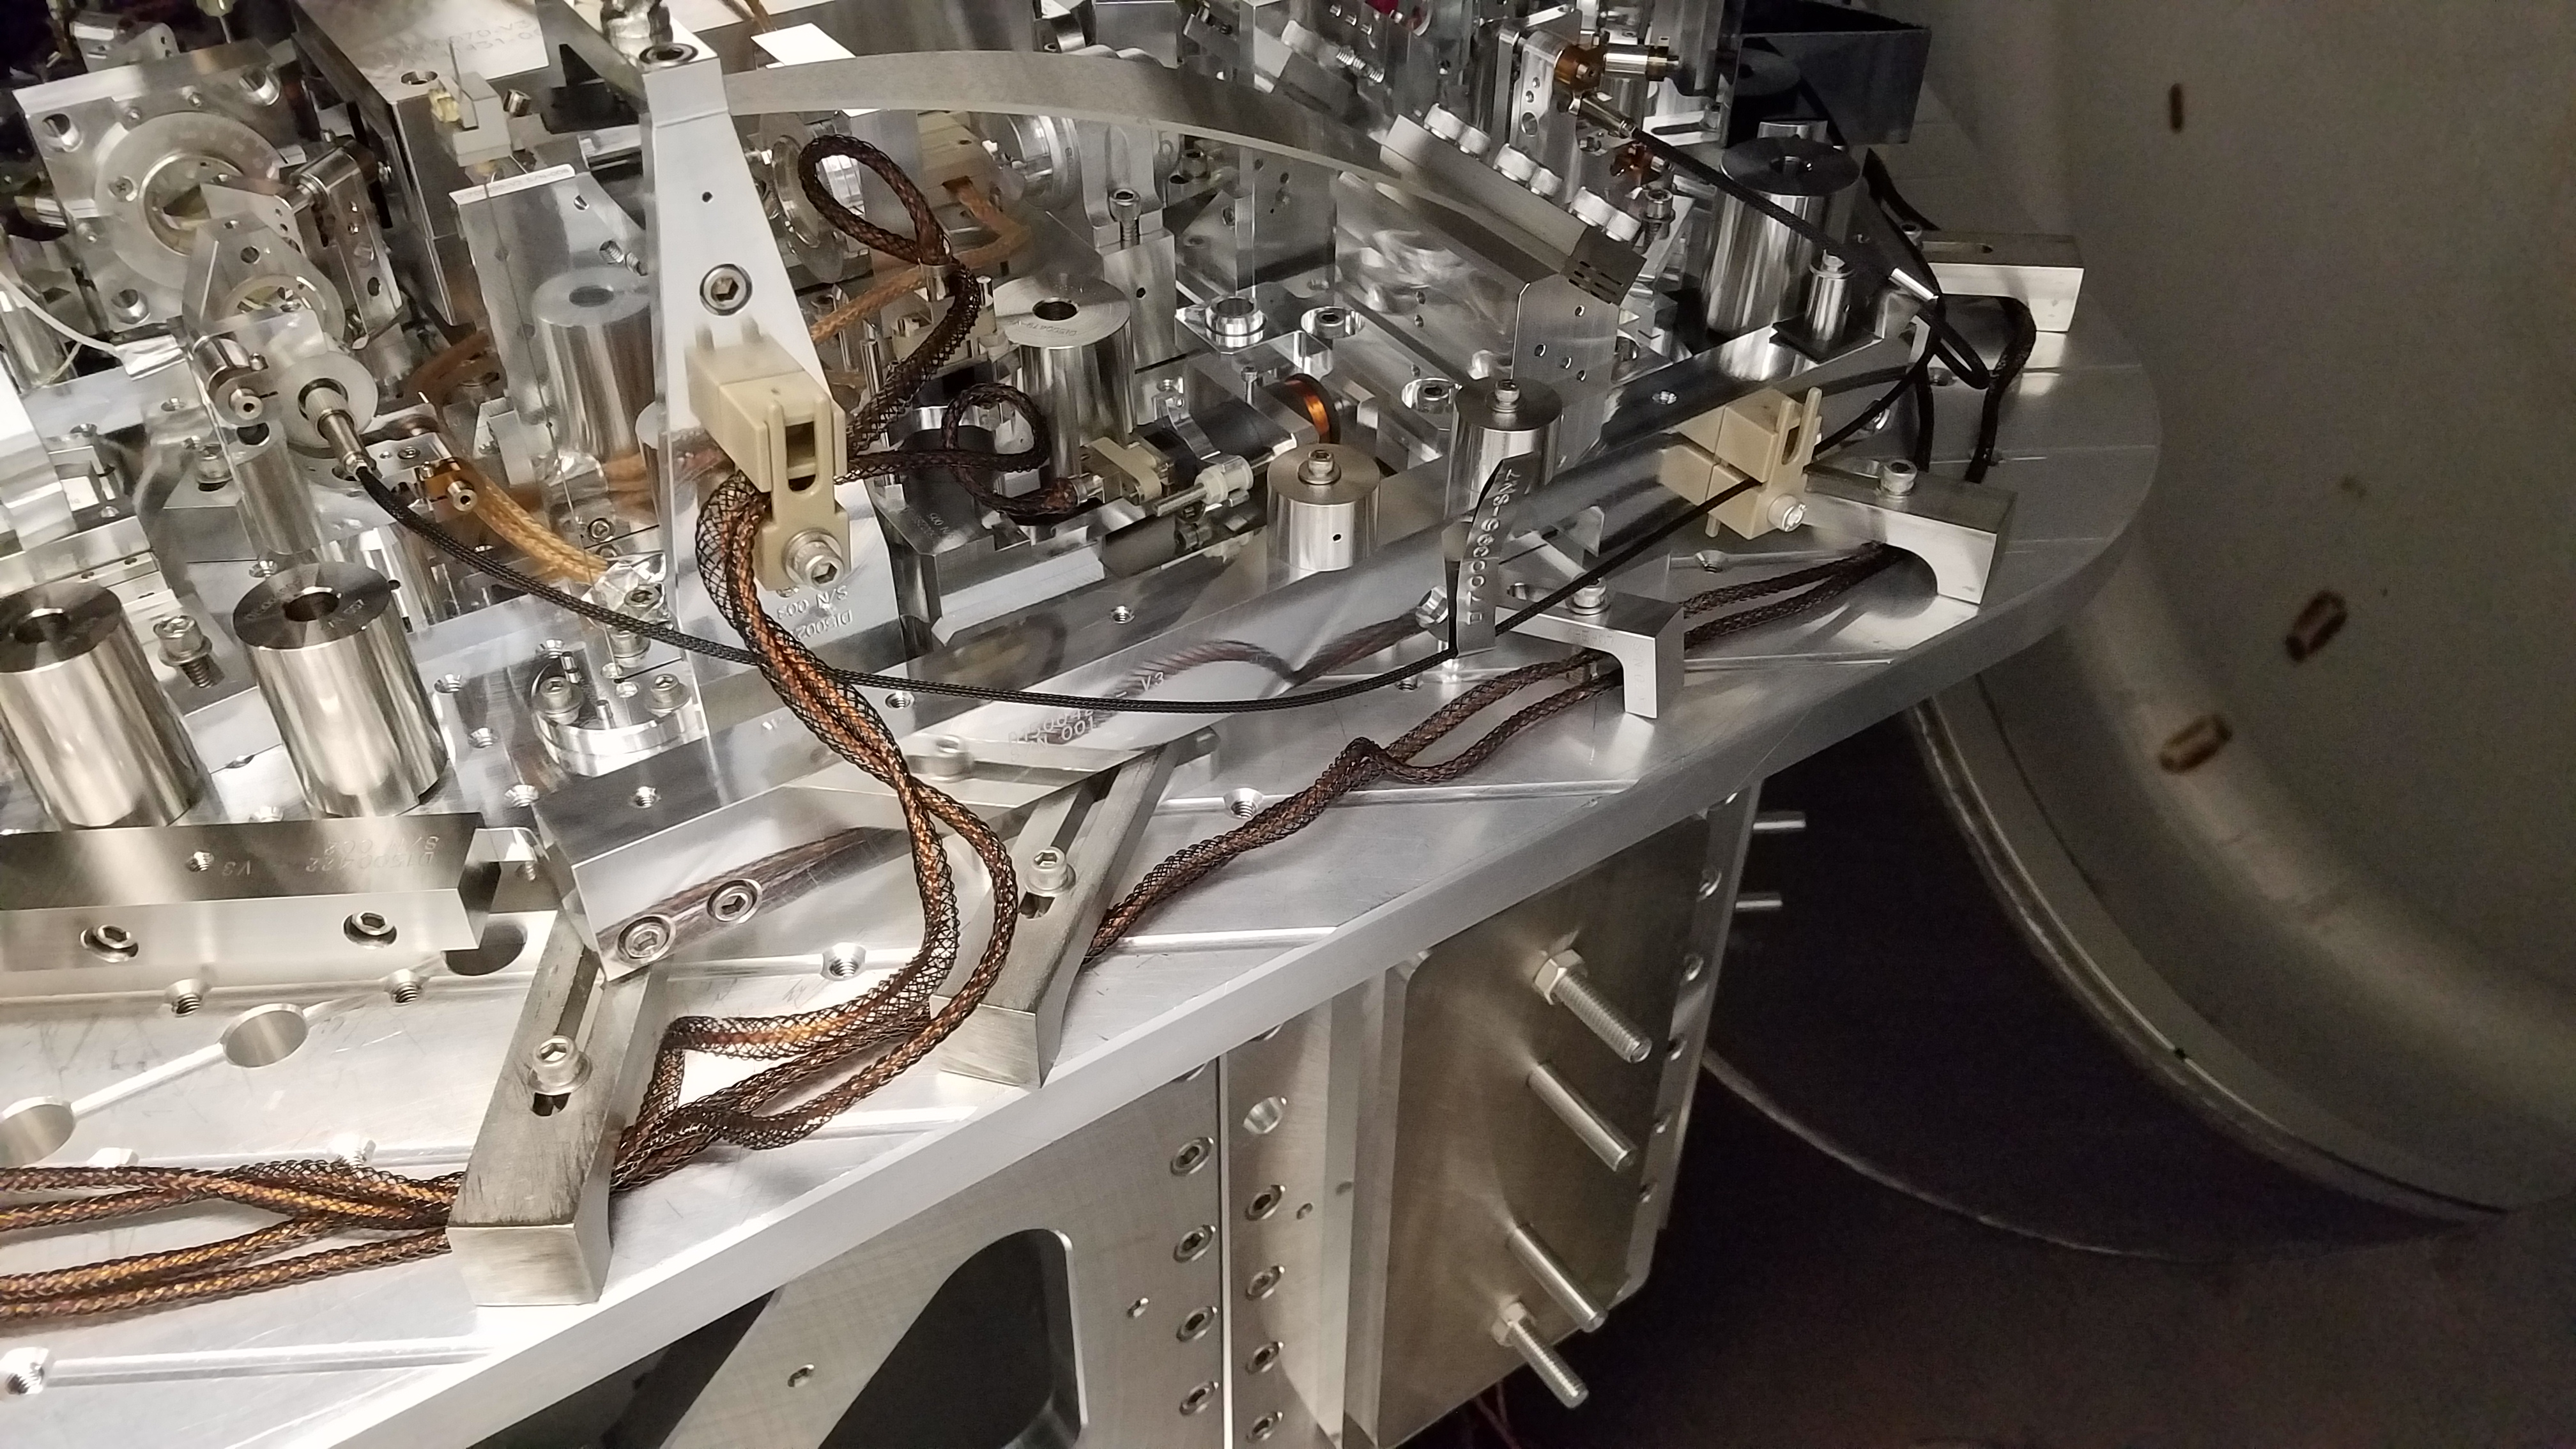
19:24 (11:24) Bubba – Going into the LVEA for VOPO install
19:29 (11:29) Travis – Going to End-Y to get some equipment
19:40 (11:40) Travis – Back from End-Y
19:46 (11:46) Sheila – Going into the Squeezer Bay
19:52 (11:52) Filiberto – Back from Mid-Y
20:08 (12:08) Jason & Ed – Out of the PSL Enclosure
20:11 (12:11) Sheila – Out of the Squeezer Bay
20:33 (12:33) Monthly test of Hanford Emergency System
20:40 (12:40) Jeff K – Out of the LVEA
20:44 (12:44) Ken – Going into the LVEA to look for a latter
20:45 (12:45) Corey, TJ, Alvaro – Out of the LVEA
20:52 (12:52) Ken – Out of the LVEA
21:22 (13:22) Jason & Ed – Going back into the PSL Enclosure
21:27 (13:27) Lizabeth – Going to HAM6 to document chassis
21:28 (13:28) Filiberto – Going the End-X toy work on access system
21:34 (13:34) Hugh – Going into LVEA to get parts stages for tomorrow maintenance
21:43 (13:43) TJ & Alvaro – Going back to HAM6 for VOPO work
21:55 (13:55) Nutsinee – Going to Squeezer Bay
21:59 (13:59) Lizabeth – Out of the LVEA
22:10 (14:10) Travis – Going to End-Y for PCal
22:15 (14:15) Richard – Going to End-X
22:15 (14:15) Hugh – Out of the LVEA
22:21 (14:21) Sheila – Going to Squeezer Bay
22:26 (14:26) Jeff K. – Going to HAM6 for VOPO install
22:31 (14:31) Sheila – Out of the LVEA
22:37 (14:37) Travis – Back from End-Y
22:41 (14:41) Betsy – Going to End-Y
23:01 (15:01) Hugh – Going into the LVEA
23:21 (15:21) Hugh – Out of the LVEA
23:30 (15:30) Georgia – Going to End-Y
23:30 (15:30) Sheila – Going to HAM5/6 area and into the Optics Lab
23:34 (15:34) Betsy & Travis – Going to End-Y
00:00 (16:00) End of Shift