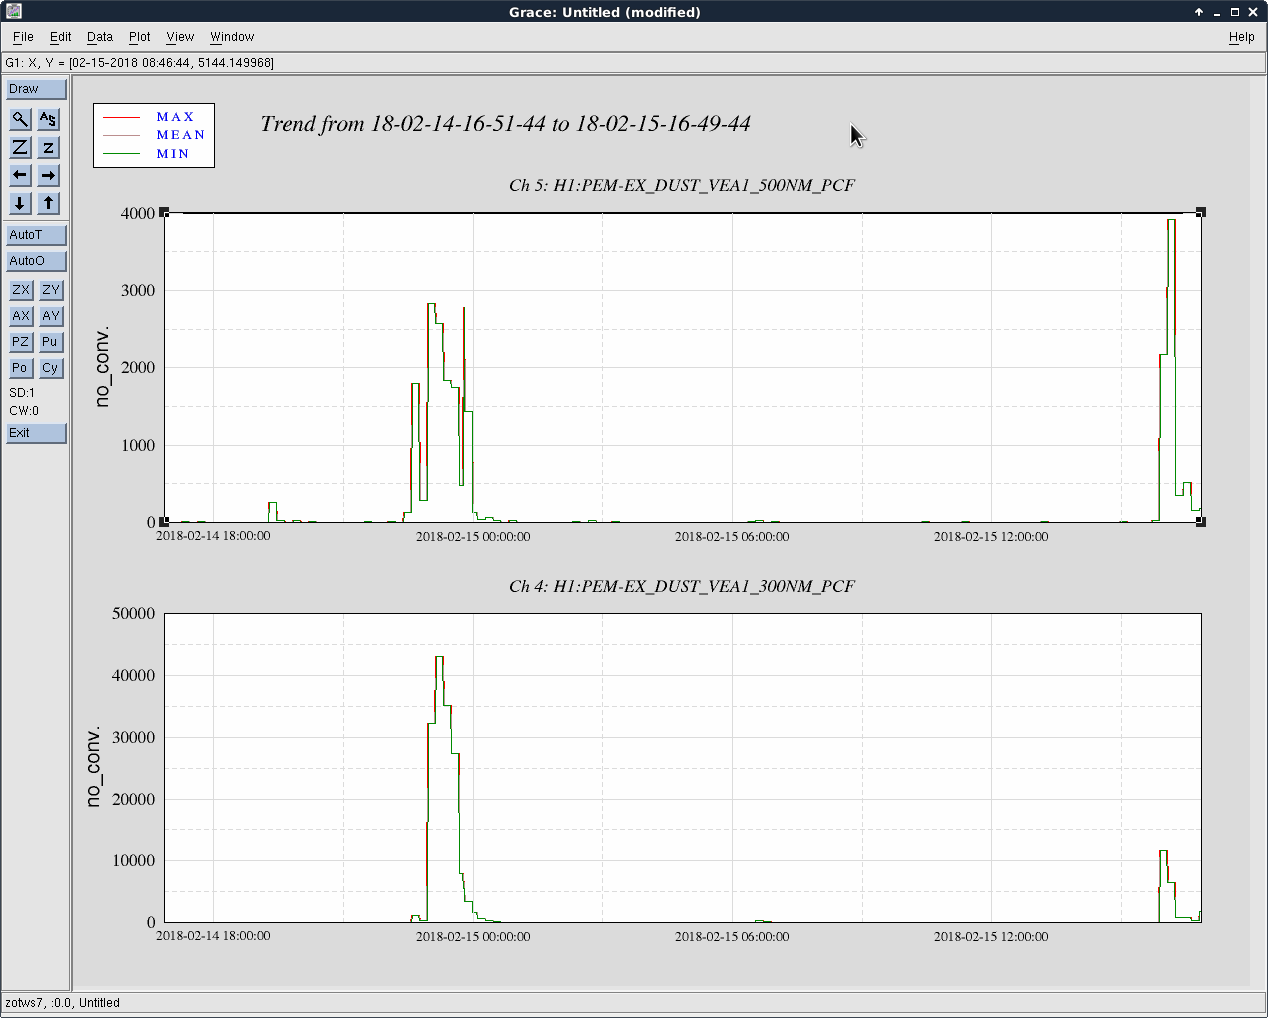
The range dropped down to ~60Mpc for a few hours but seems to be back up. the 4.7k mode is high right now, but it is not growing. I am waiting for LLO to drop before I damp it.
TITLE: 04/22 Day Shift: 15:00-23:00 UTC (08:00-16:00 PST), all times posted in UTC
STATE of H1: Observing at 64Mpc
OUTGOING OPERATOR: Travis
CURRENT ENVIRONMENT:
Wind: 19mph Gusts, 11mph 5min avg
Primary useism: 0.07 μm/s
Secondary useism: 0.15 μm/s
QUICK SUMMARY: Seems like a calm Saturday so far.
TITLE: 04/22 Owl Shift: 07:00-15:00 UTC (00:00-08:00 PST), all times posted in UTC
STATE of H1: Observing at 62Mpc
INCOMING OPERATOR: TJ
SHIFT SUMMARY: One lockloss of unknown cause early in the shift. No issues relocking or otherwise.
LOG: See previous aLogs.
No readily apparent cause.
TITLE: 04/22 Owl Shift: 07:00-15:00 UTC (00:00-08:00 PST), all times posted in UTC
STATE of H1: Observing at 60Mpc
OUTGOING OPERATOR: Jeff
CURRENT ENVIRONMENT:
Wind: 5mph Gusts, 3mph 5min avg
Primary useism: 0.01 μm/s
Secondary useism: 0.14 μm/s
QUICK SUMMARY: No issues handed off. Lock is 5.5 hours old.
Shift Summary: Run A2L check script. Pitch and Yaw are both under the reference. Lost lock – reason unknown; at the time the range was moving around a bit. Relocked with no problems. Accepted SDF Diff with ETMY_L2_DAMP_MODE10_GAIN and back to Observing. Had to damp PI Mode-27 and Mode-28 a couple of times.
Ran A2L check – after relock, Yaw is slightly elevated, Pitch is good.
Locked in Observing for 5.25 hours. After the earlier lockloss, the remaining shift was quiet with no apparent problems. A2L remains at or below the reference.
After relocking the IFO has been behaving. The environmental and seismic conditions are benign. Range has improved (now at 62.3 Mpc) and is steady. Before the lockloss the range was in the mid to upper 50s and moving around. A2L Pitch is below the reference, YAW is elevated to 0.6.
After relocking, accepted the SDF Diff for ETMY_L2_DAMP_Mde10_GAIN. The SP was 0.0 the Epics was 0.02. Back to Observing.
Analyzing the time period where we disconnected an ethernet adapter for the EY illuminator (see aLOG 35640) shows that this doesn't impact the lines observed in the VEA magnetometer between 20 Hz and 120 Hz. I attach normalized spectrograms the the magnetometer data, and we do not see any indication of lines increasing or decreasing around the time period that we disconnected the adapter. The time it would have impacted would be 30 - 34 minutes in these spectrograms. So it appears this ethernet adapter isn't too bad, at least from this short test. Keep hunting lines...
[Heather Fong, Sheila Dwyer]
Over the last few months, Sheila and I have been trying to find correlations between auxiliary channels and LHO's sensitivity range. In order to do so, we first made changes to the OAF BLRMS range channels by adding notch filters such that they can track changes to the SENSMON range (see alog 33437). After we made these changes, the summed OAF BLRMS range contributions now have a linear relationship with the SENSMON range, with their units roughly calibrated to be Mpc.
I then wrote a Python script that does the following:
- Loads in desired auxiliary channel data (using NDS and GWpy) for a specified period of time (we analyze minute trends)
- Calculates the Pearson correlation coefficient (PCC) between auxiliary channels and the OAF BLRMS range channels in order to determine how linearly correlated the channels are
- Plots and saves the channels with the highest PCC (aux channels vs. OAF BLRMS range and aux channels vs. time)
Attached to this entry are examples of the aux channels vs. OAF BLRMS range for the time period of Feb 24 2017 to Apr 10 2017 (45 days, H1 observing mode only). The complete list of channels that were analyzed are attached under the file name 'BLRMS_channel_list.txt'. With the exception of the OAF channels, both mean and RMS channels were analyzed. For ~360 channels over a time range of 45 days, this script takes ~2 hours to complete, where the data retrieval from NDS is the bottleneck. The Python script has been uploaded to the LIGO git repository and can be found here:
git clone https://heather-fong@git.ligo.org/heather-fong/BLRMS-channels-correlations.git
where BLRMS_channels_analysis.py is the Python script, and BLRMS_channel_list.txt is an example of channels that can be analyzed.
We found the channels with the highest absolute PCC values (and are therefore most correlated with the range) to be the following (plots are attached):
H1:ASC_AS_B_RF36_Q_PIT_OUT16
H1:ASC-AS-B-RF36_Q_YAW_OUT16
H1:SUS-ITMY_R0_DAMP_Y_INMON
Other channels we analyzed that appear to be correlated with the range include:
H1:SUS-ITMX_M0_DAMP_R_INMON (max PCC = -0.5 for 38-60Hz range)
H1:SUS-ITMY_R0_DAMP_L_INMON (max PCC = 0.5 for 38.60 Hz range)
The results of this analysis gives us hints as to which parts of the interferometer are affecting the sensitivity range. In particular, the results suggest that there are problems with the ITMY reaction mass that are not seen in the ITMX reaction mass, and we can, for example, try putting different offsets in ITMY to confirm this.
During the commissioning window this morning I tried moving ITMY reaction mass in yaw so that the DAMP Y INMON moved from about -75 to -86 several times, so see if there is any noticable difference in the DARM spectrum. I didn't see anything changing in the spectrum. Attached is a time series of the yaw osem and the DARM BLRMS.
TITLE: 04/21 Day Shift: 15:00-23:00 UTC (08:00-16:00 PST), all times posted in UTC
STATE of H1: Observing at 60Mpc
INCOMING OPERATOR: Jeff
SHIFT SUMMARY: Observed the entire shift. No issue to report.
LOG:
15:05 Karen to optics lab
15:22 Christina to MX
15:25 Karen driving to retrieve vacuum from receiving, then to MY
16:12 Karen leaving MY to VPW
16:18 Christina leaving MX
16:51 Karen out of VPW
18:07 Marc to MY
18:34 Karen to H2 electronics
18:39 Marc back
18:58 Karen driving to mechanical area
21:19 Gerado to all the chiller yards. MX, EX, MY, EY
Starting CP3 fill. LLCV enabled. LLCV set to manual control. LLCV set to 50% open. Fill completed in 47 seconds. TC B did not register fill. LLCV set back to 22.0% open. Starting CP4 fill. LLCV enabled. LLCV set to manual control. LLCV set to 70% open. Fill completed in 286 seconds. LLCV set back to 40.0% open.
TITLE: 04/21 Owl Shift: 07:00-15:00 UTC (00:00-08:00 PST), all times posted in UTC
STATE of H1: Observing at 62Mpc
INCOMING OPERATOR: Nutsinee
SHIFT SUMMARY: No issues other than the EY CRC error. OPS Teamspeak computer was rebooted and will need a password I don't have to reconnect to wifi. Lock is currently 18.5 hours of age.
LOG: See previous aLogs.
No issues other than the EY CRC error.
Verbal Alarms announced an "EY CRC Error" at 9:51 UTC. Following Dave's instructions, I successfully restarted the HofT calibration code. GWIstat is now reporting that LHO is green and "OK+Intent", where before it was yellow and "HofT Bad". The DMT SPI page never showed an issue with the calibration (it was always green). I'll check the Detchar summary page when it refreshes to make sure it has greened up.
Travis, Greg, Dave:
Many thanks to Travis for getting all this running again in the early hours of this morning. The mx_stream of data coming from h1susey was interrupted for 23 data blocks (@16 blocks per second, 1.44 seconds) at 09:51 UTC 4/21 (02:51 PDT). The DAQ made all SUS EY channels invalid for this period. The DMT calibration code (because of a code bug) latched all H1 HofT data as being invalid from this point onwards until Travis restarted the code on h1dmt0 and h1dmt1. Greg has confirmed that these restarts caused no problems downstream. The attached Det-Char summary plot shows the HofT latching to invalid (RED 'Calibration' and 'Observing' with a GREEN 'Obs intent'), and then shows the problem being resolved soon after.
Sunday's event was at 03:07 PDT, this morning's at 02:51 PDT
Evan G., Robert S. Looking back at Keith R.'s aLOGs documenting a changes happening on March 14 (see 35146, 35274, and 35328), we found that one cause seems to be the shuttering of the OpLev lasers on March 14. Right around this time, 17:00 UTC on March 14 at EY and 16:07 UTC at EX, there is an increase in line activity. The correlated cause is Travis' visit to the end station to take images of the Pcal spot positions. The images are taken using the Pcal camera system and needs the OpLevs to be shuttered so that a clean image can be taken without the light contamination. We spoke with Travis and he explained that he disconnected the USB interface between the DSLR and the ethernet adapter, and used a laptop to directly take images. Around this time, the lines seem to get worse in the magnetometer channels (see, for example, the plots attached to Keith's aLOG 35328). After establishing this connection, we went to the end stations to turn off the ethernet adapters for the Pcal cameras (the cameras are blocked anyway, so this active connection is not needed). I made some magnetometer spectra before and after this change (see attached). This shows that a number of lines in the magnetometers are reduced or are now down in the noise. Hopefully this will mitigate some of the recent reports of combs in h(t). We also performed a short test turning off another ethernet adapter for the H1 illuminator and PD. This was turned off at 20:05:16 18/04/2014 UTC and turned back on at 20:09:56 UTC. I'll post another aLOG with this investigation as well.
Good work! That did a lot of good in DARM. Attached are spectra in which many narrow lines went away or were reduced (comparing 22 hours of FScan SFTs before the change (Apr 18) with 10 hours of SFTs after the change (Apr 19). We will need to collect much more data to verify that all of the degradation that began March 14 has been mitigated, but this first look is very promising - many thanks! Fig 1: 20-50 Hz Fig 2: 50-100 Hz Fig 3: 100-200 Hz
Attached are post-change spectra using another 15 hours of FScan SFTs since yesterday. Things continue to look good. Fig 1: 20-50 Hz Fig 2: 50-100 Hz Fig 3: 100-200 Hz
Correction: the date is 18/04/2017 UTC.
Another follow-up with more statistics. The mitigation from turning off the ethernet adapter continues to be confirmed with greater certainty. Figures 1-3 show spectra from pre-March 14 (1210 hours), a sample of post-March 14 data (242 hours) and post-April 18 (157 hours) for 20-50 Hz, 50-100 Hz and 100-200 Hz. With enough post-April 18 statistics, one can also look more closely at the difference between pre-March 14 and and post-April 18. Figures 4-6 and 7-9 show such comparisons with different orderings and threrefore different overlays of the curves. It appears there are lines in the post-April 18 data that are stronger than in the pre-March 14 data and lines in the earlier data that are not present in the recent data. Most notably, 1-Hz combs with +0.25-Hz and 0.50-Hz offsets from integers have disappeared. Narrow low-frequency lines that are distinctly stronger in recent data include these frequencies: 21.4286 Hz 22.7882 Hz - splitting of 0.0468 Hz 27.4170 Hz 28.214 Hz 28.6100 Hz - PEM in O1 31.4127 Hz and 2nd harmonic at 62.8254 Hz 34.1840 Hz 34.909 Hz (absent in earlier data) 41.8833 Hz 43.409 Hz (absent in earlier data) 43.919 Hz 45.579 Hz 46.9496 Hz 47.6833 Hz 56.9730 Hz 57.5889 Hz 66.7502 Hz (part of 1 Hz comb in O1) 68.3677 Hz 79.763 Hz 83.315 Hz 83.335 Hz 85.7139 Hz 85.8298 Hz 88.8895 Hz 91.158 Hz 93.8995 Hz 95.995 Hz (absent in earlier data) 107.1182 Hz 114.000 Hz (absent in earlier data) Narrow low-frequency lines in the earlier data that no longer appear include these frequencies: 20.25 Hz - 50.25 Hz (1-Hz comb wiped out!) 24.50 Hz - 62.50 Hz (1-Hz comb wiped out!) 29.1957 Hz 29.969 Hz Note that I'm not claiming change points occurred for the above lines on March 14 (as I did for the original set of lines flagged) or on April 18. I'm merely noting a difference in average line strengths before March 14 vs after April 18. Change points could have occurred between March 14 and April 18, shortly before March 14 or shortly after April 18.
To pin down better when the two 1-Hz combs disappeared from DARM, I checked Ansel's handy-dandy comb tracker and found the answer immediately. The two attached figures (screen grabs) show the summed power in the teeth of those combs. The 0.5-Hz offset comb is elevated before March 14, jumps up after March 14 and drops down to normal after April 18. The 0.25-Hz offset comb is highly elevated before March 14, jumps way up after March 14 and drops down to normal after April 18. These plots raise the interesting question of what was done on April 18 that went beyond the mitigation of the problems triggered on March 14. Figure 1 - Strength of 1-Hz comb (0.5-Hz offset) vs time (March 14 is day 547 after 9/15/2014, April 18 is day 582) Figure 2 - Strength of 1-Hz comb (0.25-Hz offset) vs time
Observing 9:36 UTC.