Daniel, Sheila, Nutsinee
Nominal laser output power measured (with a PDA100A) as 18 mW through a 98% beam splitter (Rp 98%). Transimpedance=1500 Ohms, responsivity=.221A/W (variable gain setting on PDA100A set to 0dB).
Green output power measured (with a PDA100A) as 2 mW through 95% beam splitter (~100mW IR -> 40mW green). Transimpedance=1500 Ohms, responsivity=.313A/W (variable gain setting on PDA100A set to 0dB).
NewFocus 1611 detector to lock laser to PSL: Beat frequency signal measured with spectrum analyser ~ -14dBm at 155MHz as measured from the -1dB coupled output on the TTFSS pre-amp. Note there is a signal decrease by around 5dB with large (squeezing) laser frequency shifts (~500MHz or more) that seems to be due to beam pointing errors on the 1611 detector. However locking signal depends on phase and is largely insensitive to amplitude fluctuations so we should be ok. Responsivity=.75A/W, Transimpedance=-10k Ohm, gain setting 0, Voltage = -1.6V.
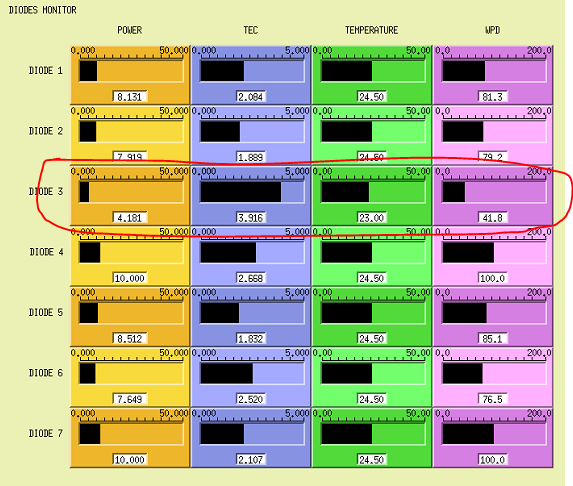
Power to 1611 detector: .30mW from PSL + .67mW from sqz laser -> .49mW on detector after 50/50 beam-splitter. MEDM screen reads .21mW ?? If the transimpedance is adjusted to -5k Ohm MEDM screen reads correct, but I suspect something is still odd about this.
Fibre (PSL) power rejected = 1.3 uW measured with a PD1A detector (2 K impedance).
Fibre (PSL) power launched = 27 uW measured with a PD1A detector from a 10% beam splitter. Disabled gain selection setting (alog 40161) has been corrected. Note the beamsplitter was changed from 2% transmission in the original drawing (BS8) to 10% transmission.