Not really too important for the IFO maybe but as a test/proof of concept, this DOF was addressed as it was easier.
After a few iterations of the HEPI Y to RZ IPSALIGN factor (H1:HPI-ETMX_IPSALIGN_3_2) the value that reduced the YAW seen on the Oplev YAW sufficiently was determined.
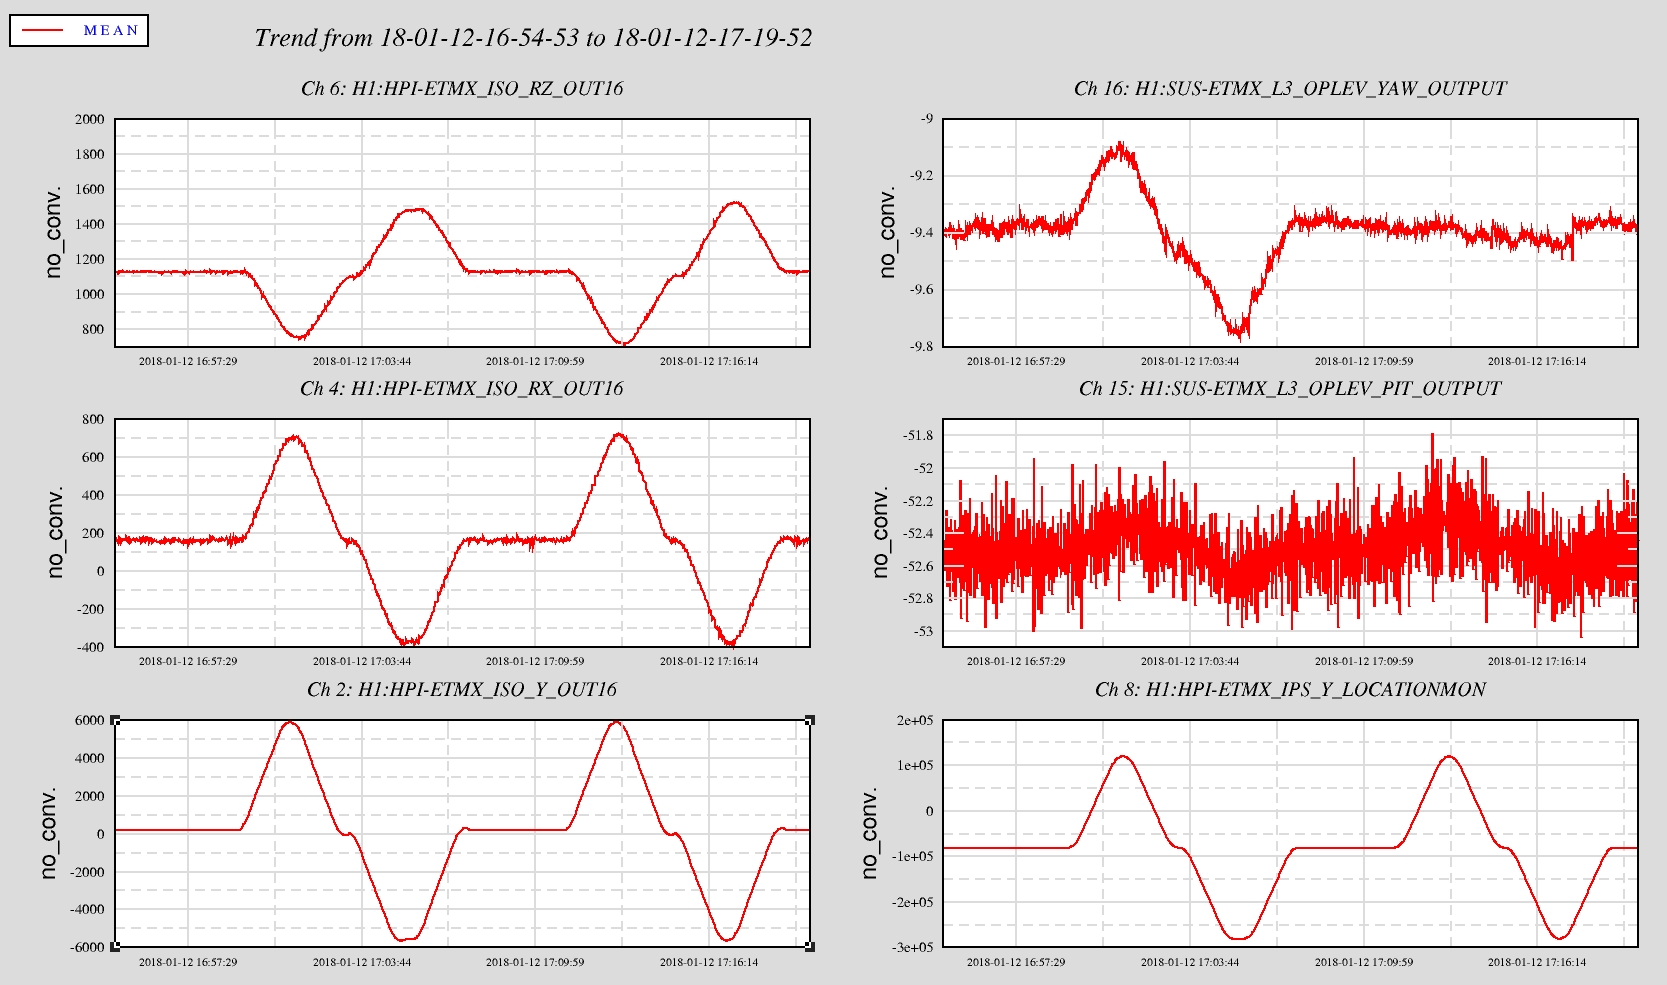
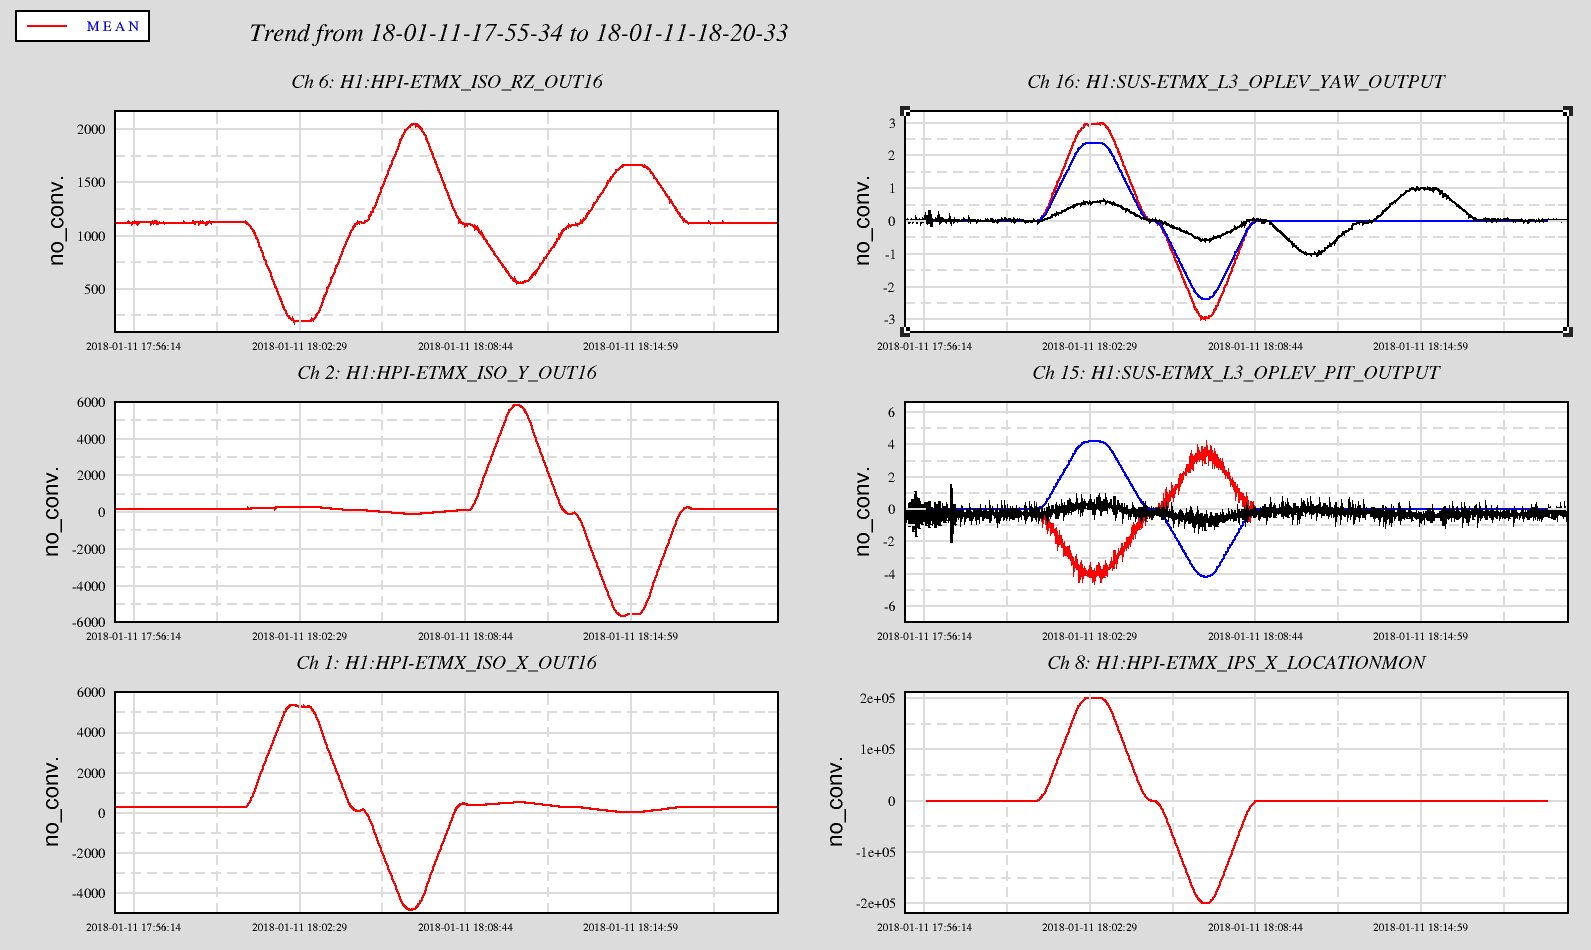
As I showed in 40106, driving the HEPI platform in X or Y produced Yaw seen on the optical lever. Including the Y to RZ factor above in the control scheme reduced the yaw seen on the optical lever about a factor of 10. The attached plot shows the same channels as in log 40106. As X is not being driven, there is no OpLev Length to Angle correction. This time period shows 2 measurement with different IPS_ALIGN factors: -0.007 & -0.0055. This was just to convince me that the process was effective. This really needs to be done for the in-line drive, ETMX X and ETMY Y drive. These effects are pretty small and the ASC has managed to deal with the YAW induced when a long lock stretch drive HEPI 100s of um. Still if the ASC doesn't have to deal with this, it should be a good thing.
Once I figure out how to a priori compute this with just a couple measurements, I'll do this for the in-line drive which will be a bit more involved given the OpLev Len2Ang correction. Notice too, the RX_OUT16 (middle left plot); I'll look at other sensors to see if the horizontal drive is actually producing real tilt. It may not be real unless our local sensors on HEPI are being fooled just like the YAW loop is as I showed in 40106.