chandra.romel@LIGO.ORG - posted 17:01, Thursday 28 December 2017 (39931)
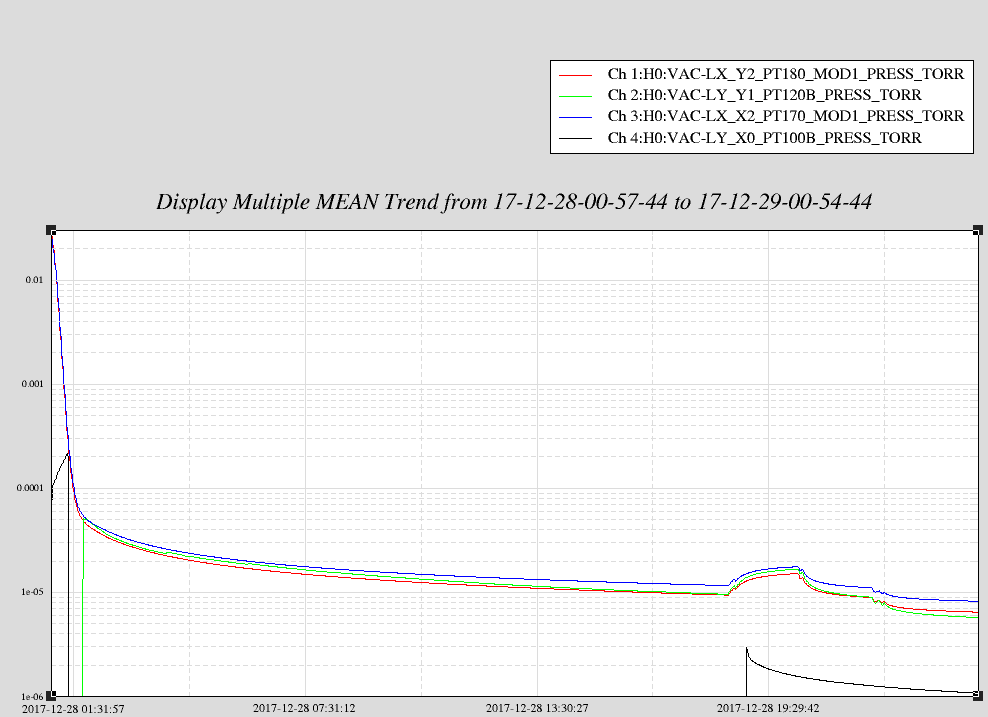
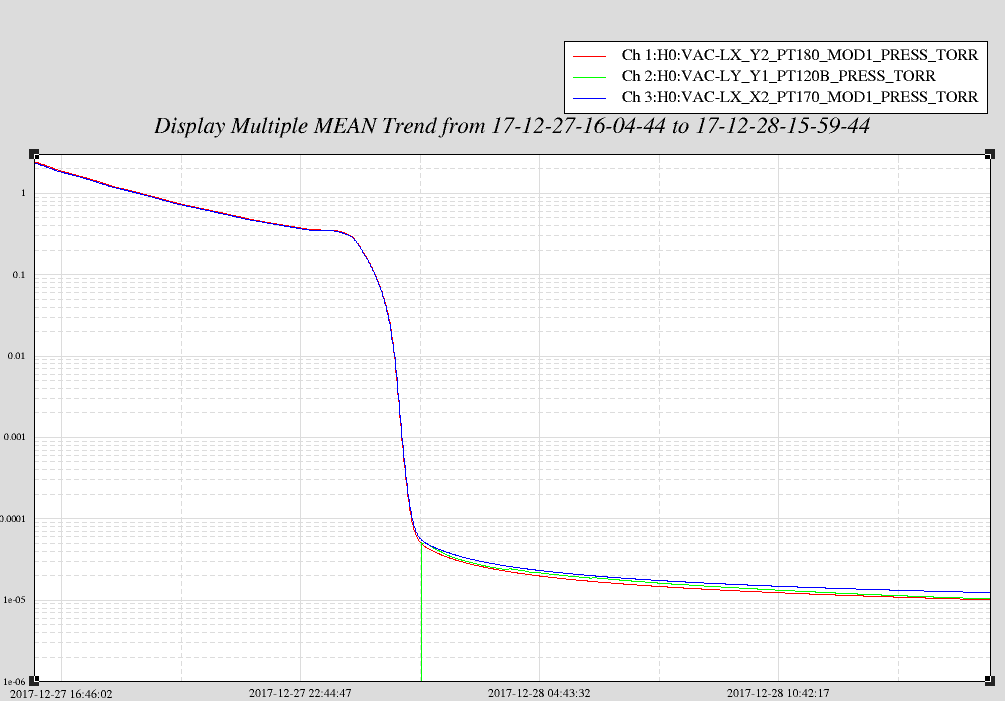
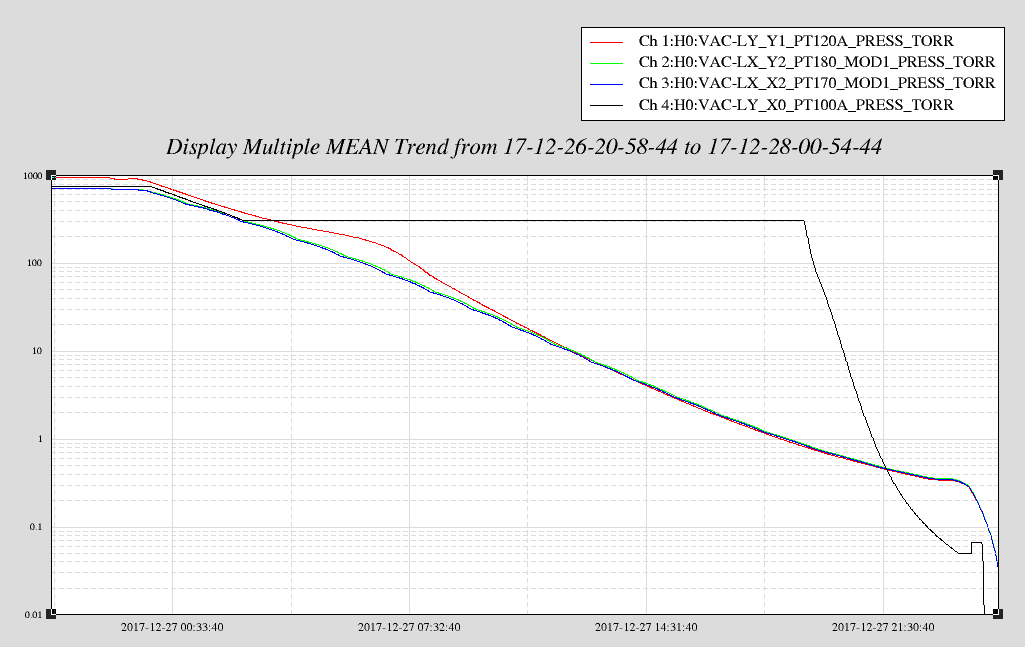
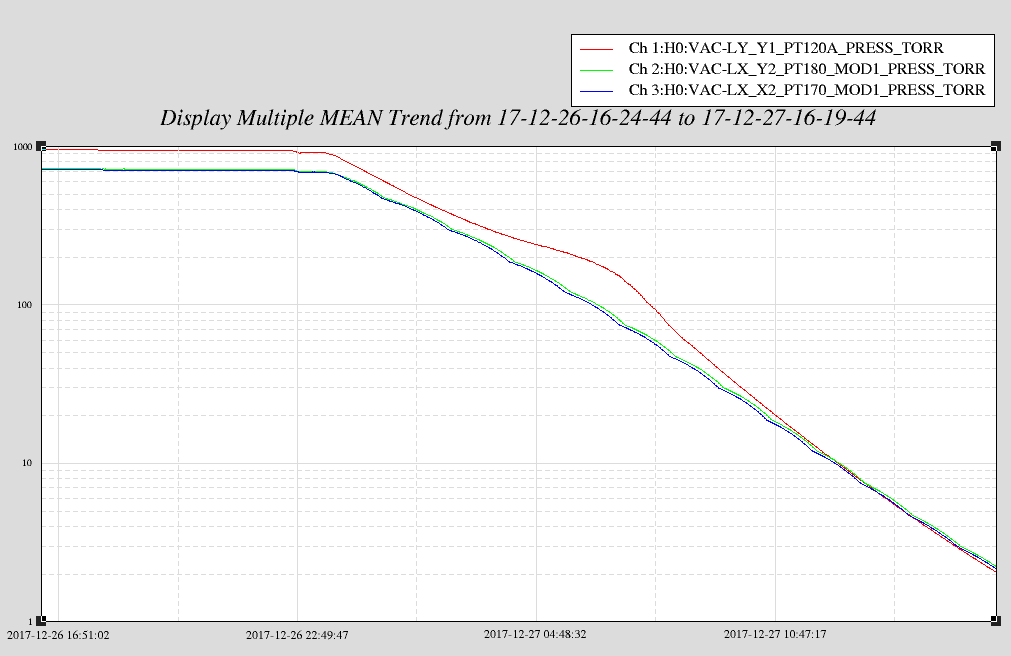
Day's summary
IP 1,2,3 are being pumped via aux carts (valved out now). IP4 valve dead space was pumped out with loaner "cube" cart. GV5 annulus is set up to pump next week.
HAM 1 is on turbo powered through safety GFCI in case of a power failure.
All three turbos are valved into main volume and backed by local scrolls. QDP80s are OFF; water valved out.
Attempted to start leak checking but leak detector was not budging below 1.1e-8 Torr-L/s background. Postponing till next week.
Mark & Tyler worked on TMDS tables.
Dick G. was onsite for a while in the EE lab.
John Deer tech was on site for a while working on big green machine.
Images attached to this report