cheryl.vorvick@LIGO.ORG - posted 19:12, Tuesday 07 November 2017 (39331)
IO activities for Tuesday, November 7th
Activities in IO Land:
- installed PRM and PR2 irises
- first real issue
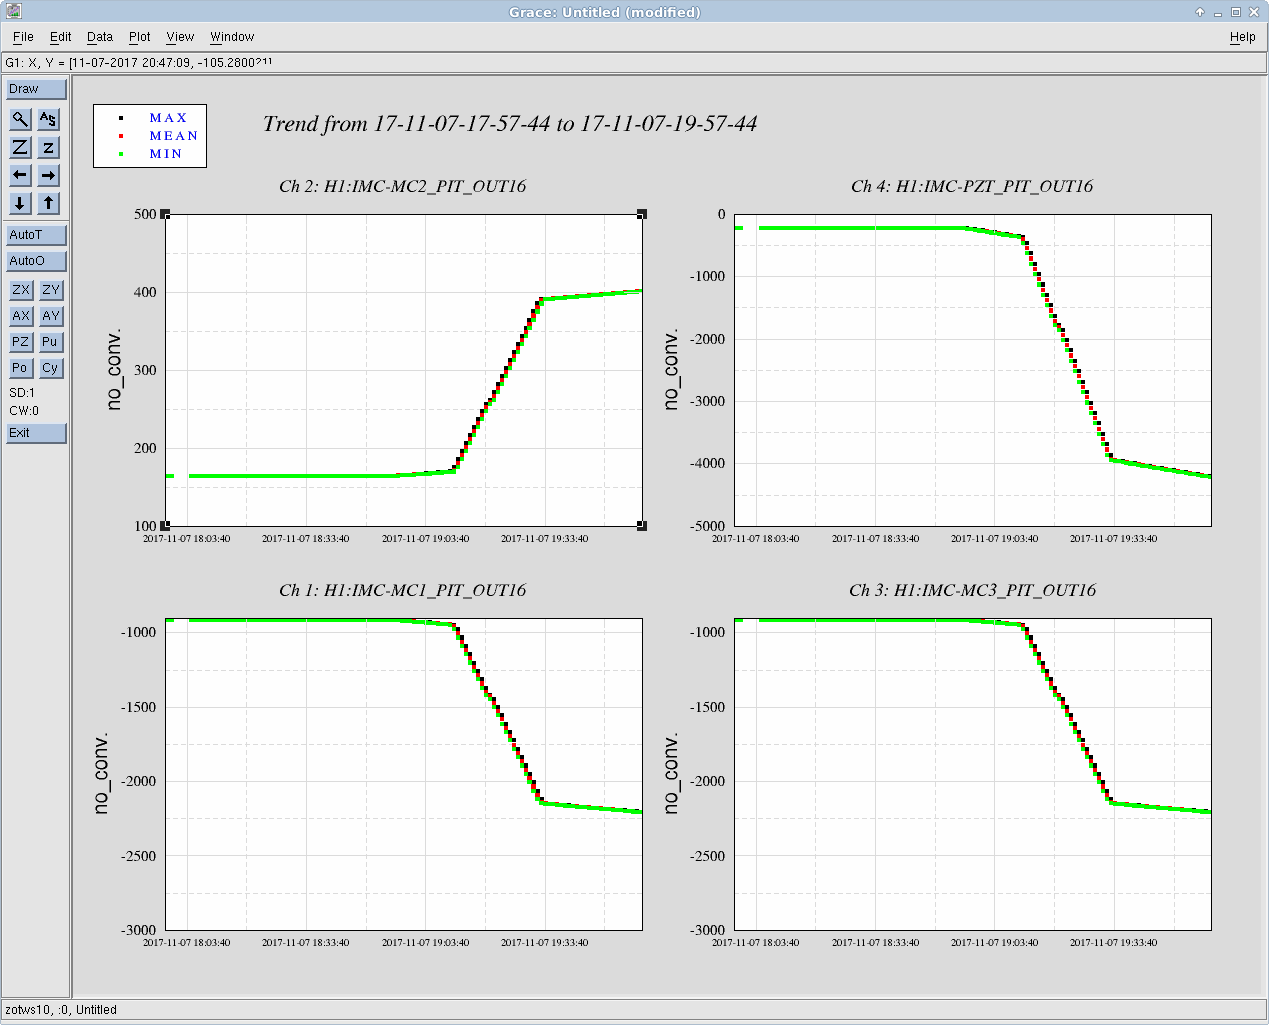
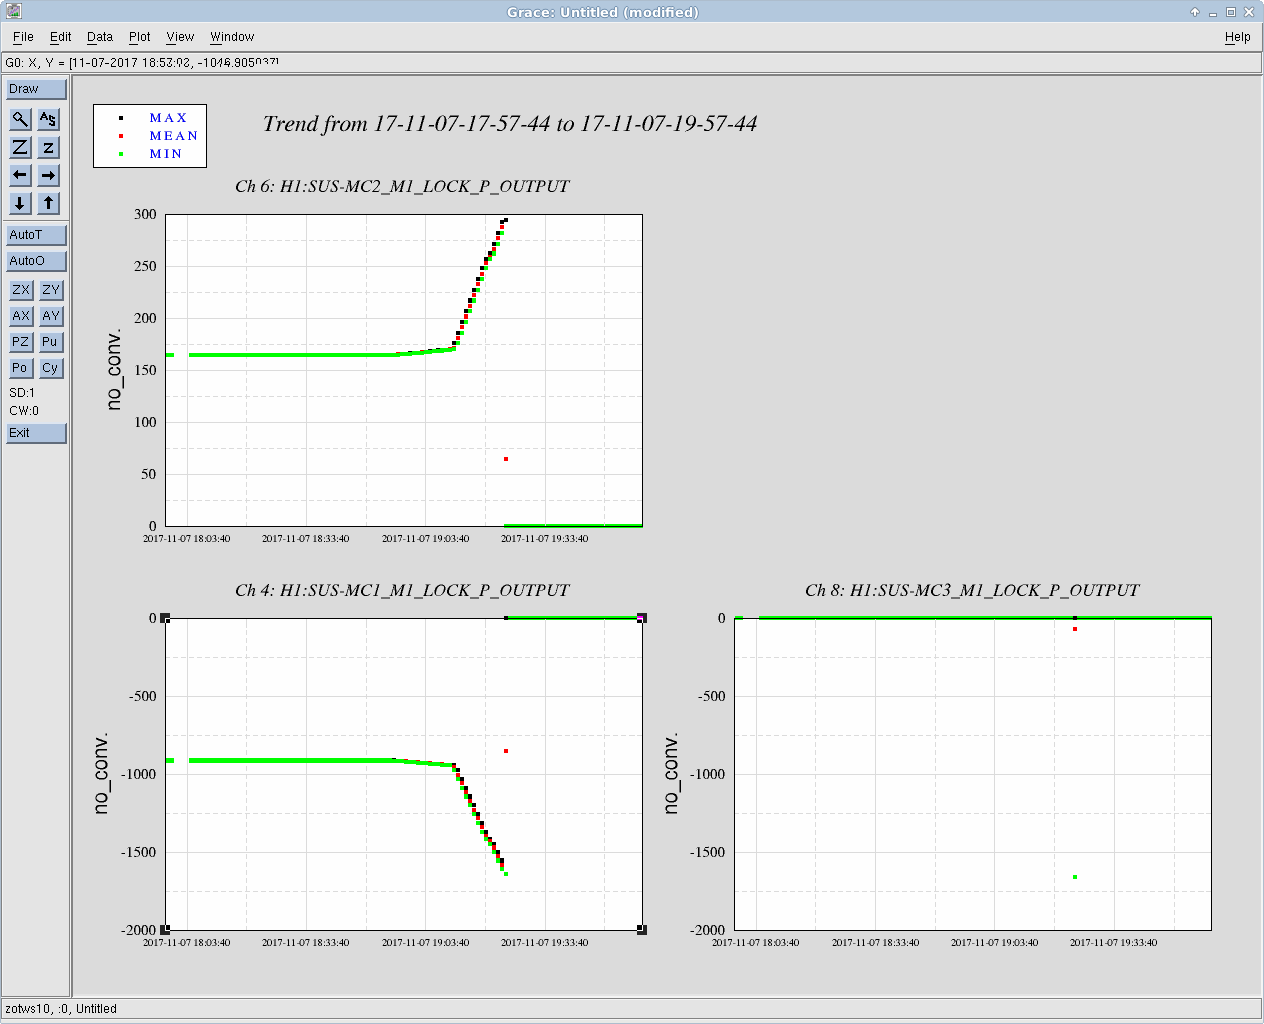
- found huge signals in IMC/ASC signals for all IMC optics
- tracked this down to the IMC flashing enough to trigger the ASC, which pushed the optics
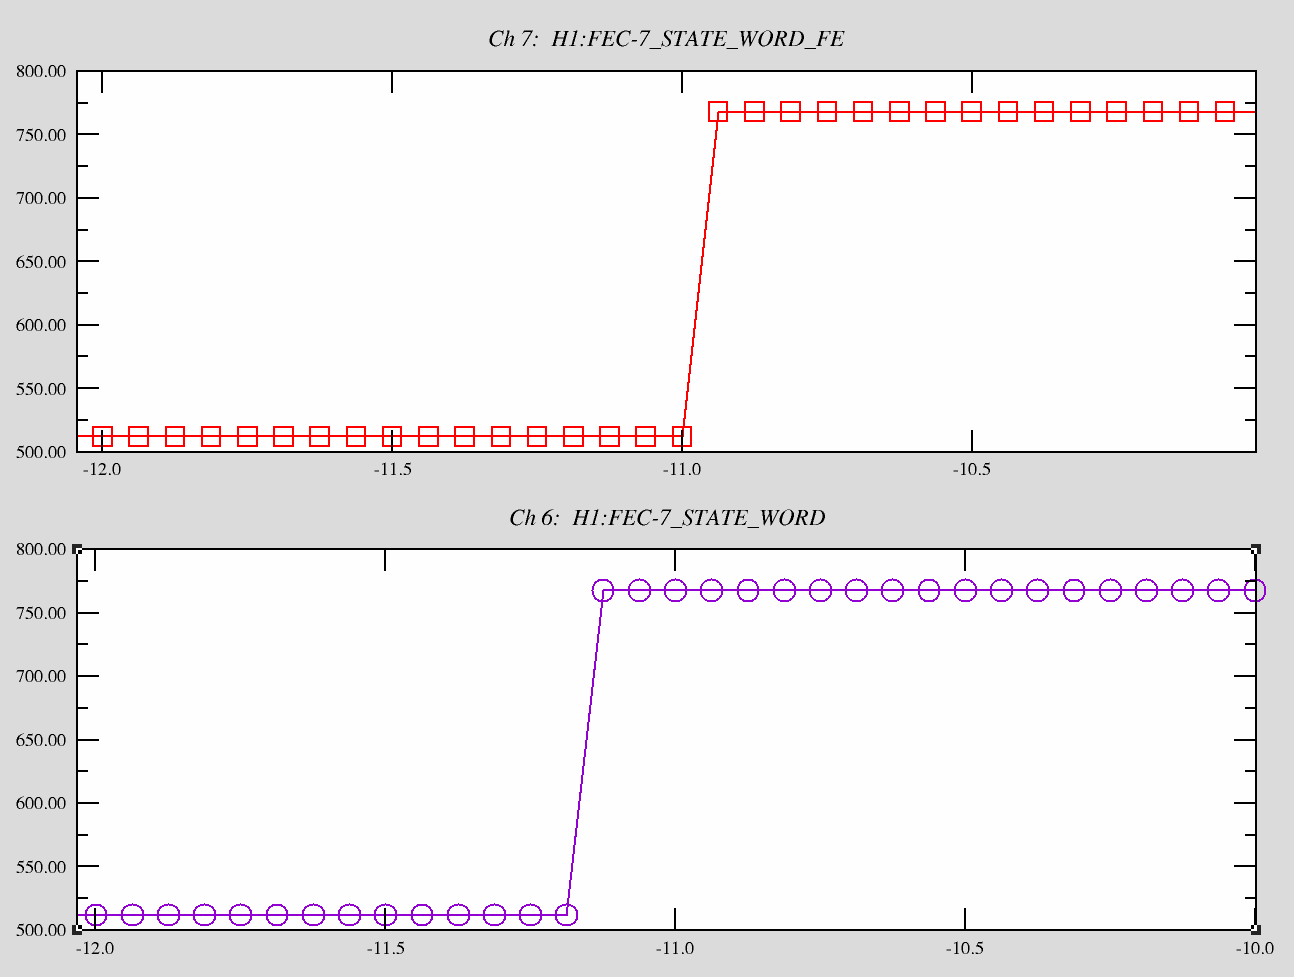
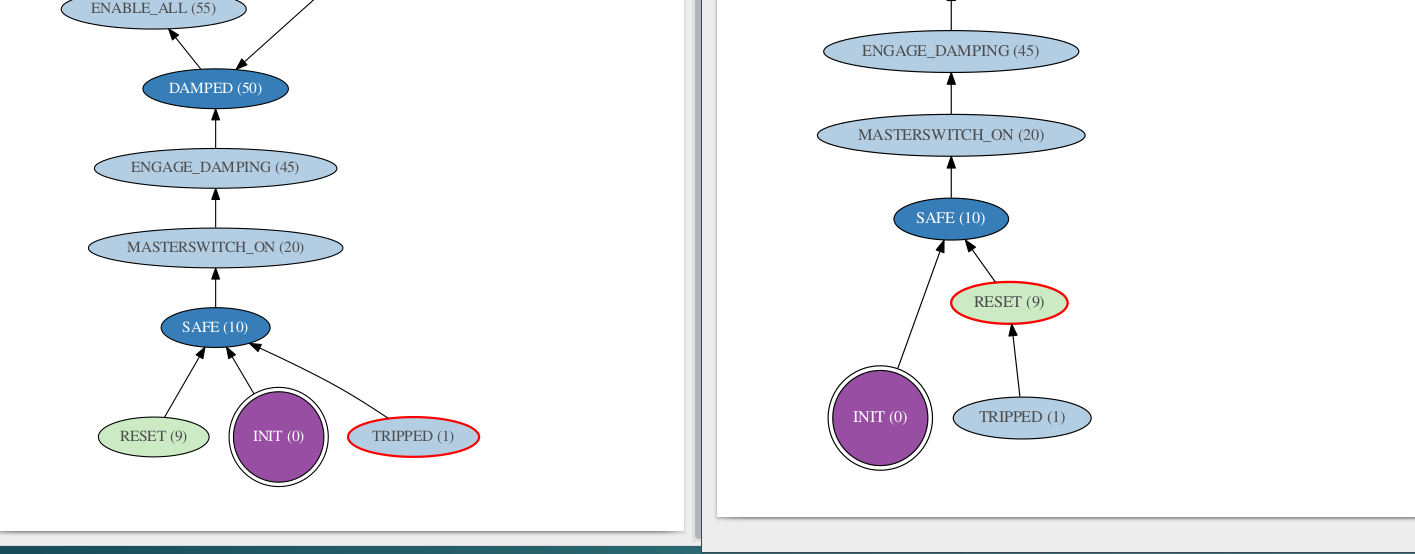
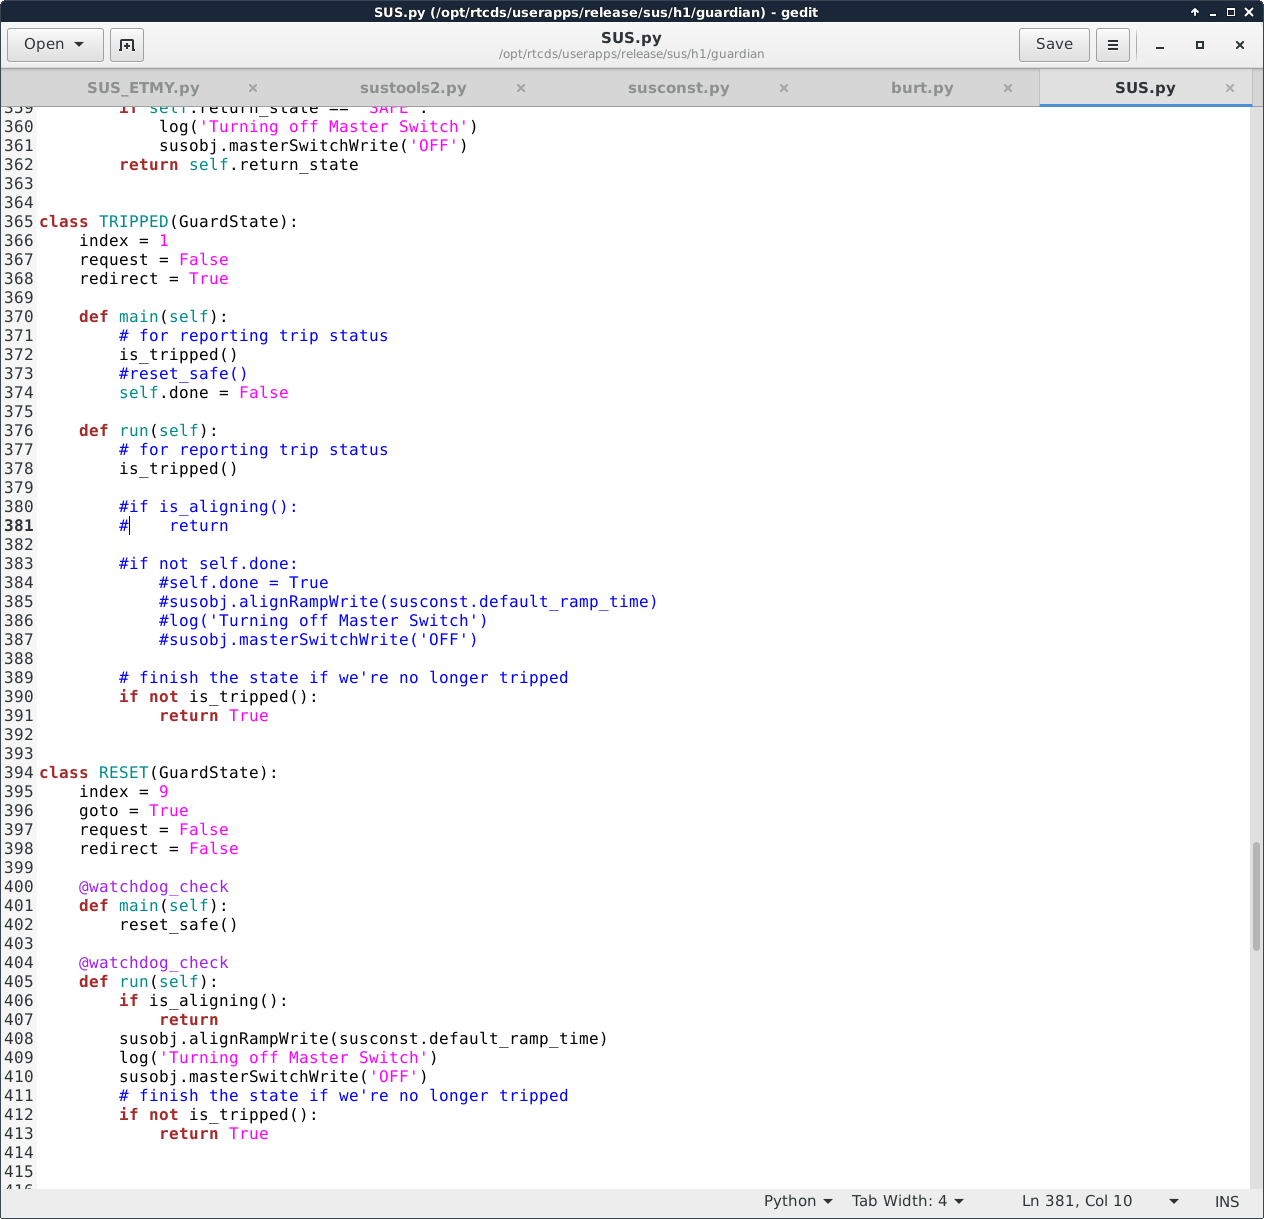
- this feature was disabled - see alog 39319
- optic sanity restored, aligned the beam to the IMC using the PZT
- noticed MC2 Trans at 30 counts - has been 1.6 to 2-ish counts without flashing
- noticed that PSL-Periscope-Power-In remained unchanged from yesterday
- was unsure of the power coming from the PSL
- closed the shutter to investigate
- found two beams on the bottom periscope mirror
- the first red herring of the day
- the iris, which I found fully open, is the beam dump for the second beam, when the iris is about 1/2 closed
- tweaked the AOM beam alignment to maximize PSL periscope power, it increased from 0.06 to something (will alog later)
- this new alignment was centered on the iris/beam dump that's before the HWP that's before the bottom periscope mirror
- a issue to be looked at later
- measured the power at the bottom periscope mirror - the current power into the IMC is 170mW
- this is not accurately represented by any current DC PD signal
- exited the PSL
- aligned the beam to the IMC
- found the reason for the second red herring - MC2 trans SUM increase
- while checking the MC2 iris, found the strong work light was on at the chamber, and when turned off, MC2 trans returned to it's normal values
- aligned the IMC to flash
- optic motion prevented all but a sparse few 0-0 flashes
- without 0-0 mode flashes, IMC and IM optic alignment through HAM2 will be difficult
- unclear what changed (reboots, restarts, mechanical...)
- see alog 39328
- will resume investigation/alignment tomorrow morning
- Cheryl, JeffK, Ed