Ops Shift Log: 12/12/2017, Day Shift 16:00 – 00:00 (08:00 - 16:00) Time - UTC (PT)
State of H1: Unlocked - Vent
Intent Bit: Engineering
Support: N/A
Incoming Operator: N/A
Shift Summary: Continuing vent work
Activity Log: Time - UTC (PT)
16:20 (08:00) Start of Shift
16:15 (08:15) Karen – Cleaning in the Optics Lab
16:30 (08:30) Karen – Out of the Optics Lab
16:39 (08:39) Hugh – Going to both End Stations to service HEPI pumps
16:38 (08:38) Peter – Transition LVEA to Laser Hazard
16:40 (08:40) Cintas on site to service mats
16:52 (08:52) Terry – Going into the Squeezer Bay
17:05 (09:05) Ed – Going to HAM2
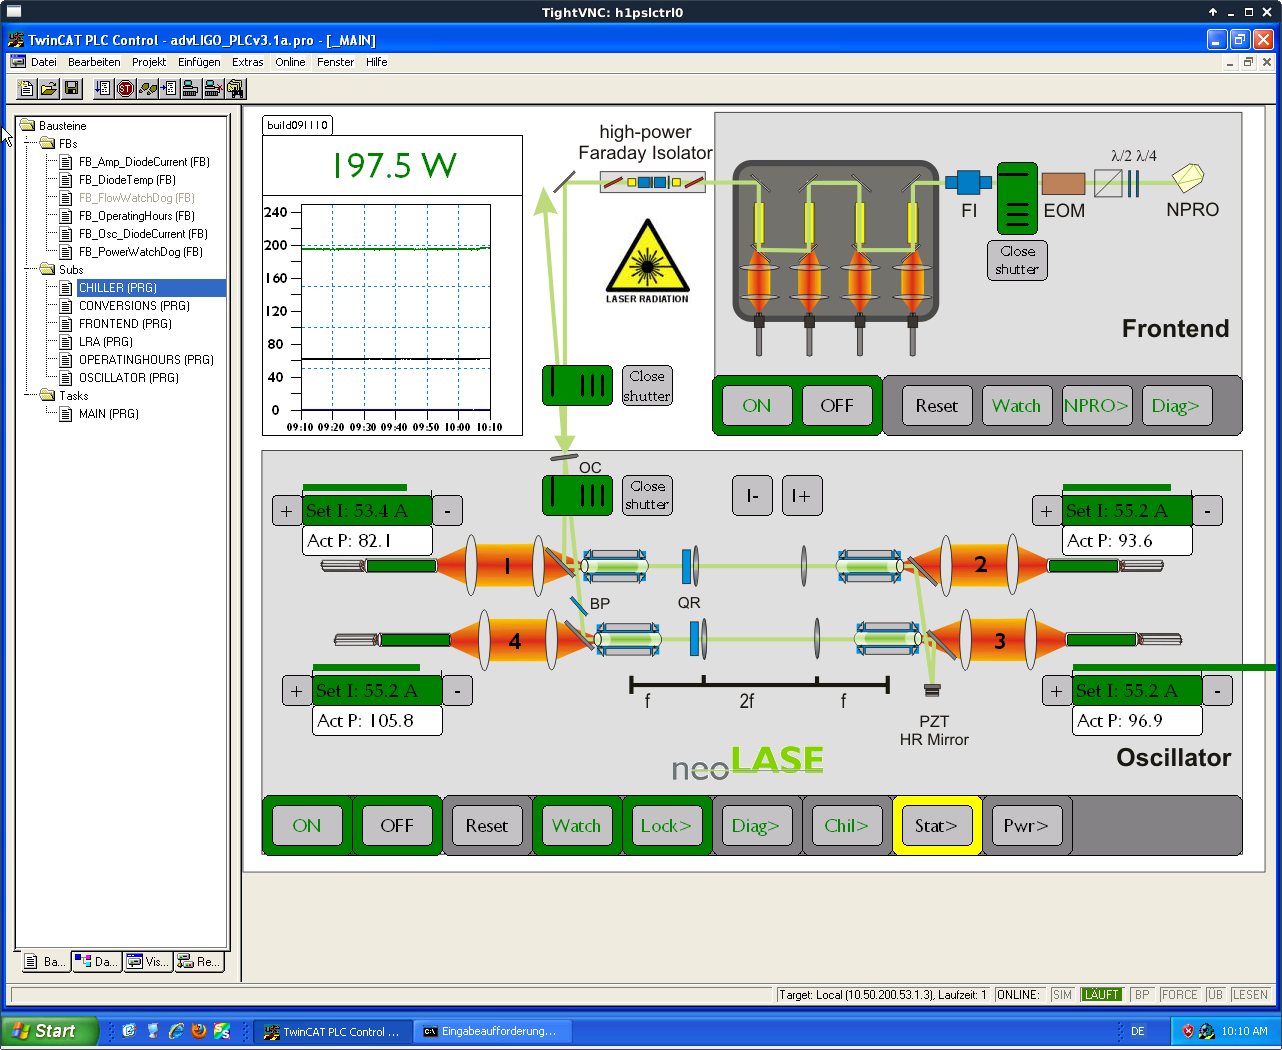
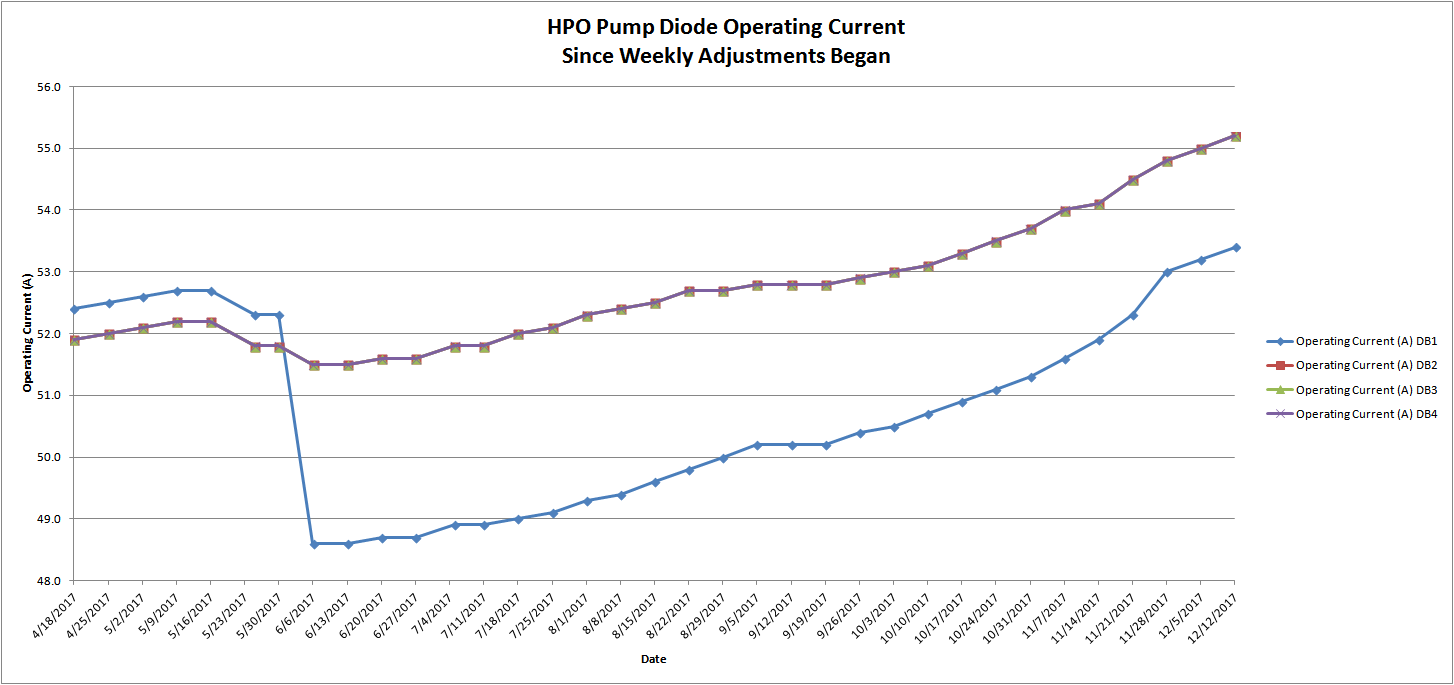
17:07 (09:07) Jason – Finished adjusting PSL diode current and going to reset noise eater
17:10 (09:10) Jason – Out of the LVEA
17:14 (09:14) Karen – Cleaning at End-Y
17:37 (09:37) Chandra – Going into the LVEA
17:45 (09:45) Hugh – Back for the End Stations
17:48 (09:48) Chandra – Out of the LVEA
17:53 (09:53) Betsy & Travis – Going to Biergarten for close out work
17:56 (09:56) Karen – Finished at End-Y
18:04 (10:04) Hugh – Going into the LVEA
18:13 (10:13) Chris – Out of the LVEA
18:15 (10:15) Chris – Going to both Mid and End stations to service batteries
18:15 (10:15) Hugh – Out of the LVEA
18:18 (10:18) Gerardo – Going to the Biergarten
18:25 (10:25) Richard – Going to the Biergarten
18:33 (10:33) Nutsinee – Going to the Squeezer Bay
18:35 (10:35) Sheila – Going into the Optics Lab – Will be Laser Hazard
18:42 (10:42) Soda vendor on site to service machines
18:45 (10:45) Ken – Going into the MSR
19:06 (11:06) Nutsinee – Out of the Squeezer Bay
19:07 (11:07) Richard – Out of the LVEA
19:28 (11:28) Cheryl & Ed – Out of the LVEA
19:31 (11:31) Richard – Going back to the Biergarten
19:58 (11:58) Ken – Out of the MSR
20:12 (12:12) Nutsinee – Going into the Optics Lab
20:29 (12:29) Jim & Sam – Going into the LVEA for a tour
20:30 (12:30) Cheryl – Going to HAM2
20:36 (12:36) Travis – Out of the LVEA
21:20 (13:20) Jim & Sam – Out of LVEA and going to End Stations
21:25 (13:25) Nutsinee & Sheila – Out of the Optics Lab
21:45 (13:45) Travis & Richard – Going to the Biergarten
21:45 (13:45) Kyle – Going to the End-X VEA to collect a pump cart
22:03 (14:03) Ken – Going to End-X
22:06 (14:06) Sheila & Nutsinee – Going into the Optics Lab
22:11 (14:11) Filiberto – Going to the Biergarten
22:23 (14:23) Gerardo – Going to the Biergarten
22:29 (14:29) Betsy – Going to the Biergarten
22:53 (14:53) Kyle – Back from End-X
22:54 (14:54) Richard – Out of the Biergarten
23:18 (15:18) Travis – Out of the Biergarten
00:00 (16:00) End of Shift


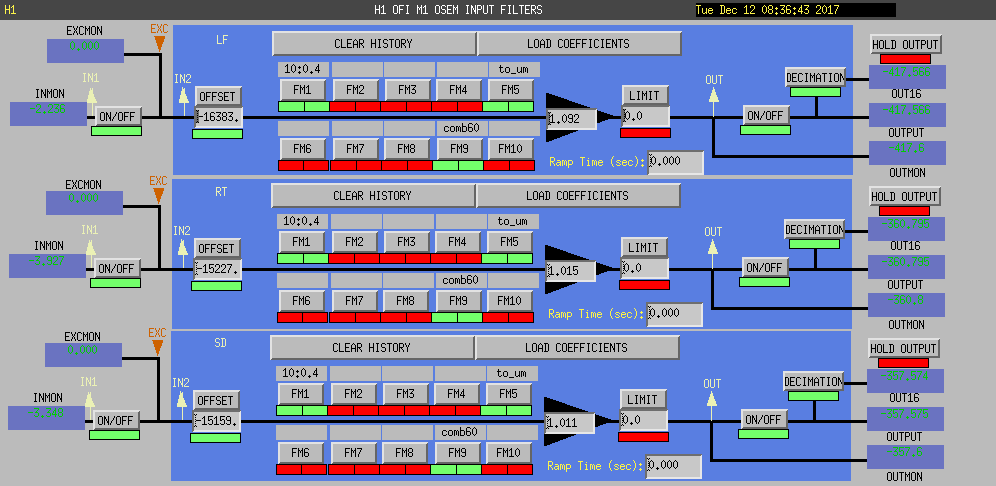
I have created a Work Permit (WP7245) to cover the MEDM changes and further testing.