TITLE: 12/07 Day Shift: 16:00-00:00 UTC (08:00-16:00 PST), all times posted in UTC
STATE of H1: Planned Engineering
INCOMING OPERATOR: None
SHIFT SUMMARY:
LOG:
16:00 LVEA is LASER SAFE
16:01 Christina and Karen are in the LVEA
16:27 Tyler and Mark out to MY
16:35 Fil and Jeff B out to HAM2 for ground loop checking/repair
16:36 Terry going into the squeezer bay
16:51 Betsy out to HAM 4/5 area to prepare for putting doors back on.
16:52 Chandra out to GV4. Will possibly be using the W Crane
16:54 Tyler and Mark are back
17:01 Travis out to HAM4 area for door closure
17:07 Peter out to LVEA
17:08 Dr Stefan Balmer on site
17:09 Christina and Karen out of the LVEA
17:13 Peter out
17:28 Chandra out (temporarily)
17:34 Mark and Tyler going into LVEA to crane HAM doors to a staging area for afternoon installation
17:41 Jim and Jeff K out to HAM 2 to B&K hammer
17:46 Chandra into LVEA
17:51 TJ heading out to LVEA/TCSX.
17:54 Fil and Jeff finished with HAM2. Fil moving to ITMs to continue ground loop checks.
17:57 Re-aligned/damped all HAM2 suspensions
17:59 Bubba into LVEA for crane/door work
18:06 Peter and Umakant out to PSL enclosure
18:15 printed out dign-off sheet for door activity for Betsy and co.
18:29 Richard out to LVEA
18:20 TJ out
18:21 N in to squeezer bay
10:26 Fil and TJ into the LVEA
10:35 Richard out
10:51 Mark and Tytler out
18:59 Took HAM5 suspensions to SAFE/UNDAMPED for Fil and Jeff B ground loop checking
19:03 Dave B and Arnab going to out buildings
19:07 Mark and Tyler back into LVEA
19:08 Brijesh out to Output arm area to observe
19:10 Vern out to LVEA (no-op)
19:14 Siddesh out to LVEA(no-op?)
19:15 Terry out of LVEA (no-op)
19:24 Mark in and out of LVEA to deliver canned air to Jeff K at HAM2
19:32 Dave B and Arnab at EY
19:32 Richard out to LVEA
19:38 Richard out
19:45 Betsy out
19:49 Travis out
19:52 Jason and TJ are out
19:57 Dave B and co. checked in from MX
19:57 Peter and Umakant out
19:59 Jeff K and Jim out
20:08 Mark, Tyler, Bubba, and Siddesh out for lunch
20:09 HAM4 N Door tacked on
20:13 Dave B checked in from EX
20:30 Fil out
20:34 Jeff B out
20:36 Dave and Arnab back
20:39 N out for lunch (no-op)
20:52 Travis and Jeff back out
20:59 Hugh out to HAM5 for ISI balancing
13:00 Vent Meeting
21:05 Tyler, Mark and Bubba out to LVEA
22:07 Sheila into Optics lab
21:10 TJ and Jason back out to LVEA
21:20 Fil out to LVEA
21:24 Jeff B in with Fil
21:39 Gerardo into LVEA (no-op)
21:53 Betsy into LVEA
21:54 N into squeezer bay
22:07 Jeff B and Fil out
22:09 N card showed undeclared
22:13 Bubba out
22:19 Gerardo out
22:24 Richard into LVEA
22:30 Richard out
22:39 Jeff K out
22:56 Chandra into LVEA
22:57 Tyler and Mark out
22:58 Terry back out to squeezer bay
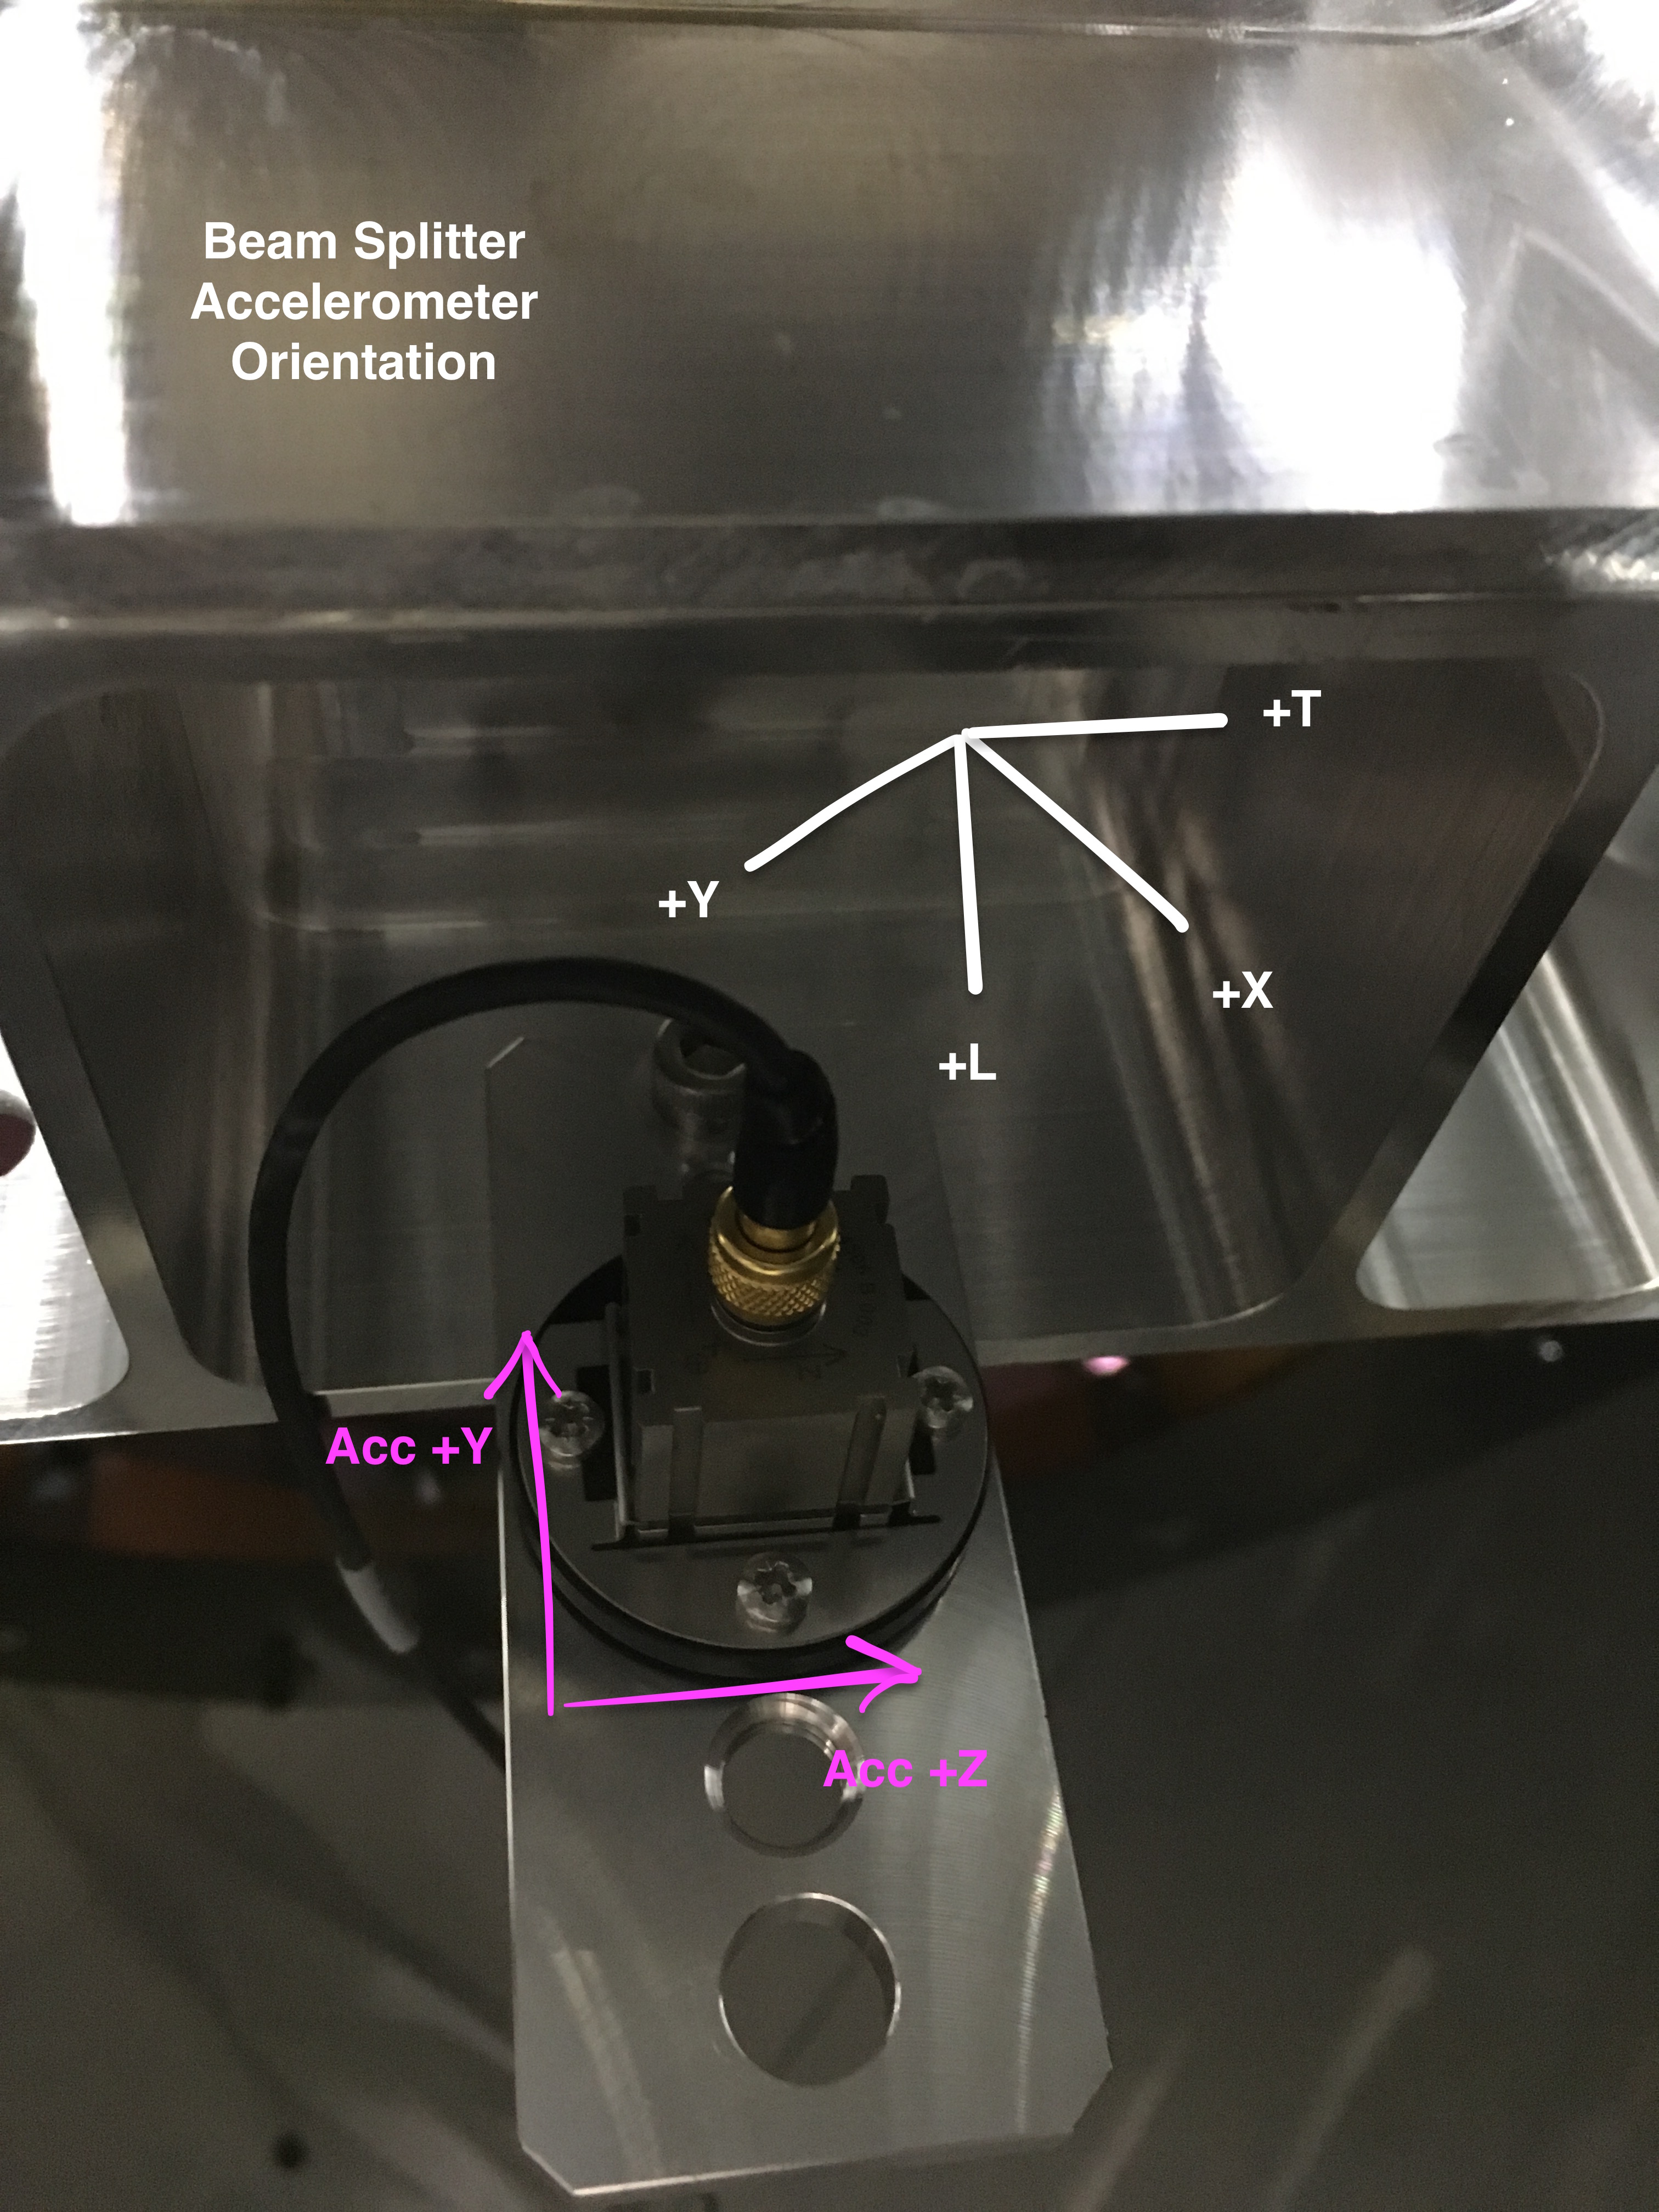
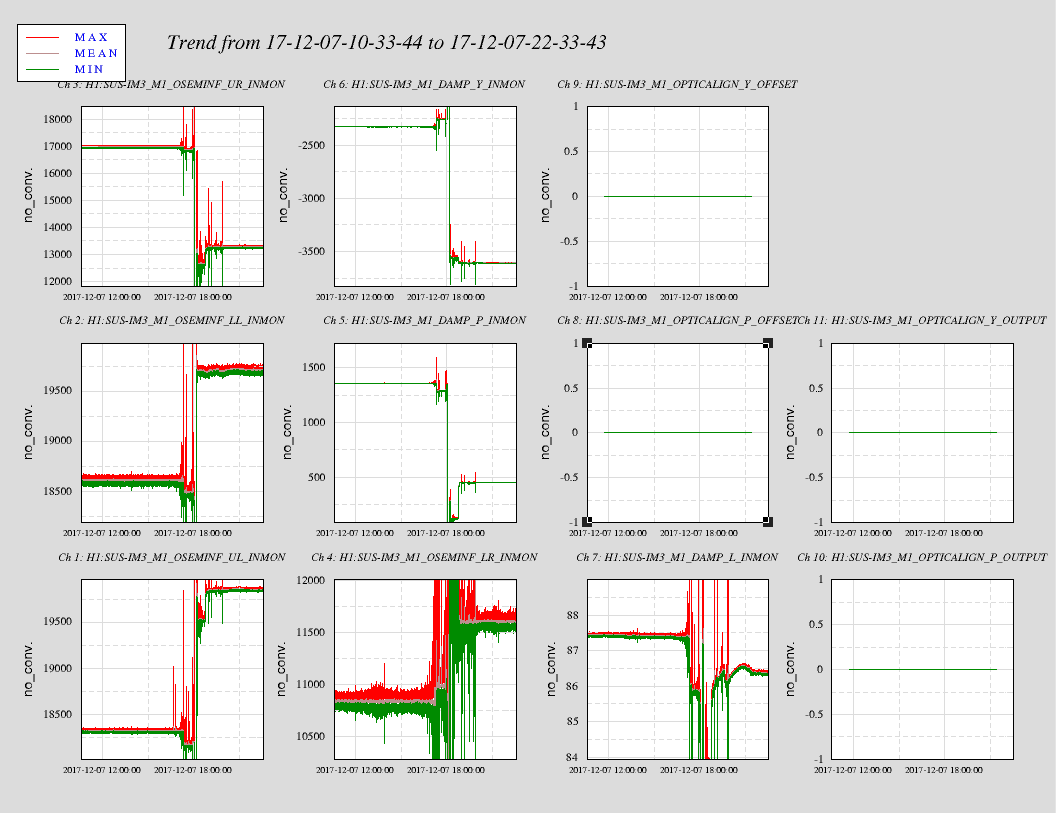
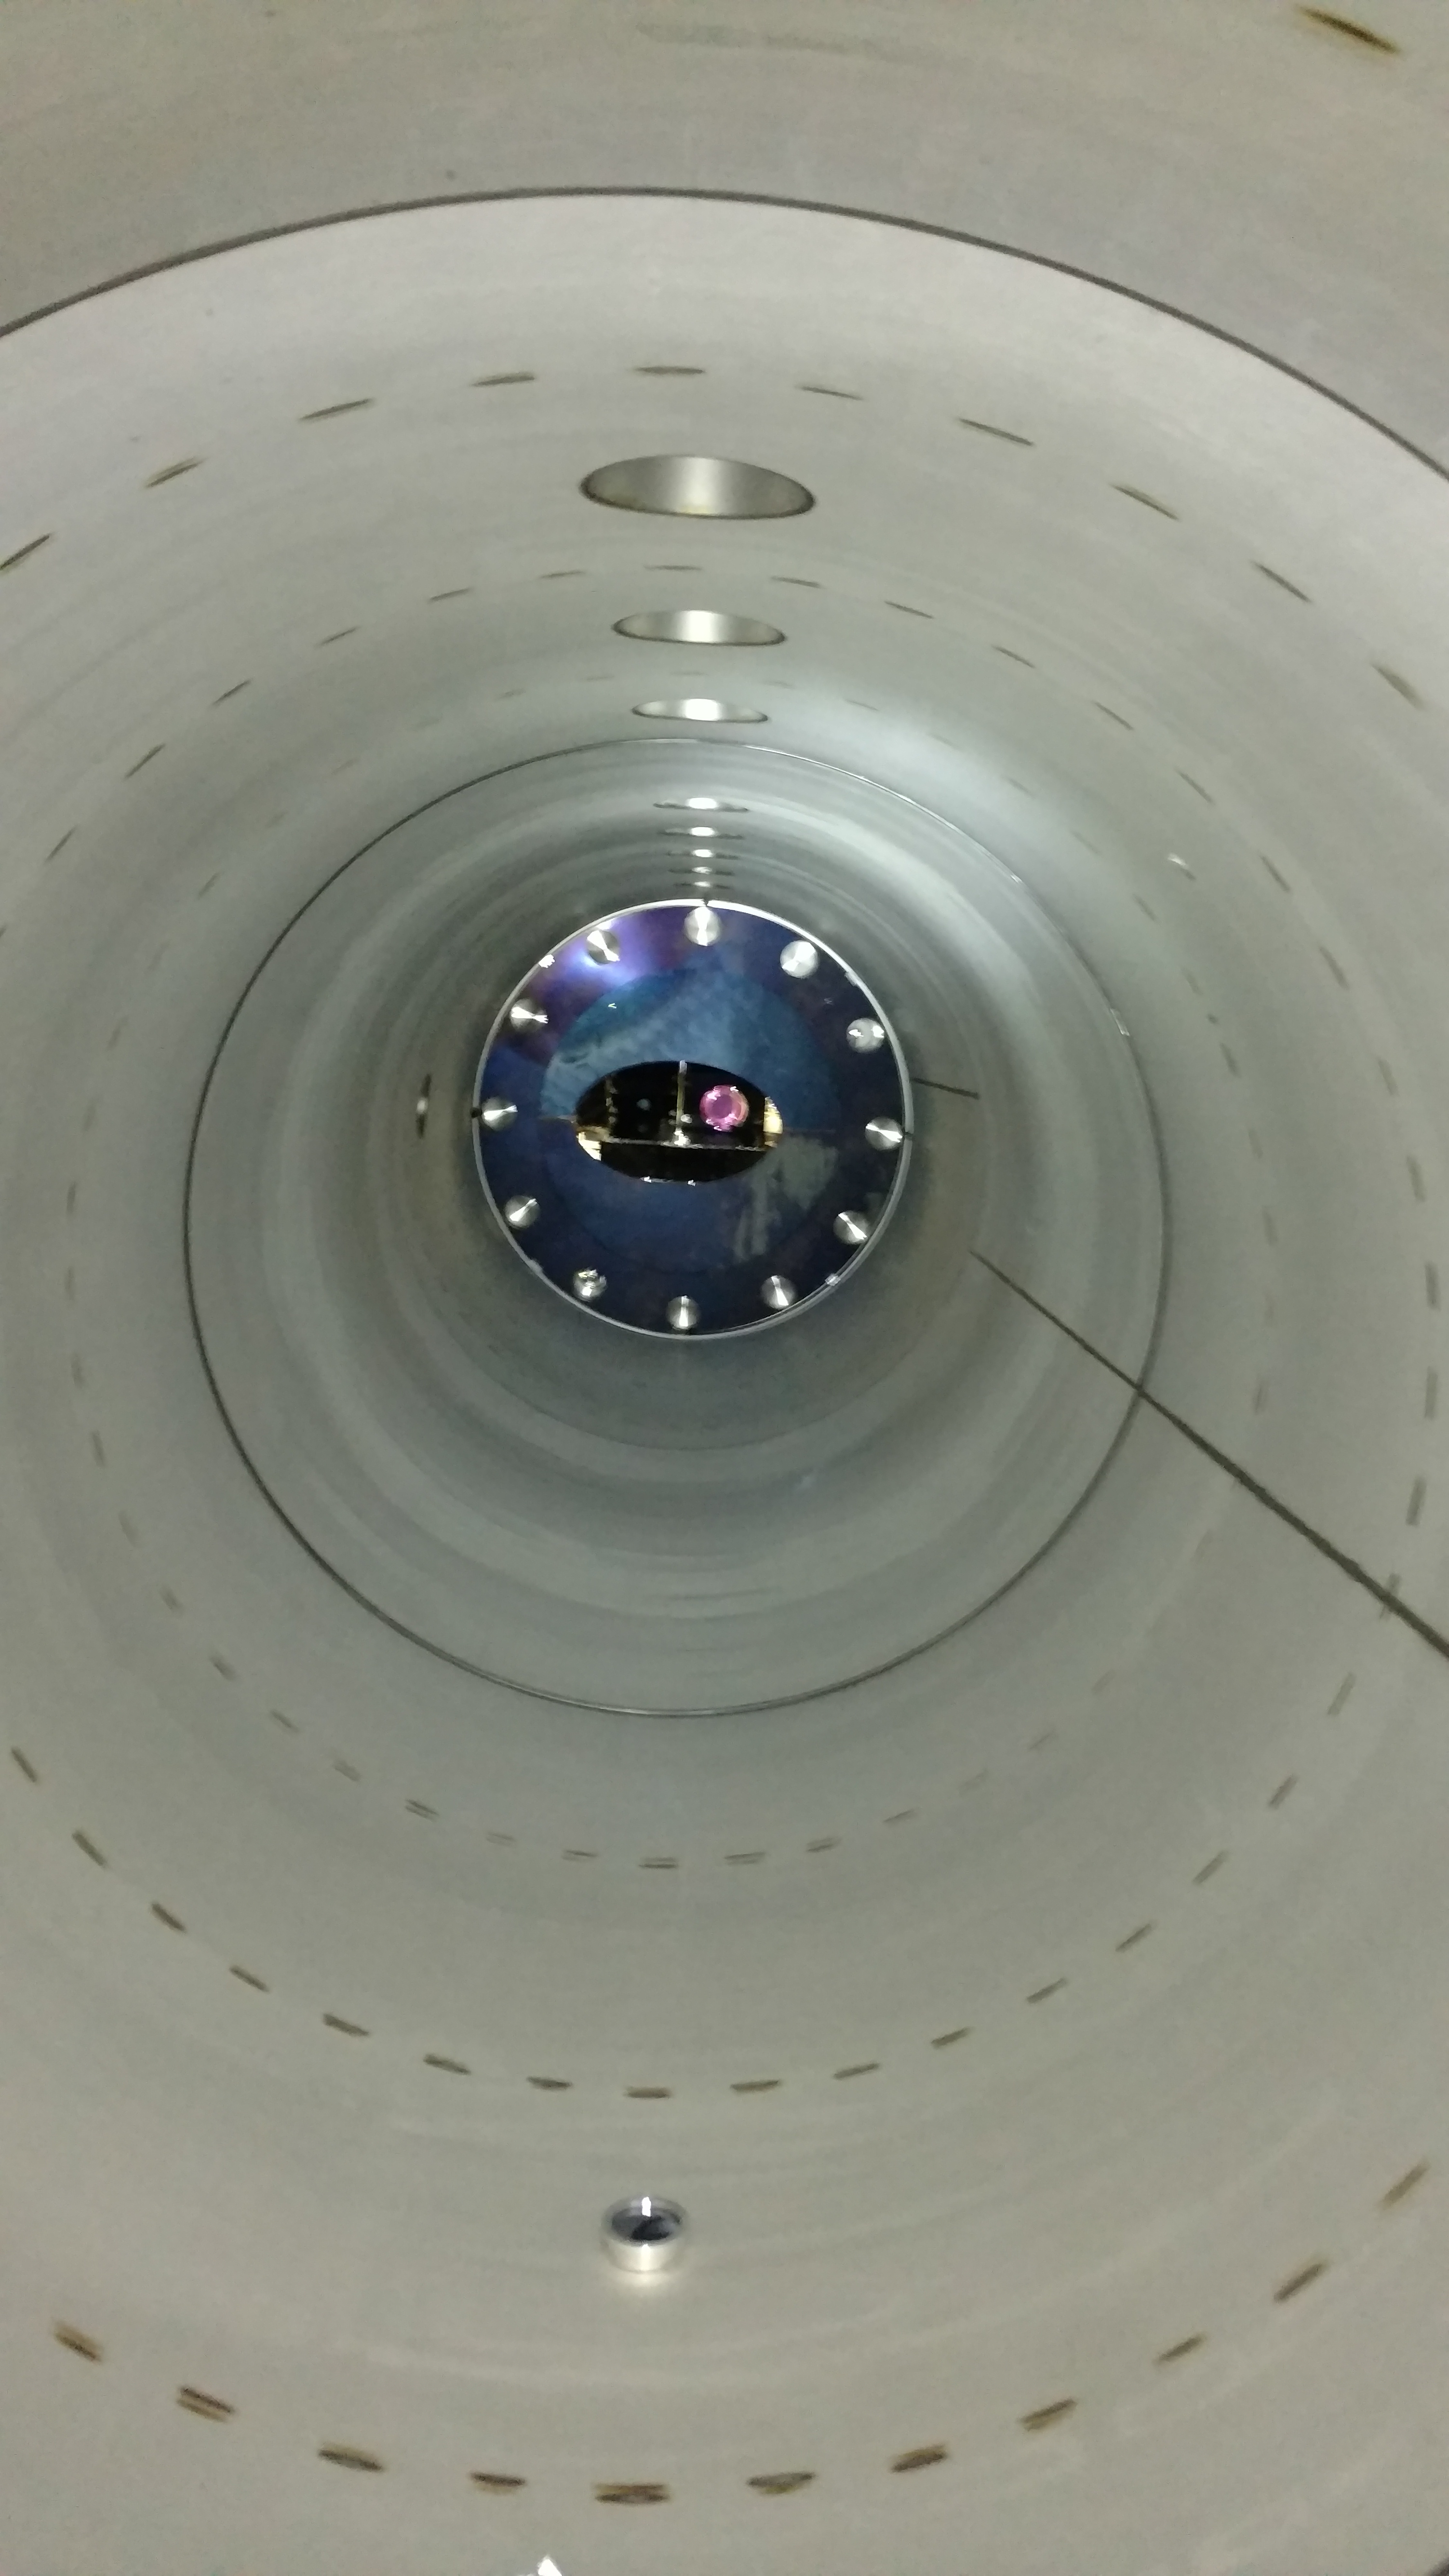
23:14 Cheryl out to HAM2 to investigate IM3
23:15 Jeff K into LVEA to take pics at HAM3
22:17 Jeff K out
23:25 Dave B out to HAM5 to deliver a laptop to Hugh
23:39 Bubba and Bailey into the LVEA
23:47 Jason and TJ out
23:49 Chandra out
23:58 Cheryl out