J. Oberling, R. Crouch, J. Warner, B. Weaver, I. Abouelfettouh
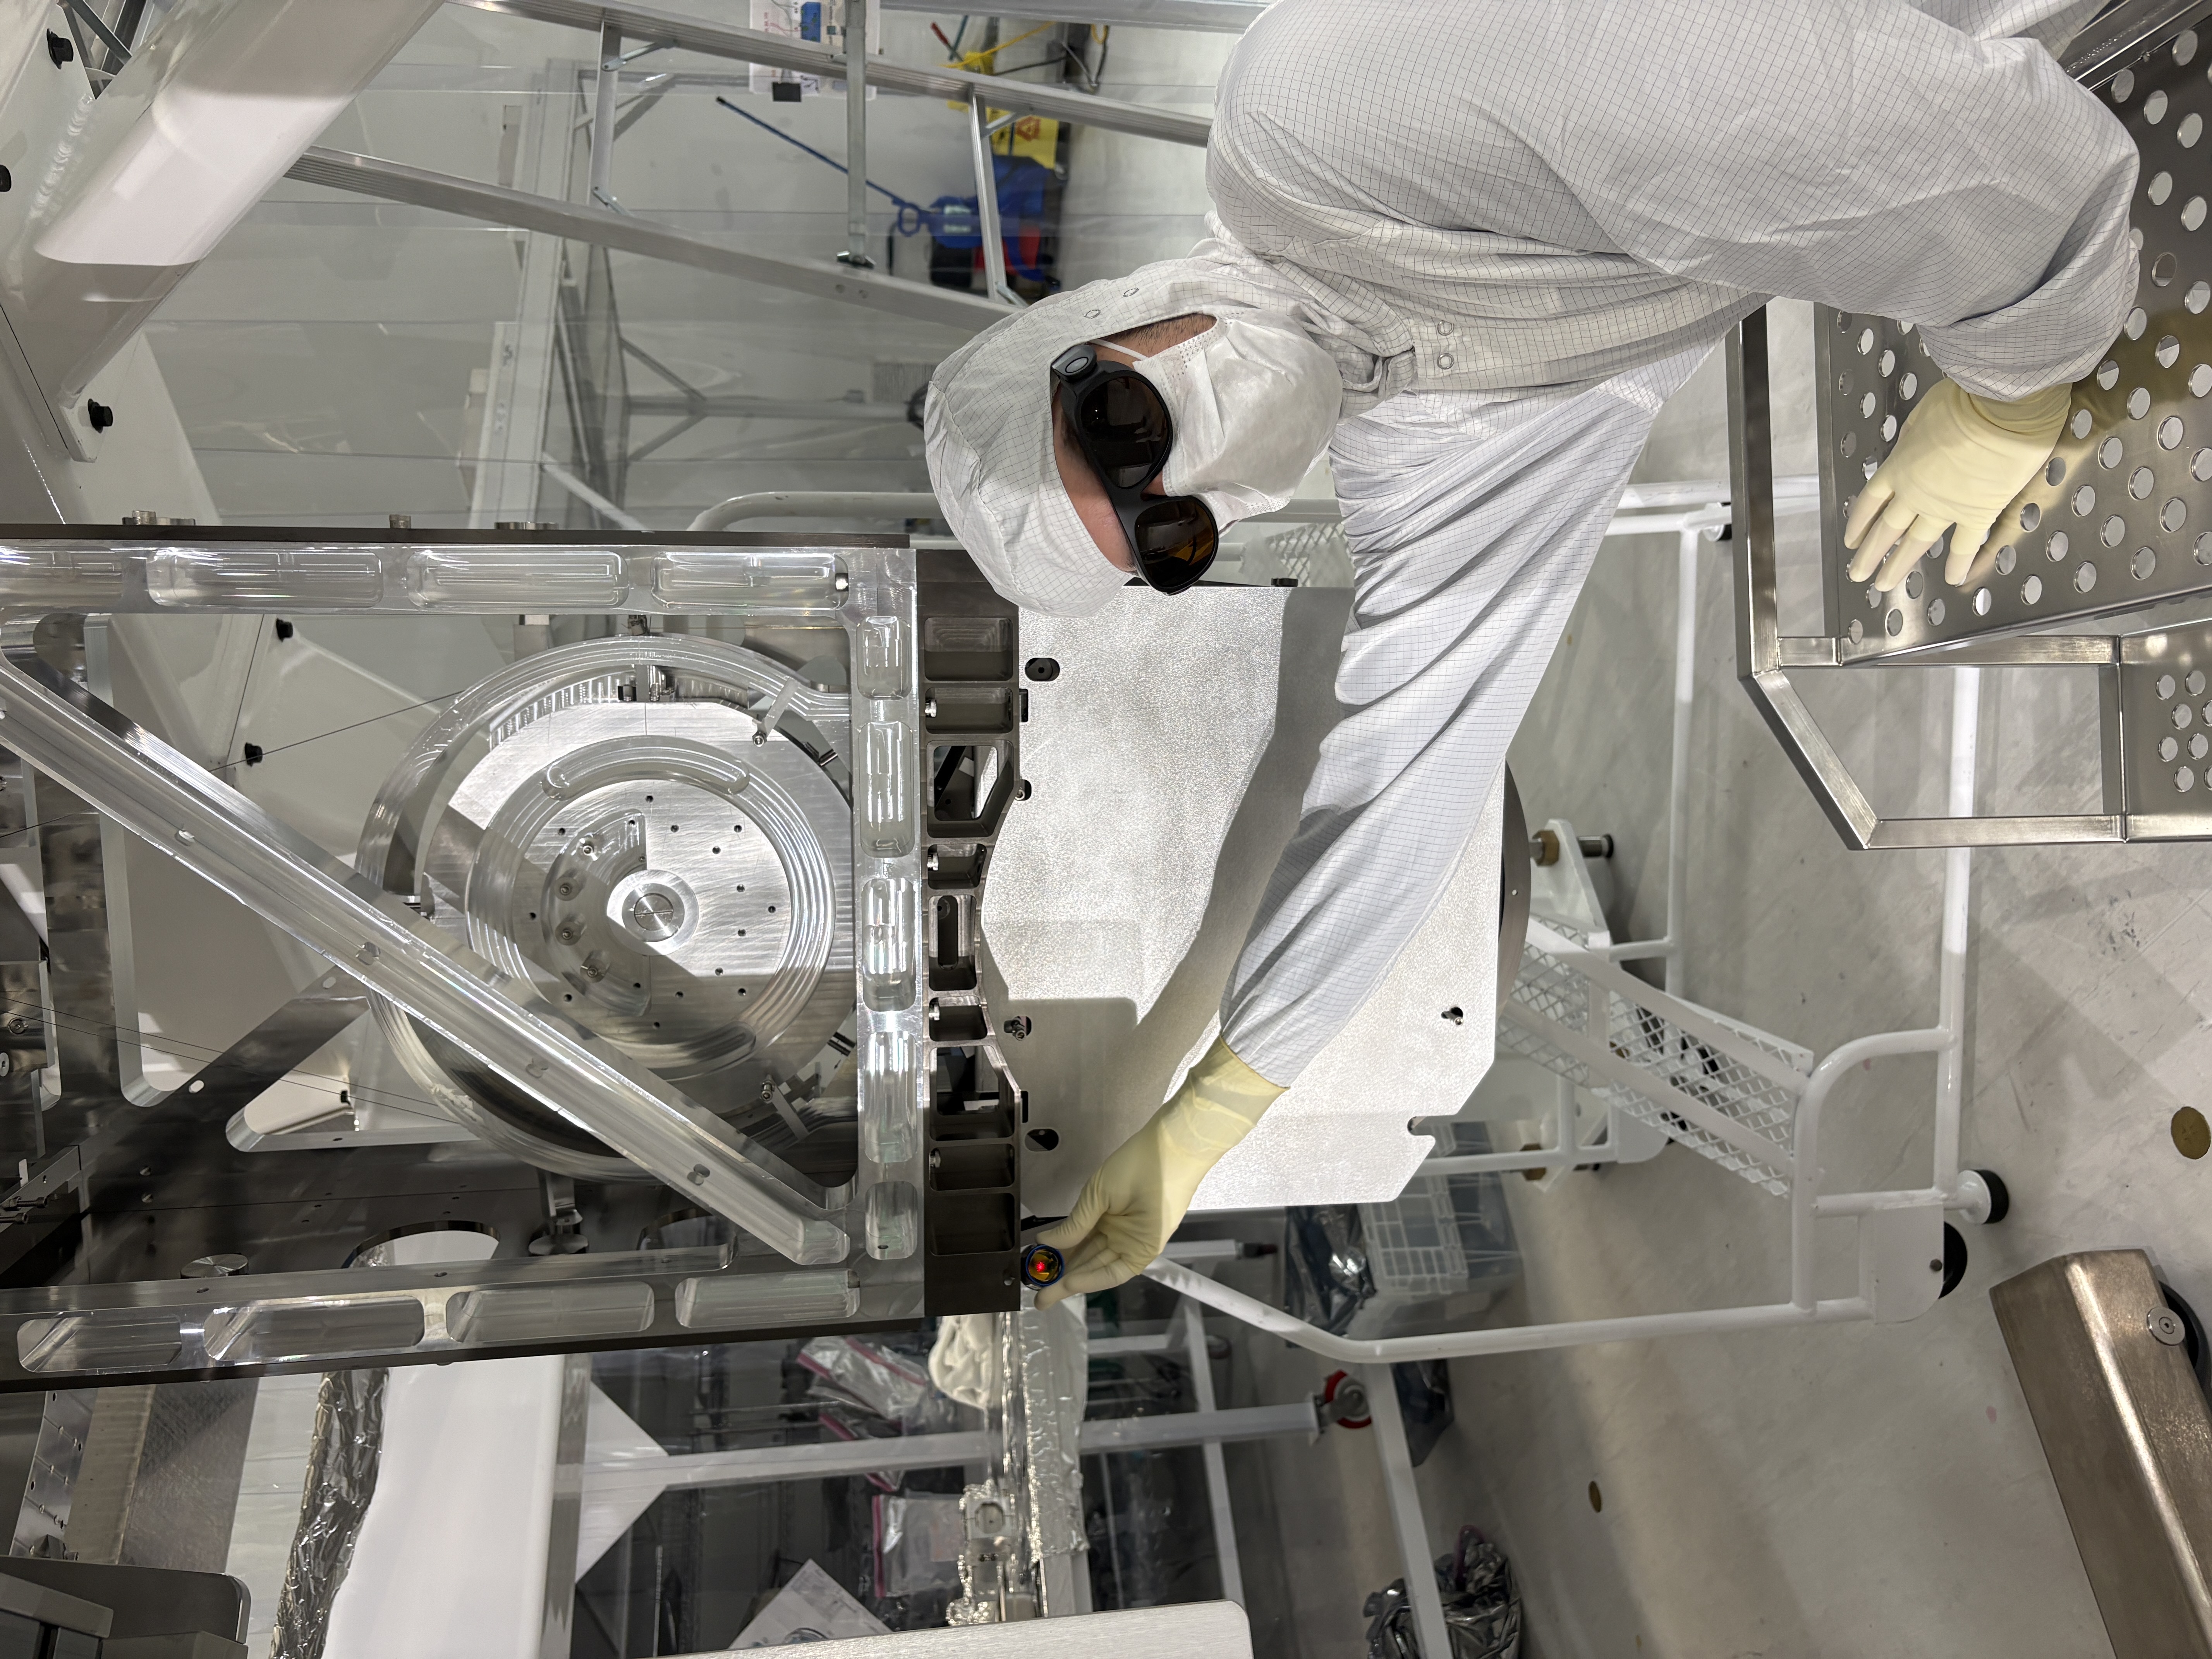
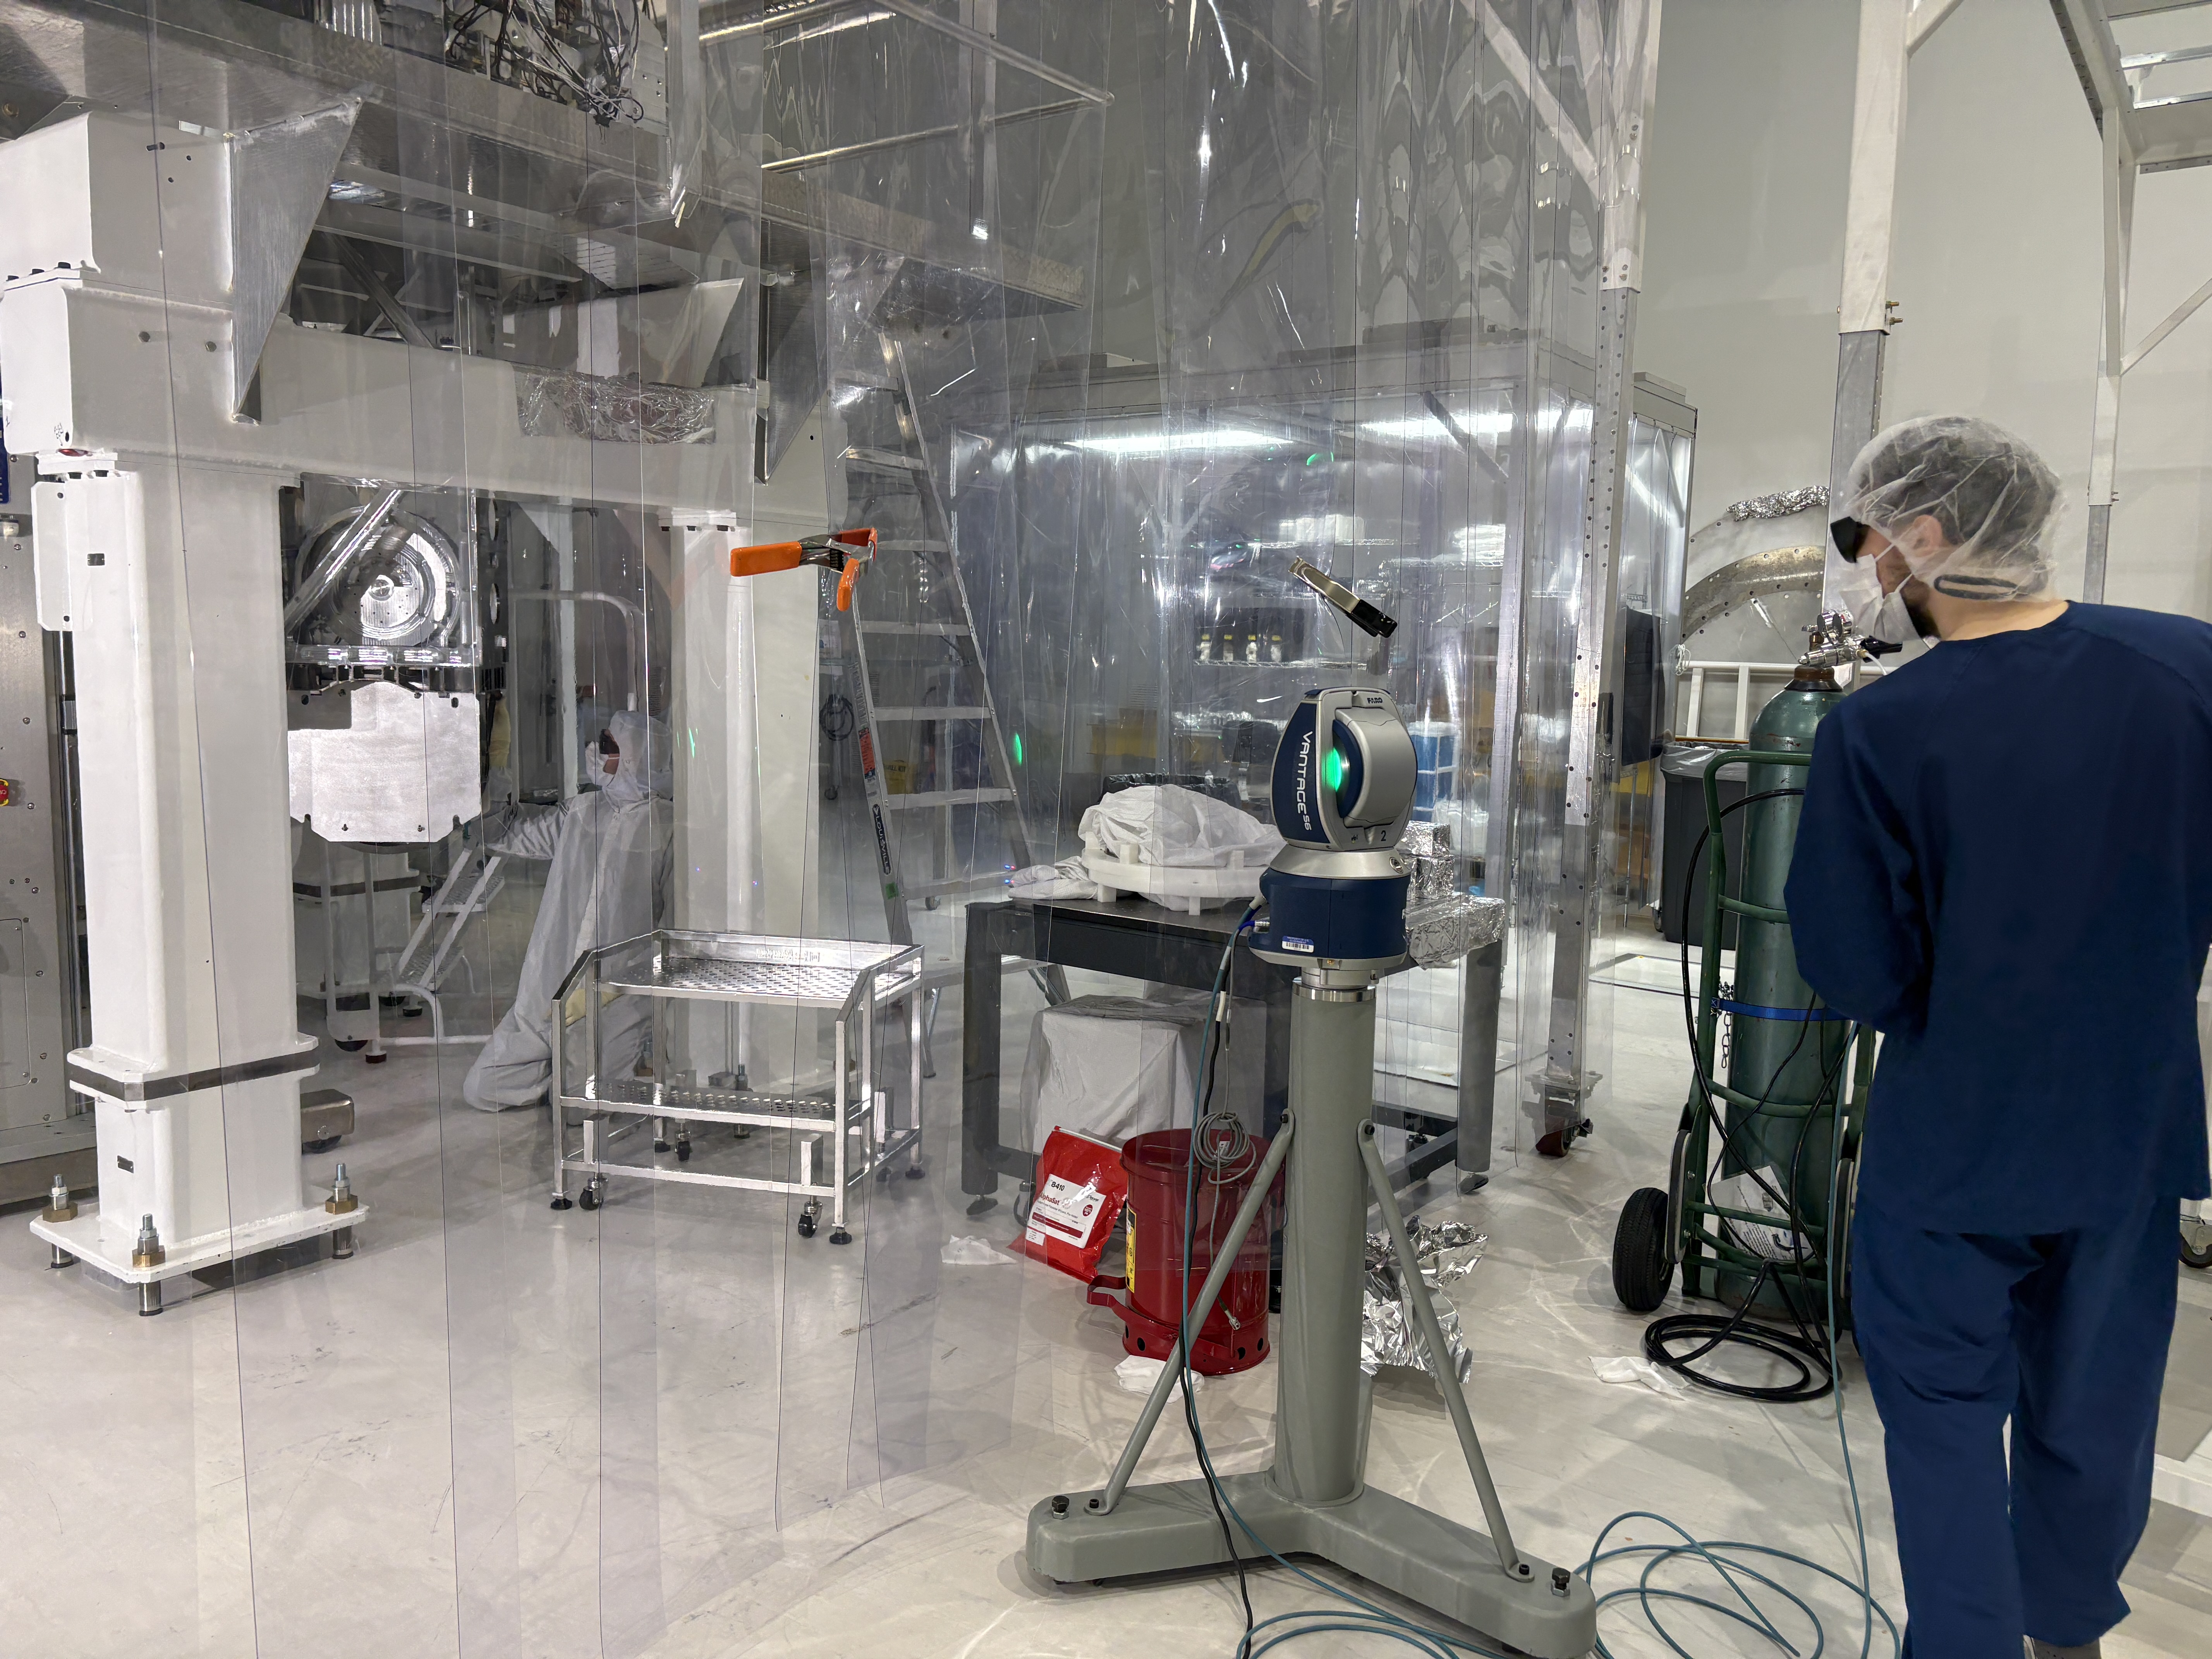
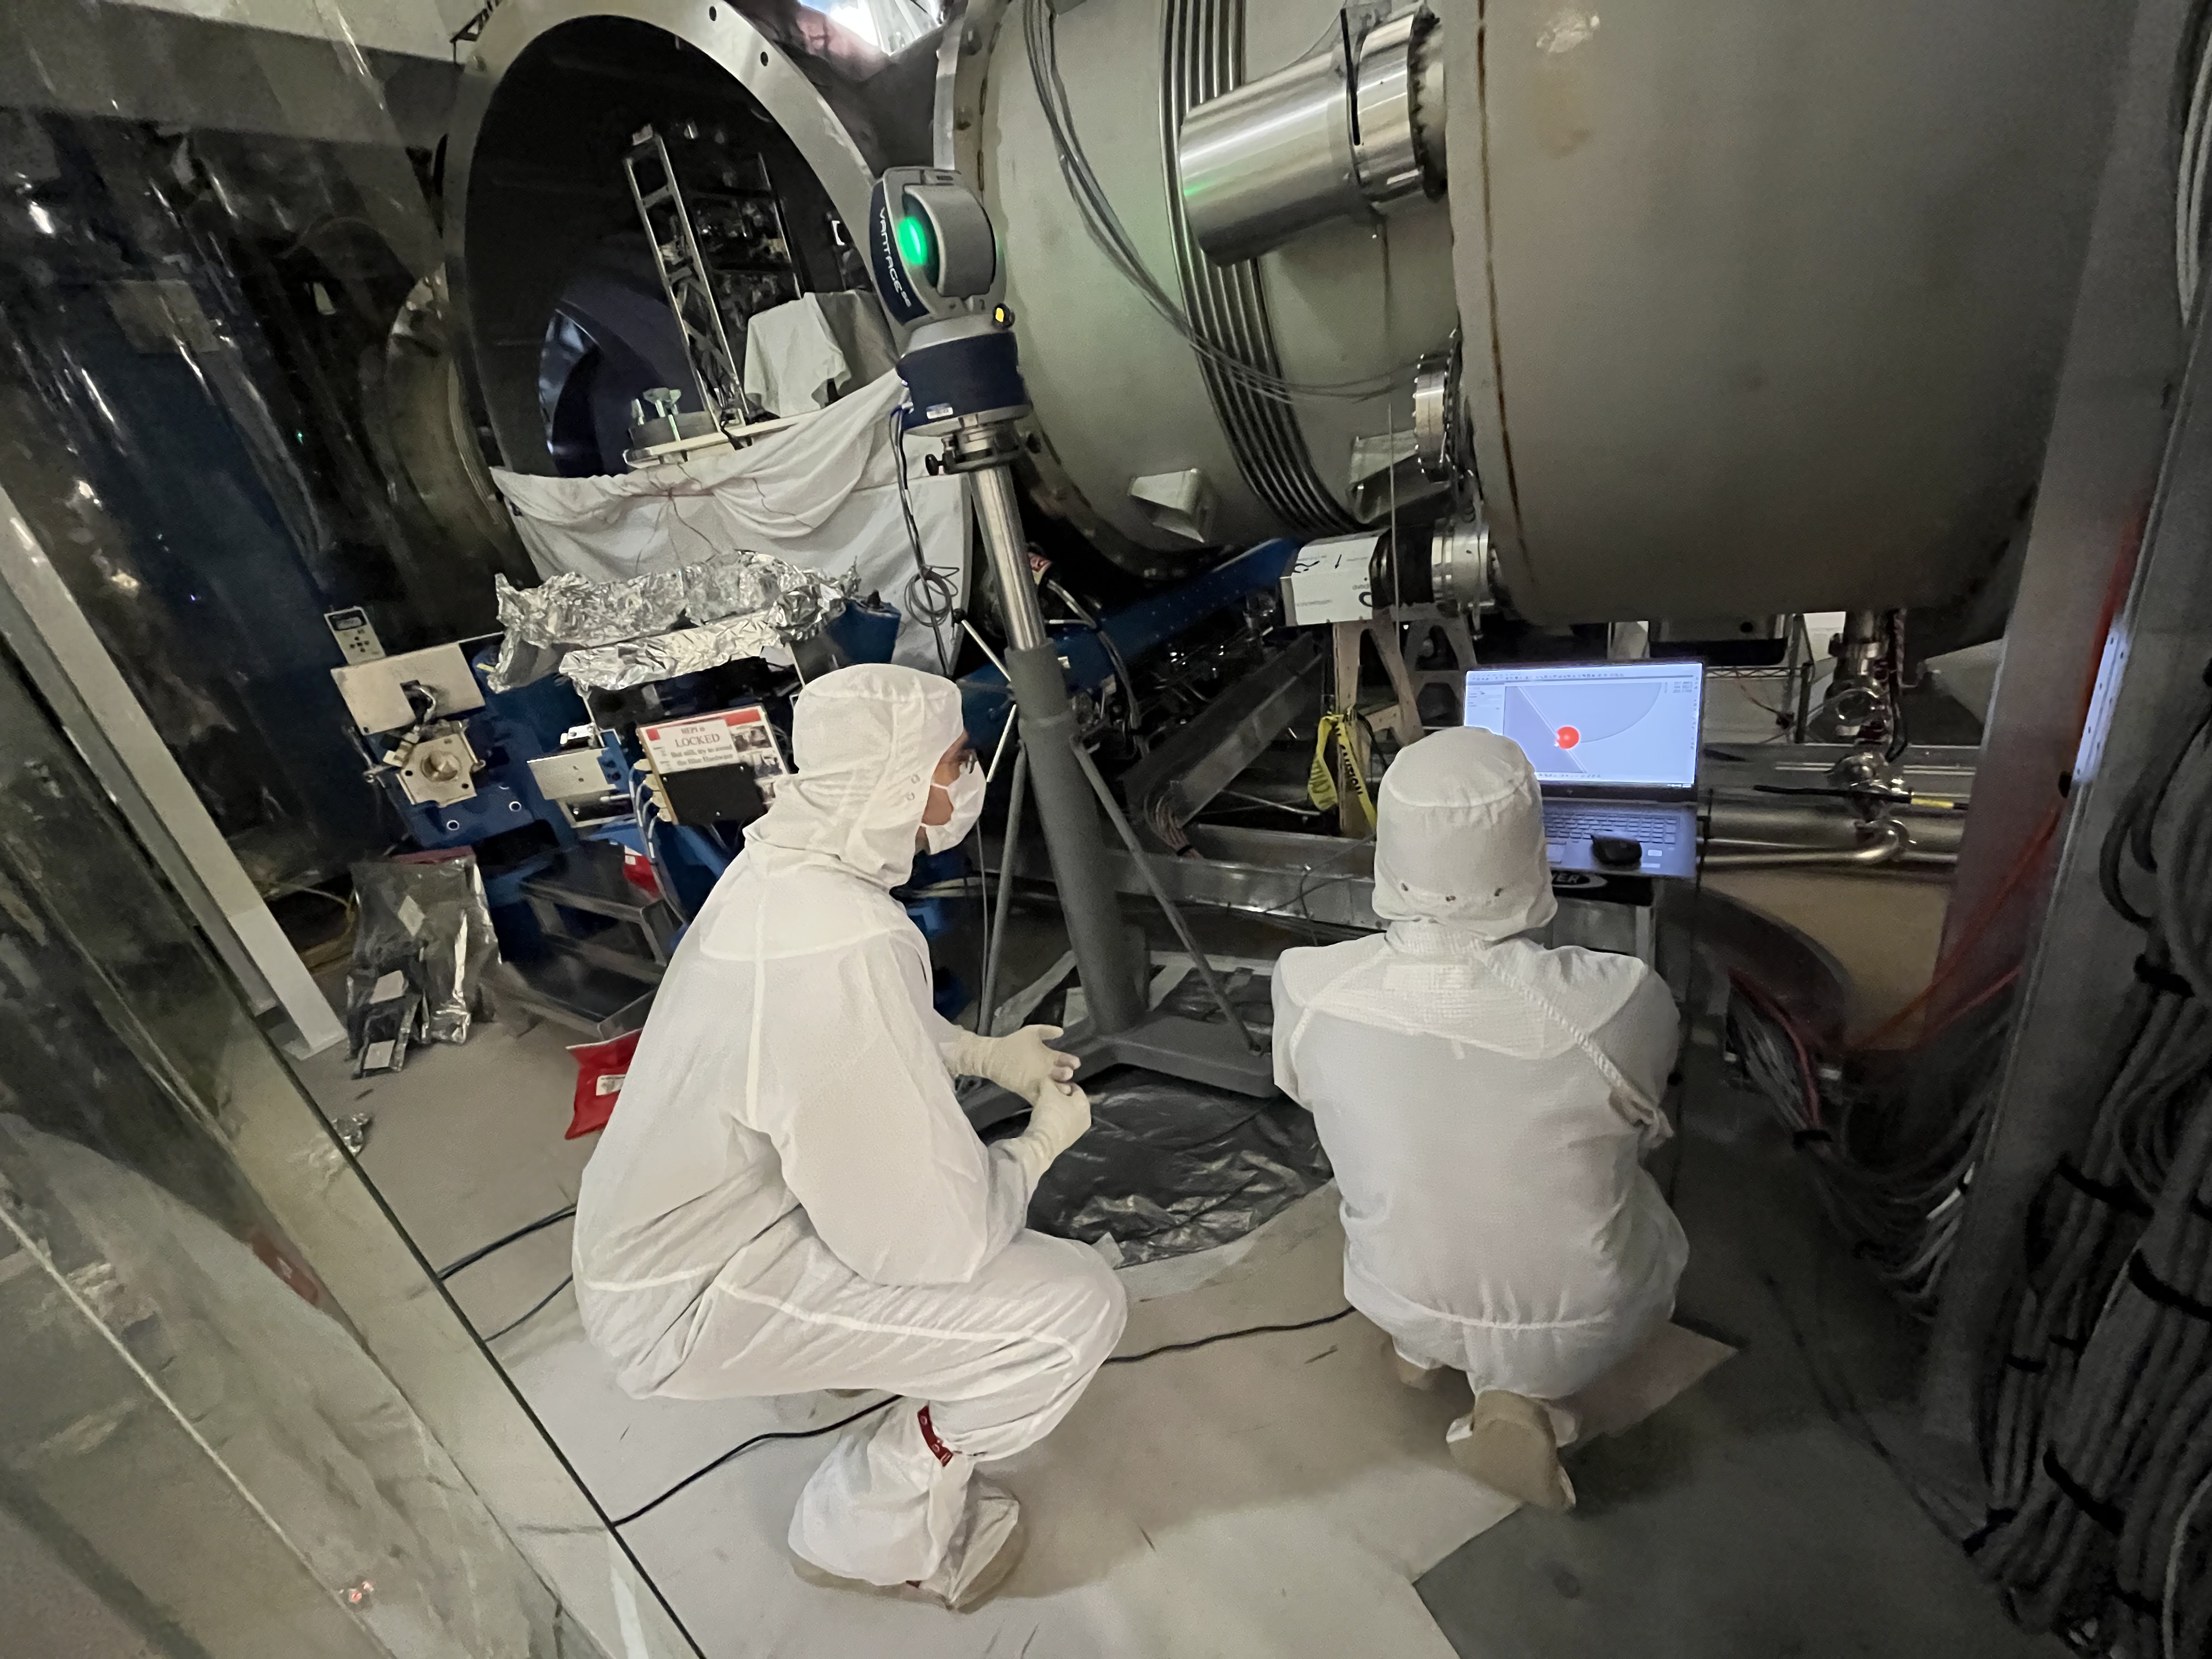
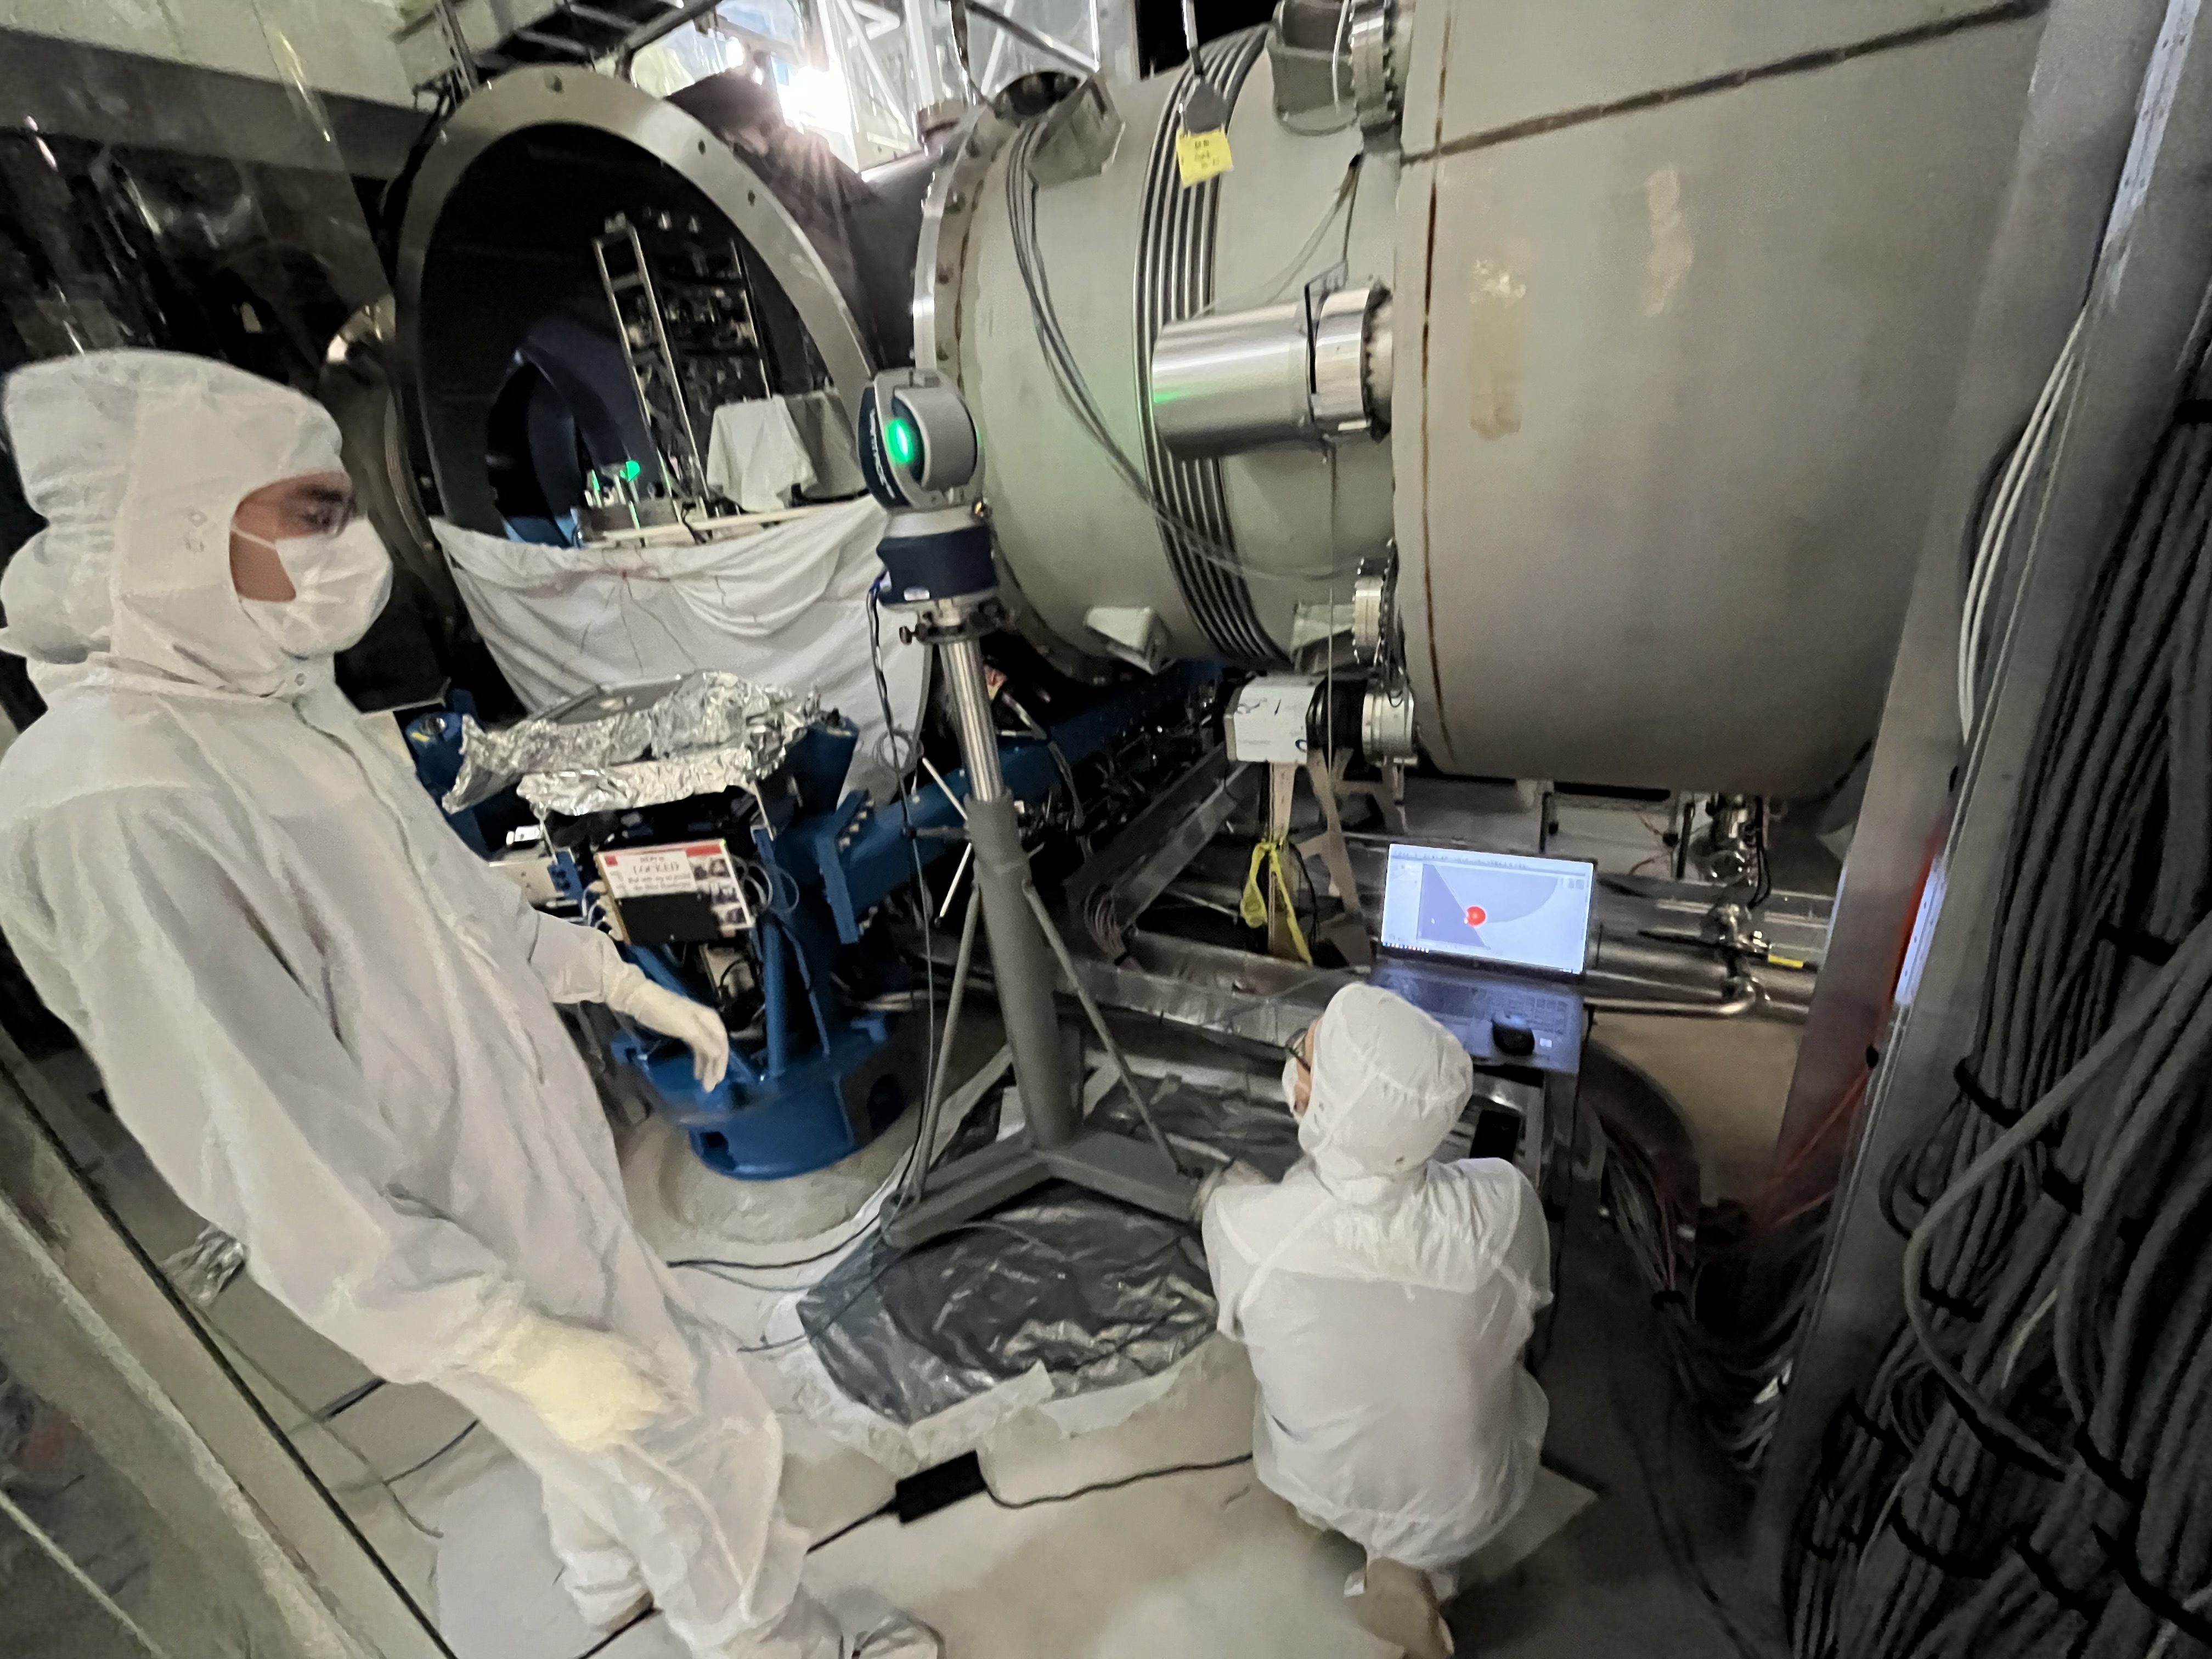
This week we surveyed the position of the components that reside in WBSC2: The BS SUS cage (BSS), the ISI optics table (ISI Stage 2), and the 2 ITM Elliptical Baffles.
BS and the SUS Cage
The first picture shows our FARO survey of points on the BS SUS cage, chiefly along the bottom of the main support structure. These were surveyed by holding the FARO SMR against the hole being measured; the PolyWorks software handles the compensation from the center of the SMR to the point being measured. As can be seen, each point is very close in both X and Y axis position, being less than 0.1mm from its nominal location. The Z axis deviations are larger, but the largest of them is just over 0.25 mm, so every point is well within the positioning specifications used during installation and alignment in 2013.
Line 1 in the picture was created from the first and last survey points and represents the pointing of the BS SUS cage; all angles are reported in degrees. Some things to note here: I'm using the Acute Angle datum in PolyWorks, which is the angle measured from the closest axis. For the HR surface normal of the BS, the X Acute Angle is measured from the -X axis, the Y Acute Angle is measured from the +Y axis, and the Z Acute Angle is measured from the +Z axis. Since Line 1 is roughly perpendicular to the surface normal of the BS HR face, the axes the angles measure from are changed: The X Acute angle is now measured from the +X axis, the Y Acute Angle is still from the +Y axis, and the Z Acute Angle is now from the -Z axis. In addition, since Line 1 is nominally perpendicular to the BS HR surface normal I would expect the X and Y Acute angles to be swapped (BS X Acute = Line 1 Y Acute; BS Y Acute = Line 1 X Acute), but they aren't exactly. This appears to be a small error in the CAD model, if we make the assumption that the BS HR surface and the HR side of the BS SUS cage are nominally pointing in the same direction. This does, however, change the deviations for the X and Y Acute angles for Line 1. The table below shows what the data for Line 1 should be:
| |
Nominal |
Measured |
Deviation |
| X Acute Angle |
44.9699 |
44.9073 |
-0.0626 |
| Y Acute Angle |
45.0301 |
45.0927 |
0.0626 |
| Z Acute Angle |
90.0000 |
89.9661 |
-0.0339 |
This means the BS SUS cage is yawed 0.0626°, or ~1.09 mrad, in the clockwise (CW) direction when looking from the top down (since Line 1 is closer to the +X axis than it should be). The Z Acute Angle represents a slight counterclockwise (CCW) roll of the SUS cage, when looking directly at the HR surface of the BS.
To attempt to better locate the BS in the IFO coordinate system, several measurements were taken with a ruler from points on the "Figure 8" section of the BS SUS cage to the BS optic itself. All measurments except one were done using a scale with 0.5 mm tic marks (so accurate to +/- 0.25 mm). The 10:00 "Figure 8 face to BS HR face" measurement had to be done using the side of the scale in inches, with 1/32" tic marks (so accurate to +/- 1/64") and then converted to mm (so accurate to +/- 0.4 mm). The measurements positions are listed like the BS HR surface is a clock, and assumes you are looking directly at the HR surface. The below table gives those results:
| |
Outside Edge of Figure 8 to BS optic edge (mm) |
Front face of Figure 8 to BS HR face (mm) |
| 3:00 (-X/-Y) |
6:00 (-Z) |
9:00 (+X/+Y) |
2:00 |
6:00 |
10:00 |
| Measurement |
49.0 |
48.75 |
48.5 |
24.75 |
27.0 |
26.2 |
| CAD Nominal |
49.0 |
49.0 |
49.0 |
26.2 |
26.2 |
26.2 |
| Deviation |
0.0 |
-0.25 |
-0.5 |
-1.45 |
+0.8 |
0.0 |
The BS sits decently centered in the Figure 8 portion of the SUS cage, a little bit low and to the +X/+Y side. I would say not as much horizontally as it looks from the table, given the inherent error with reading the scale (the BS is not wider than its 370.0 mm specification, it's actually 0.15 mm narrower at 369.85 mm). The pointing implied by this measurement, however, is more than a little alarming. The 2:00 and 10:00 measurements show a significant yaw of the BS optic w.r.t. the SUS cage, and in the same direction as the yaw of the SUS cage as measured by the FARO. There is ~320.0 mm between the 2:00 and 10:00 positions on the BS, so that 1.45 mm difference in depth is a 4.53 mrad CW yaw. When added to the CW yaw of the SUS cage, this measurement shows that the BS optic is yawed 5.62 mrad CW from its nominal yaw. Even assuming the errors fall in our favor (so the 2:00 at 25.0 mm and the 10:00 at 25.8 mm), that's still a 3.59 mrad CW yaw (2.5 mrad BS and 1.09 mrad SUS cage). In addition, the 6:00 measurement implies a significant downward pitch of potentially several mrad, although with no way to measure the top of the optic we can't actually measure it. I have to be honest, I'm having a very hard time believing this measurement; we will revisit this once the BS cartridge has been moved to the test stand, where we have a better field of view for the FARO, more room to work and much better lighting around the BS, and can take direct measurements of the BS position and pointing using a total station and laser autocollimator (although there is no guarantee that the optic will be pointing in exactly the same direction after being craned across the LVEA). More to come on this.
ISI Optics Table
The second attachment shows the ISI positions as measured by the FARO. I've corrected the Z axis positions for the length of the rod we use to hang the SMR from the ISI so they give a better idea of the Z axis position. Not much can be said here, as LLO discovered that while these rods are good for measuring the Z axis position, they are not at all good at measuring X and Y. This makes sense as they were designed to be accurate in length and only length, so there's no guarantee that X and Y are repeatable. We plan on measuring the X and Y errors of this particular set of rods in the coming days (align to a table with a known hole pattern, attach the rod and measure with the FARO, repeat multiple times to see how the X and Y positions change). For now, we can say that the ISI is lower on the -X side vs the +X side, and lower on the +Y side vs the -Y side. I'm not alarmed by the deviations in Z axis position, as this ISI was supposed to be lower by ~2.5 mm (to place the BS in proper Z axis position, since it's lower in the IFO coordinate system but the SUS is the same length as the QUADs), but this was never captured in the CAD files.
ITM Elliptical Baffles
The final four attachments show our survey of both ITM elliptical baffles. Our view of the baffles and available fiducials to take measurements from were both limited, but we can say a few things.
ITMx Elliptical Baffle
We were able to get two points along the +Y bottom edge of the baffle, a single point along the +Y top edge, and single point near the center of the -X bottom edge of the baffle. From this I made a couple of planes that represent the +Y and bottom sides of the baffle and are shown in the third and fourth attachments; I, J, and K are the direction cosines of the surface normal of the plane, while the listed angles are the angle from the surface normal to the +X, +Y, and +Z axes. Interestingly, the point on the top edge looks very well aligned, within 1.0 mm all around, while the points along the bottom of the baffle are all low by several mm. In addition, there appears to be a significant upward pitch to the baffle. Jim did note that when attaching the transport bracket he had to push the baffle in the +X direction to clear ~0.5 mm at the point where the bracket attaches to the suspended portion of the baffle. This point is roughly 476 mm away from the baffle's suspension blade, so this is an ~1.05 mrad angle. Applying this same angle along the bottom of the baffle box gives an ~ -0.33 mm Z axis move of that bottom -X edge of the baffle, so this does not account for the measured deviation. In addition to the pitch, the bottom plane also shows a large roll (CCW when looking at the ITMx in WBSC3), while the side plane shows a large yaw (CCW when looking from the top down). We know these baffle panels aren't exactly straight, so it's hard to say if this significant pointing is also present on the elliptical hole of the baffle (we couldn't see it, so we couldn't measure it directly).
ITMy Elliptical Baffle
Similar to the ITMx baffle, we were only able to get a handful of points along the -X side and the bottom of the baffle. I made planes from these points representing the -X side and the bottom of the baffle (fifth and sixth attachments). As seen with the ITMx baffle, the points along the top of the baffle all look good while the points on the bottom are too low by several mm. There is a significant upward pitch to this baffle as well, as well as a large roll (CCW when looking at ITMy in WBSC1) and yaw (CCW when looking from the top down), although none are as large those as seen on the ITMx elliptical baffle. Again, we could not see the elliptical hole in the baffle to measure it, so we can't say if this pointing is an artifact of the panels or also present on the actual baffle portion of the baffle.
This completes our in-chamber measurements of the WBSC2 cartridge assembly, and closes LHO WP 13171.
I also want to note, Ryan and I also preformed some in-chamber FARO measurements in WHAM3 (ISI, MC2 SUS cage, PR2 SUS cage, MC2 and PR2 baffles) on April 10th; I will post those as soon as I get a chance to process the data in PolyWorks.


