Members of the Stochastic Group have expressed interest in magnetic coupling for estimates of Schumann Resonance coupling during O2. Automated coupling functions for all injections are not quite ready to be posted at pem.ligo.org, so we are going ahead and posting site-wide magnetic coupling functions from the August 2017 PEM injections here.
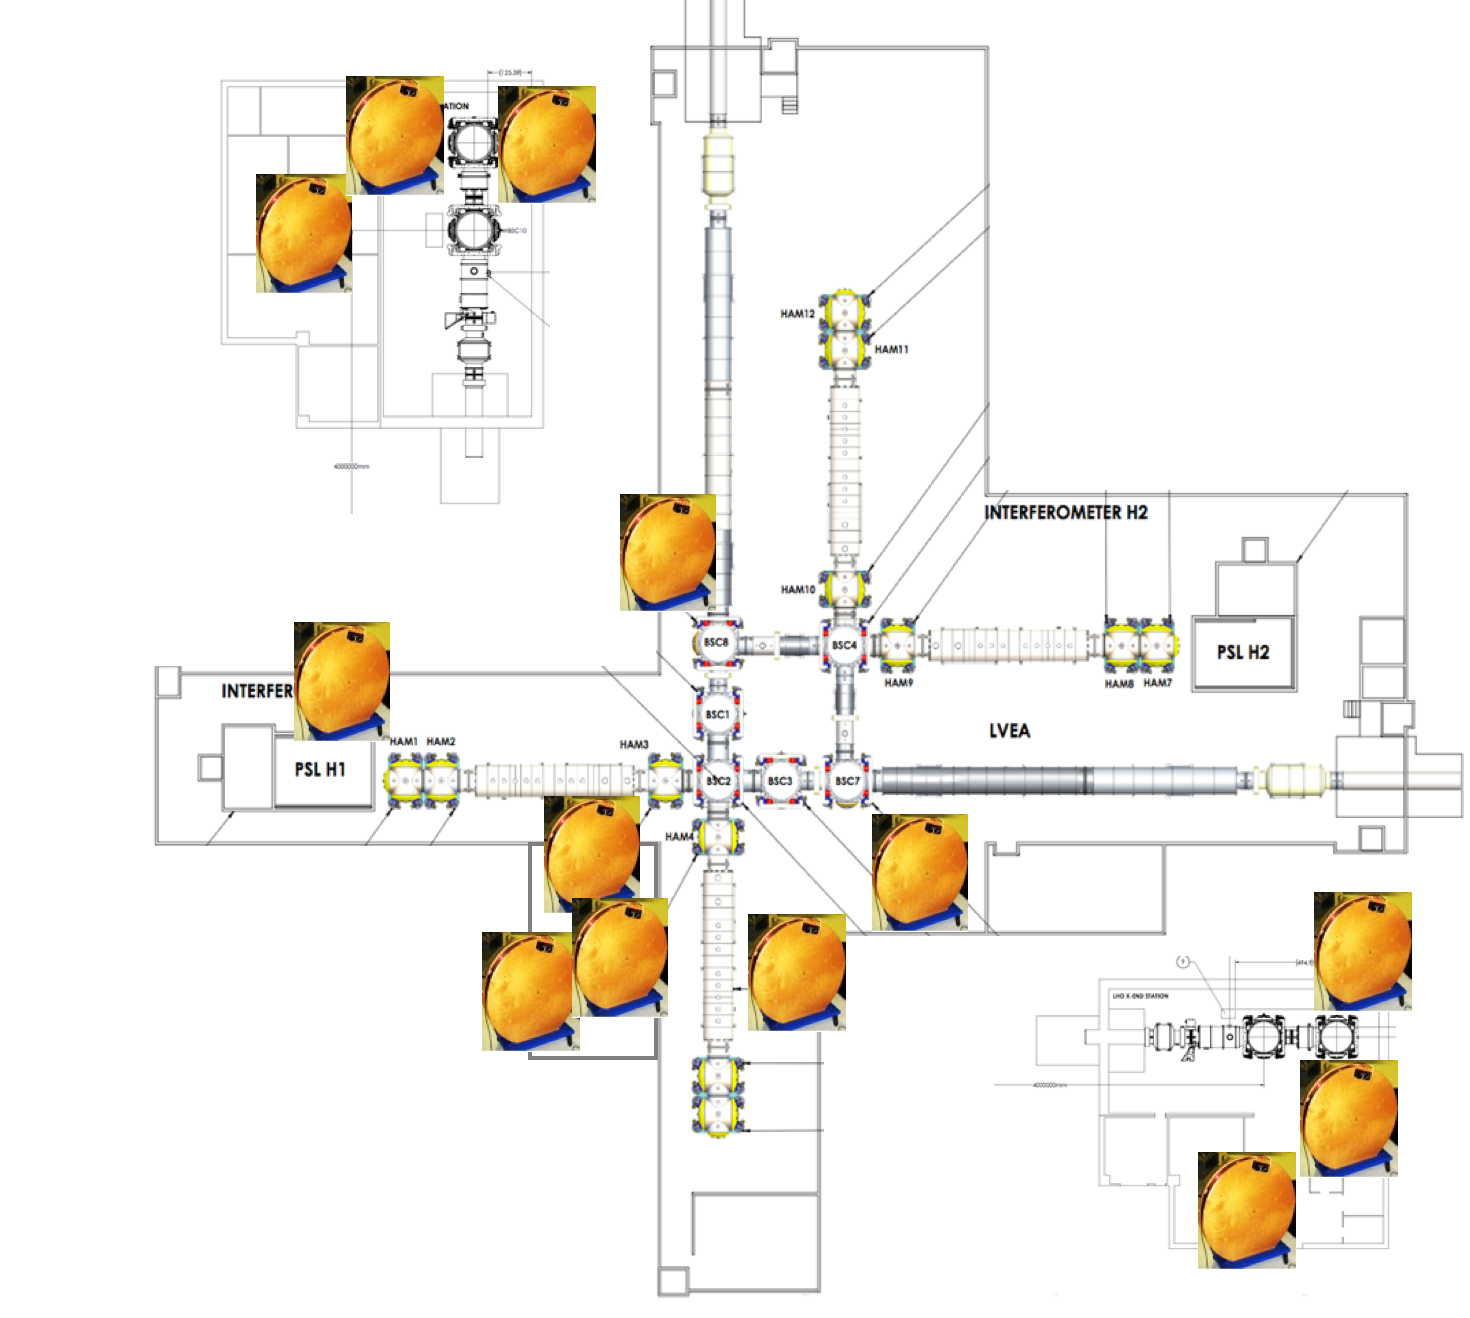
Magnetic field injections were made at multiple locations in all 3 LVEA/VEAs and electronics rooms. The LHO injection locations are shown in the first figure below and the injection locations at LLO are similar. The code (started by Julia Kruk and completed by Philippe Nguyen) used the following procedure:
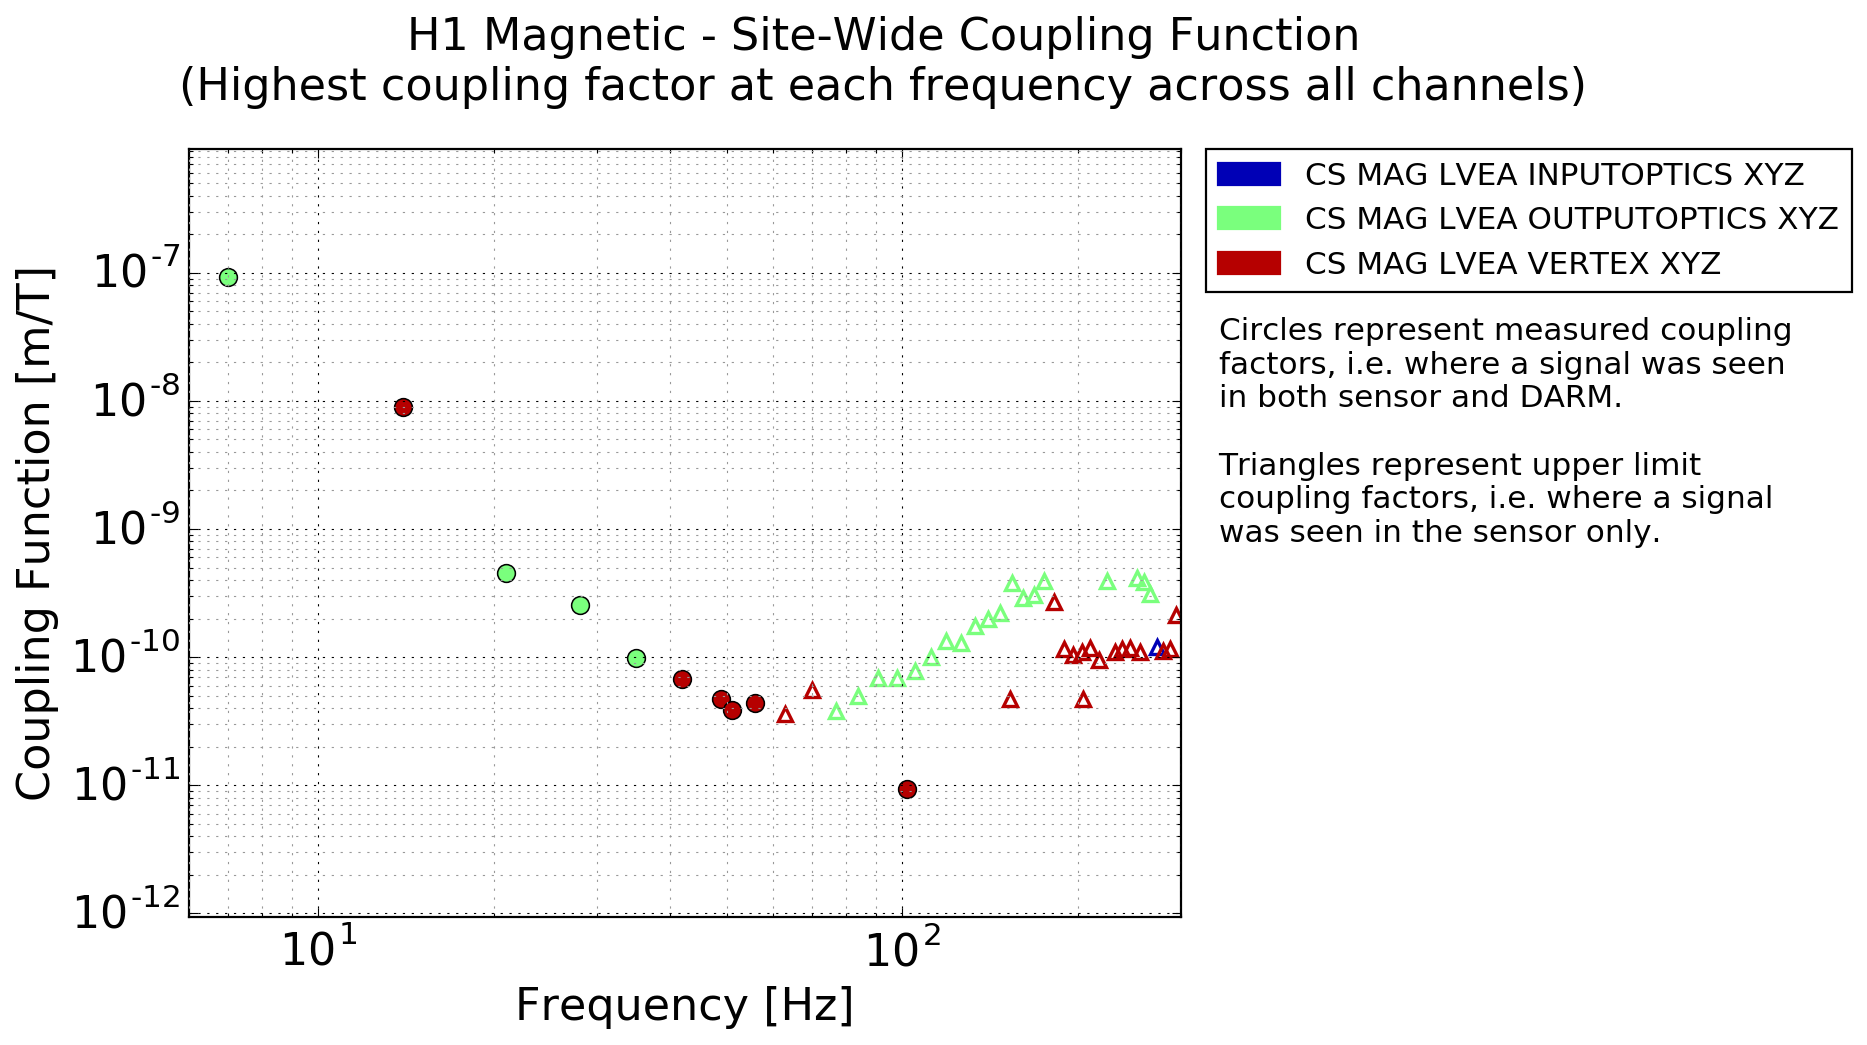
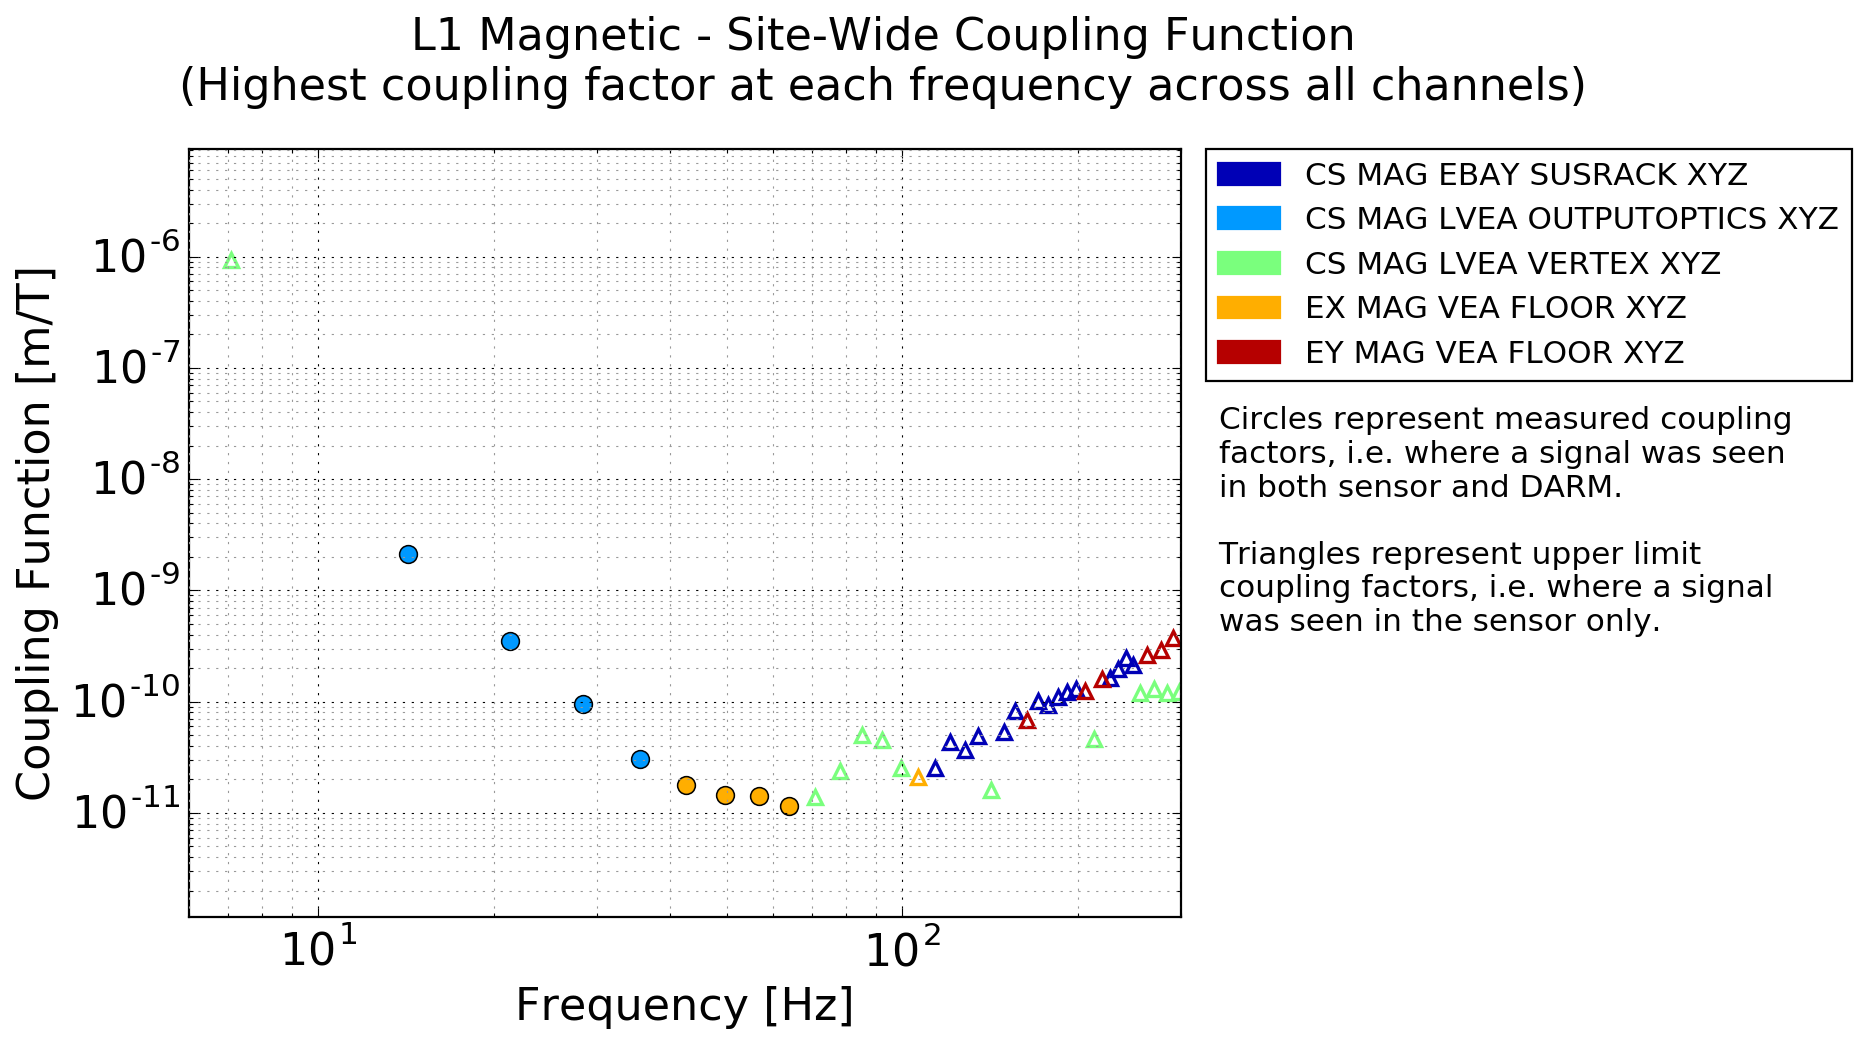
1) Coupling functions (meters of DARM per Tesla) were calculated for each magnetometer (the quadrature sum of the axes), for each of multiple injections in the local area (LVEA/VEA or electronics bay). The coupling function is the DARM signal divided by the magnetometer signal.
2) The coupling functions for each injection for each sensor were narrowed down to a single coupling function for each sensor by picking the minimum coupling factor at each frequency. Selecting the minimum coupling factor eliminates excessively high upper limit coupling factors for sensors that are far from the injection and coupling sites and thus detect small fields for large DARM signals.
3) For the site-wide maximum coupling function given here, the maximum coupling factor at each frequency is picked from the coupling factors for all of the sensors on the LHO/LLO site.
Of course, site coupling will be the combination of coupling at all coupling locations within each site - this is just the largest of these at each frequency. We think that the largest coupling factor is probably a fair estimate for the site because other coupling locations with lower couplings can increase or decrease the overall coupling. But the coupling functions here could be multiplied by a factor like sqrt(2) to be conservative.
Other issues:
There was a large change in magnetic coupling during O2 at LHO, as noted in: https://dcc.ligo.org/DocDB/0144/G1701613/002/GenevaTalkSm.pdf , and we don’t know when it happened. I think that, as Schumann Resonance coupling becomes more important, we should probably push for a continuous magnetic injection at each station, like a calibration line, or at least weekly injections. Back when our magnetic coupling was dominated by permanent magnets on the test masses, it didn’t change for years. But now we tend to be dominated by coupling to cables, and this can change dramatically as electronics and cables change. After talking with Richard M., my best guess is that the change happened May 16th when the ITM ESD power supplies were changed, but that is just a guess. For S3 it might be a good idea to set up a single continuous line injection at the LHO corner station in order to better study coupling variation.
Another consideration for Schumann Resonances is the eddy current shielding due to the steel skin of the buildings. This is not included in these coupling functions because the injection was from within the building. We should measure this, but assuming it is the same as for a chamber, it would be about: 1/sqrt(1 + (f/20)^2), or a factor of 0.93 at 8 Hz and 0.55 at 60 Hz.
Philippe Nguyen, Julia Kruk, Anamaria Effler, Robert Schofield