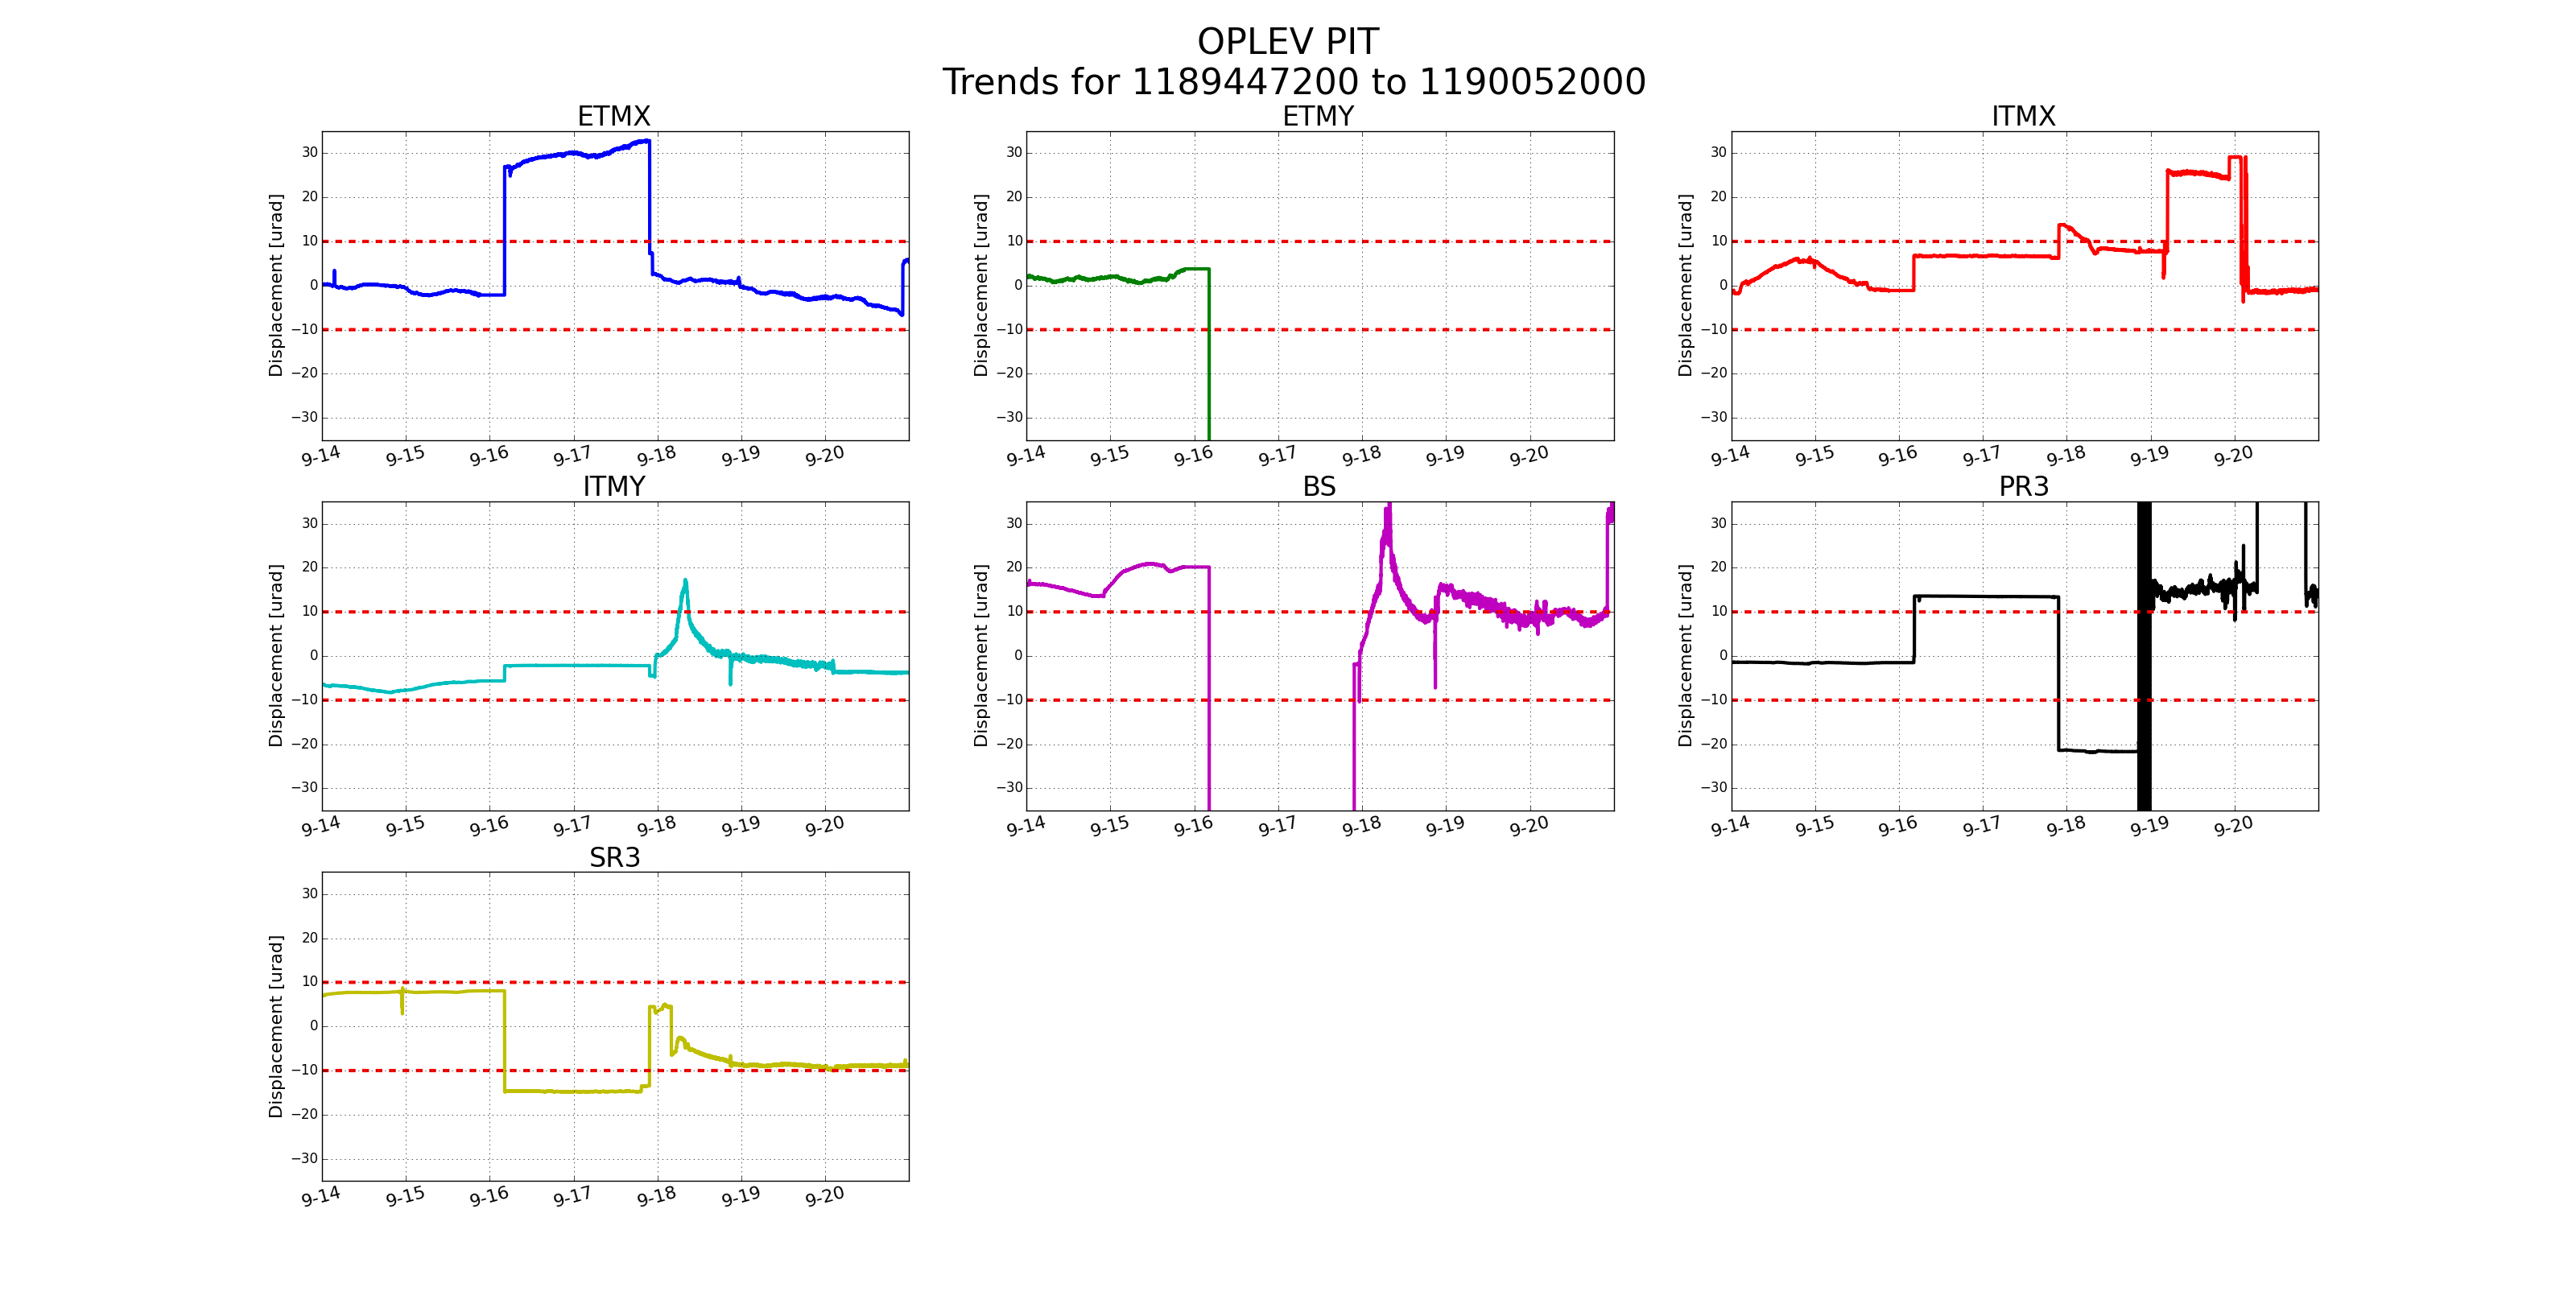
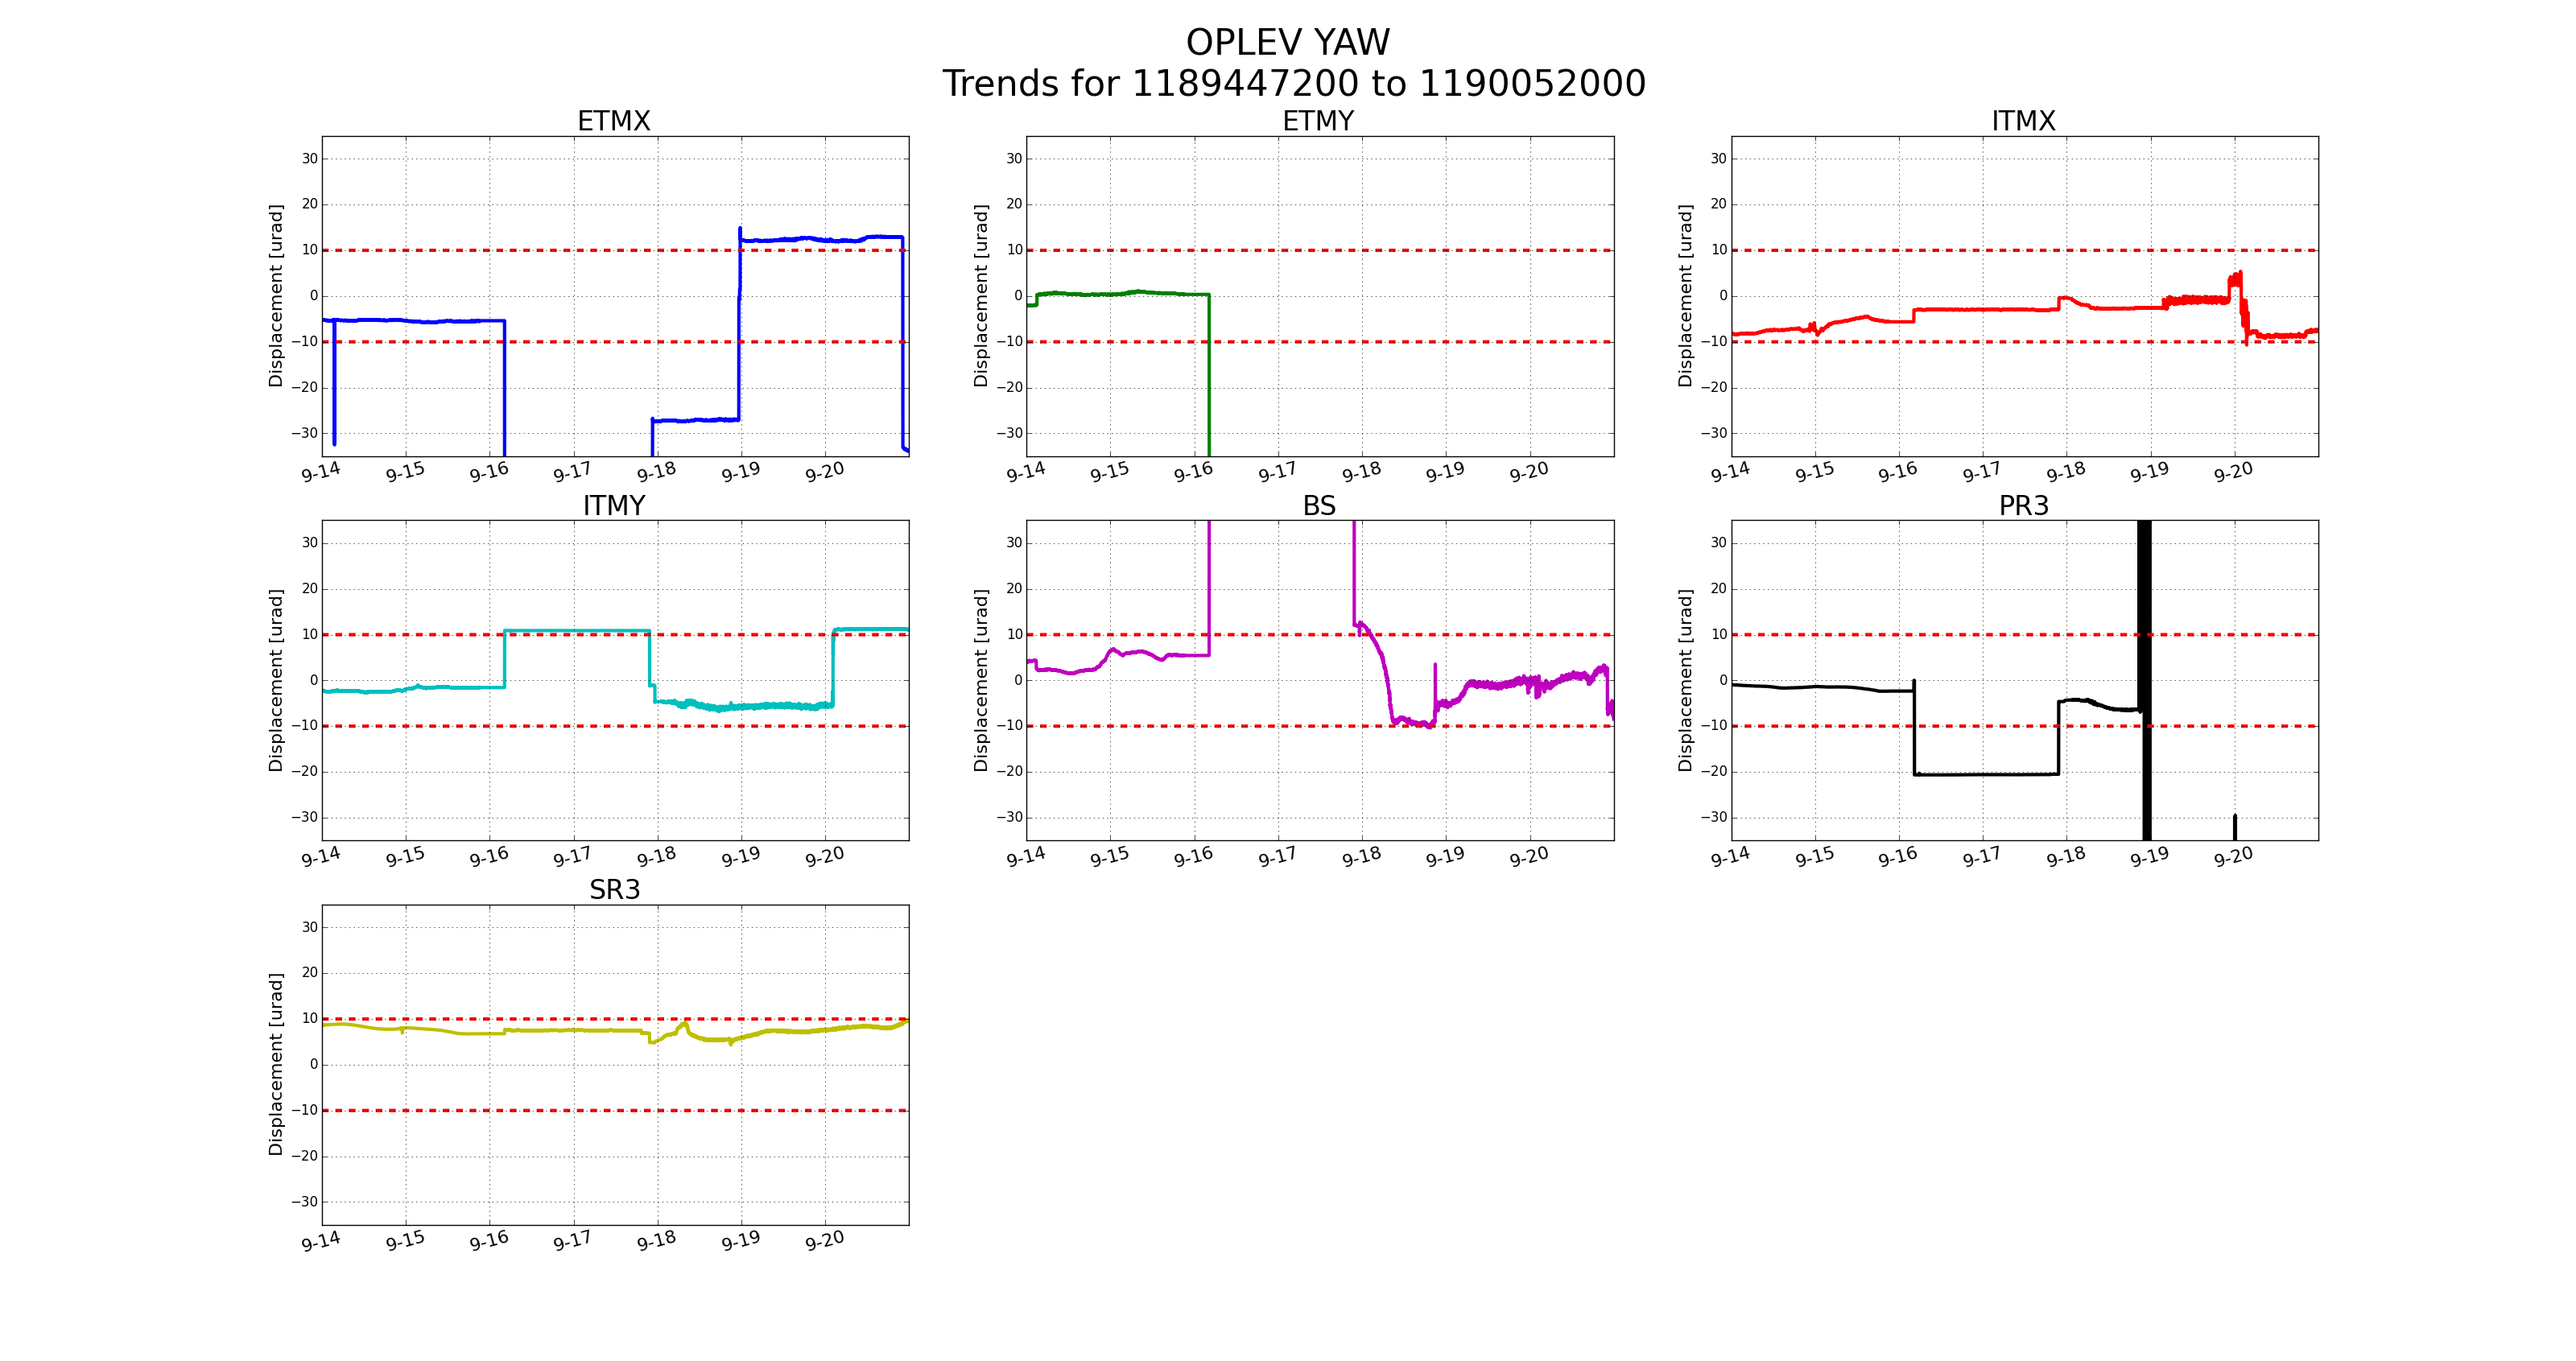
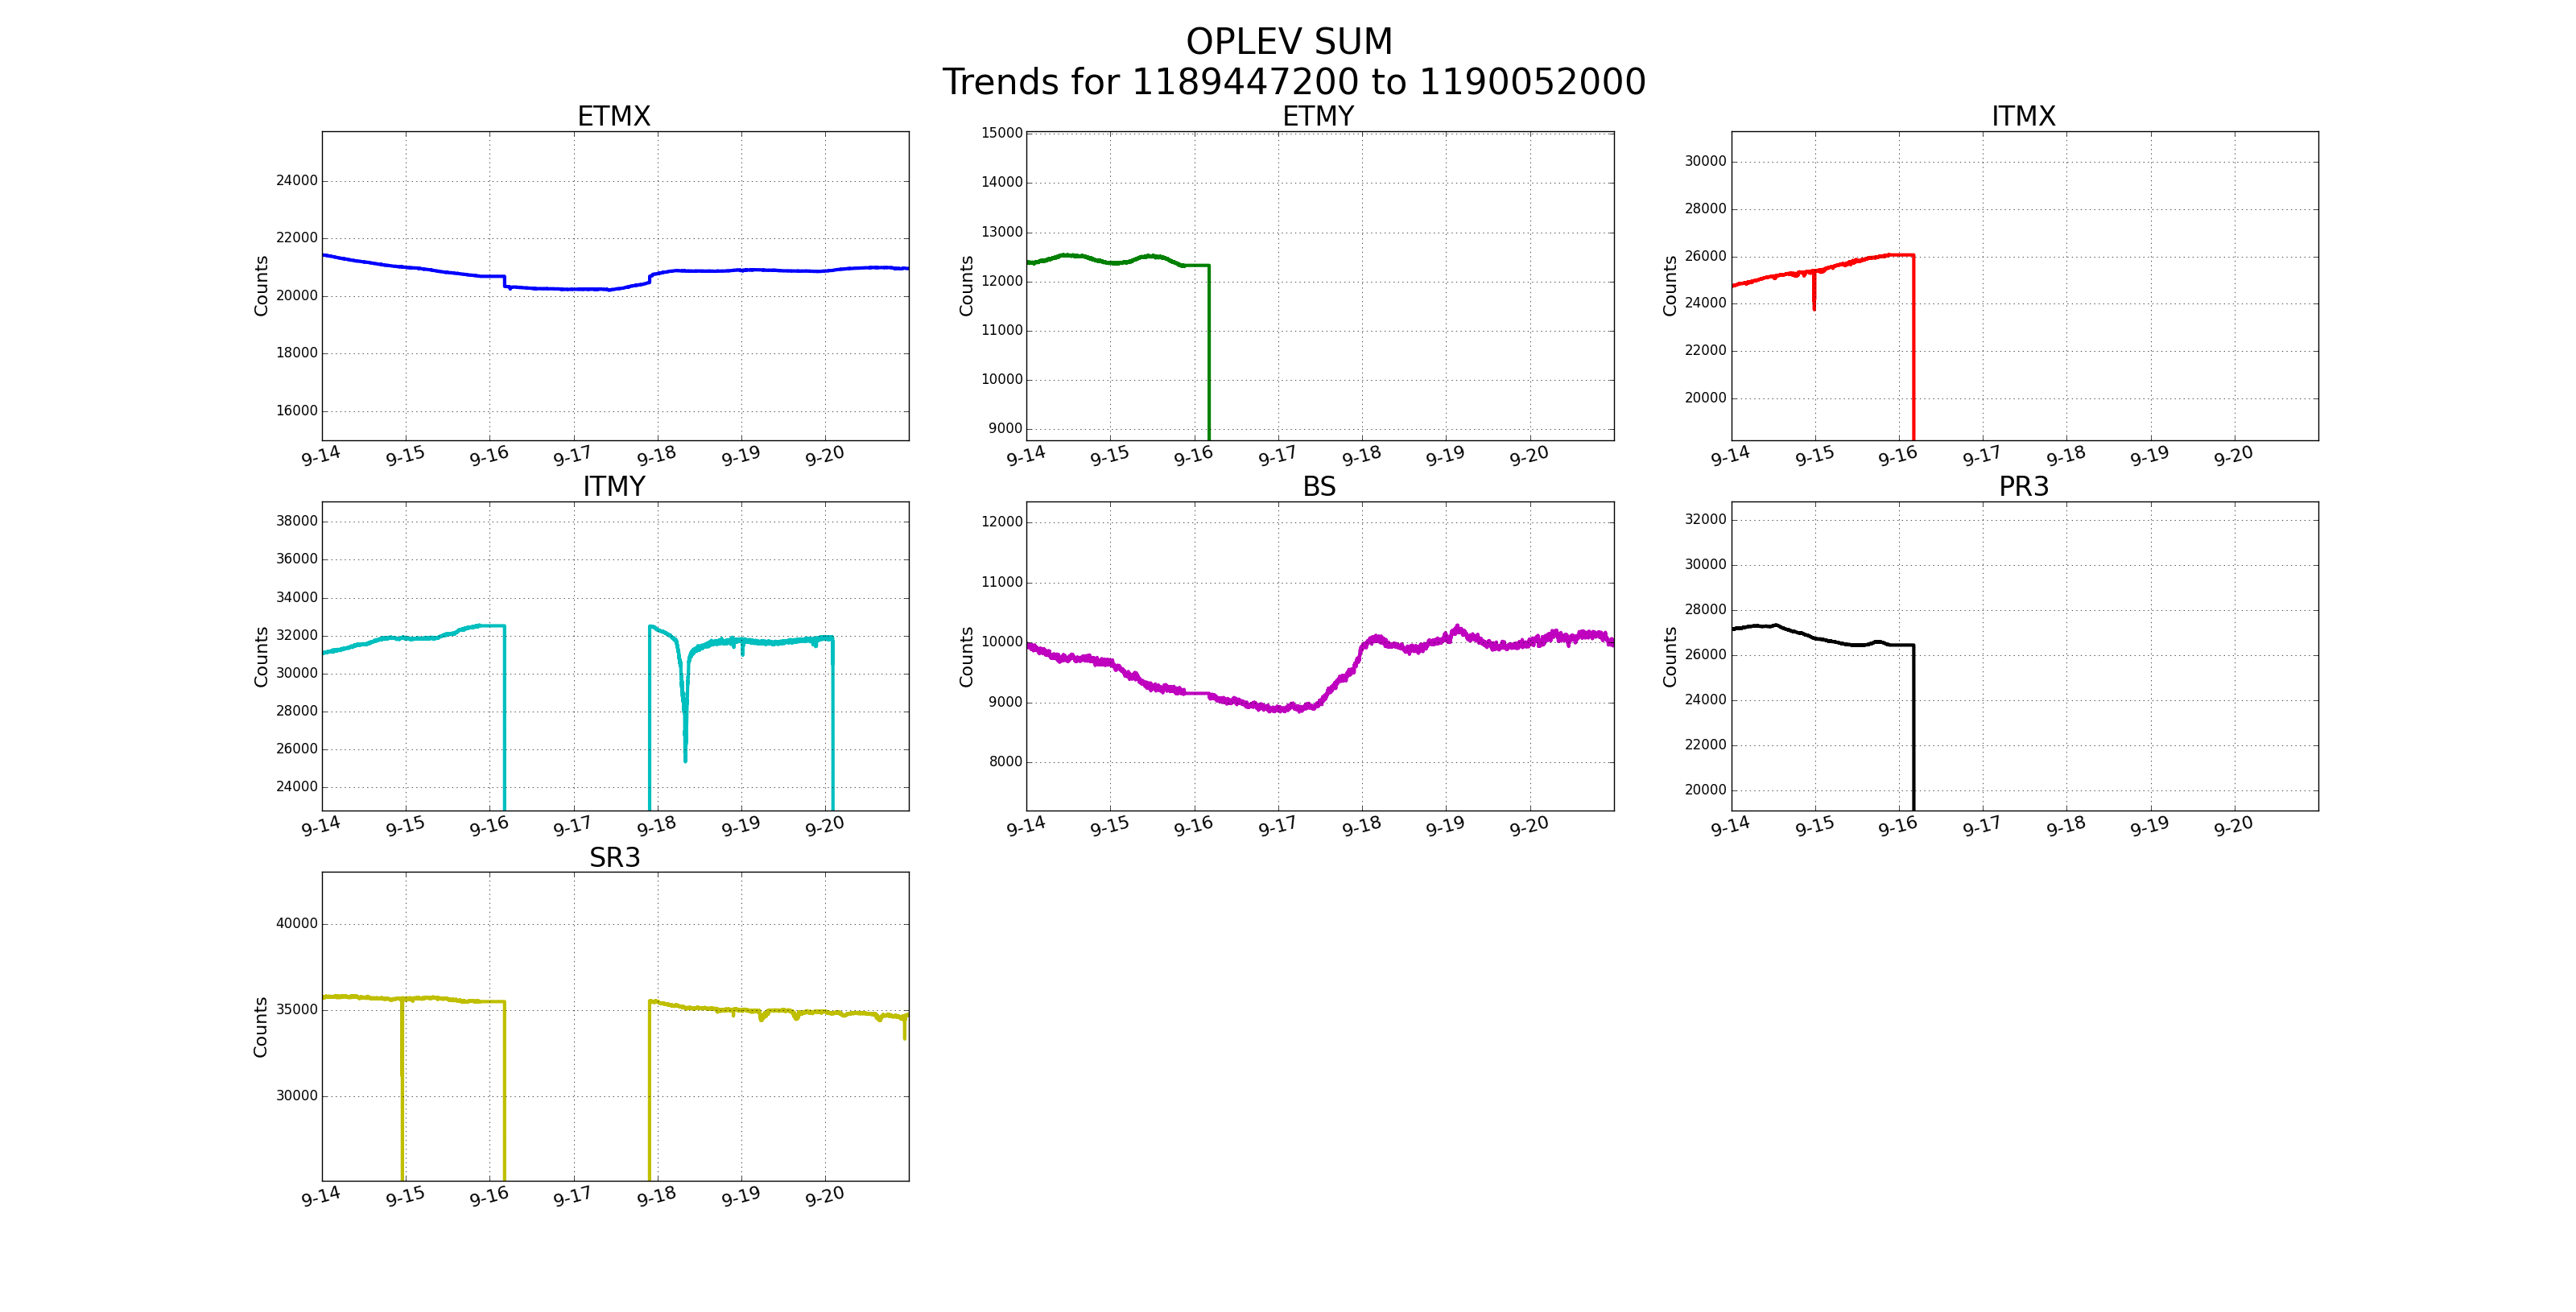
patrick.thomas@LIGO.ORG - posted 12:07, Thursday 21 September 2017 (38734)
Optical Lever 7 Day Trends
FAMIS 4746
Images attached to this report
FAMIS 4746
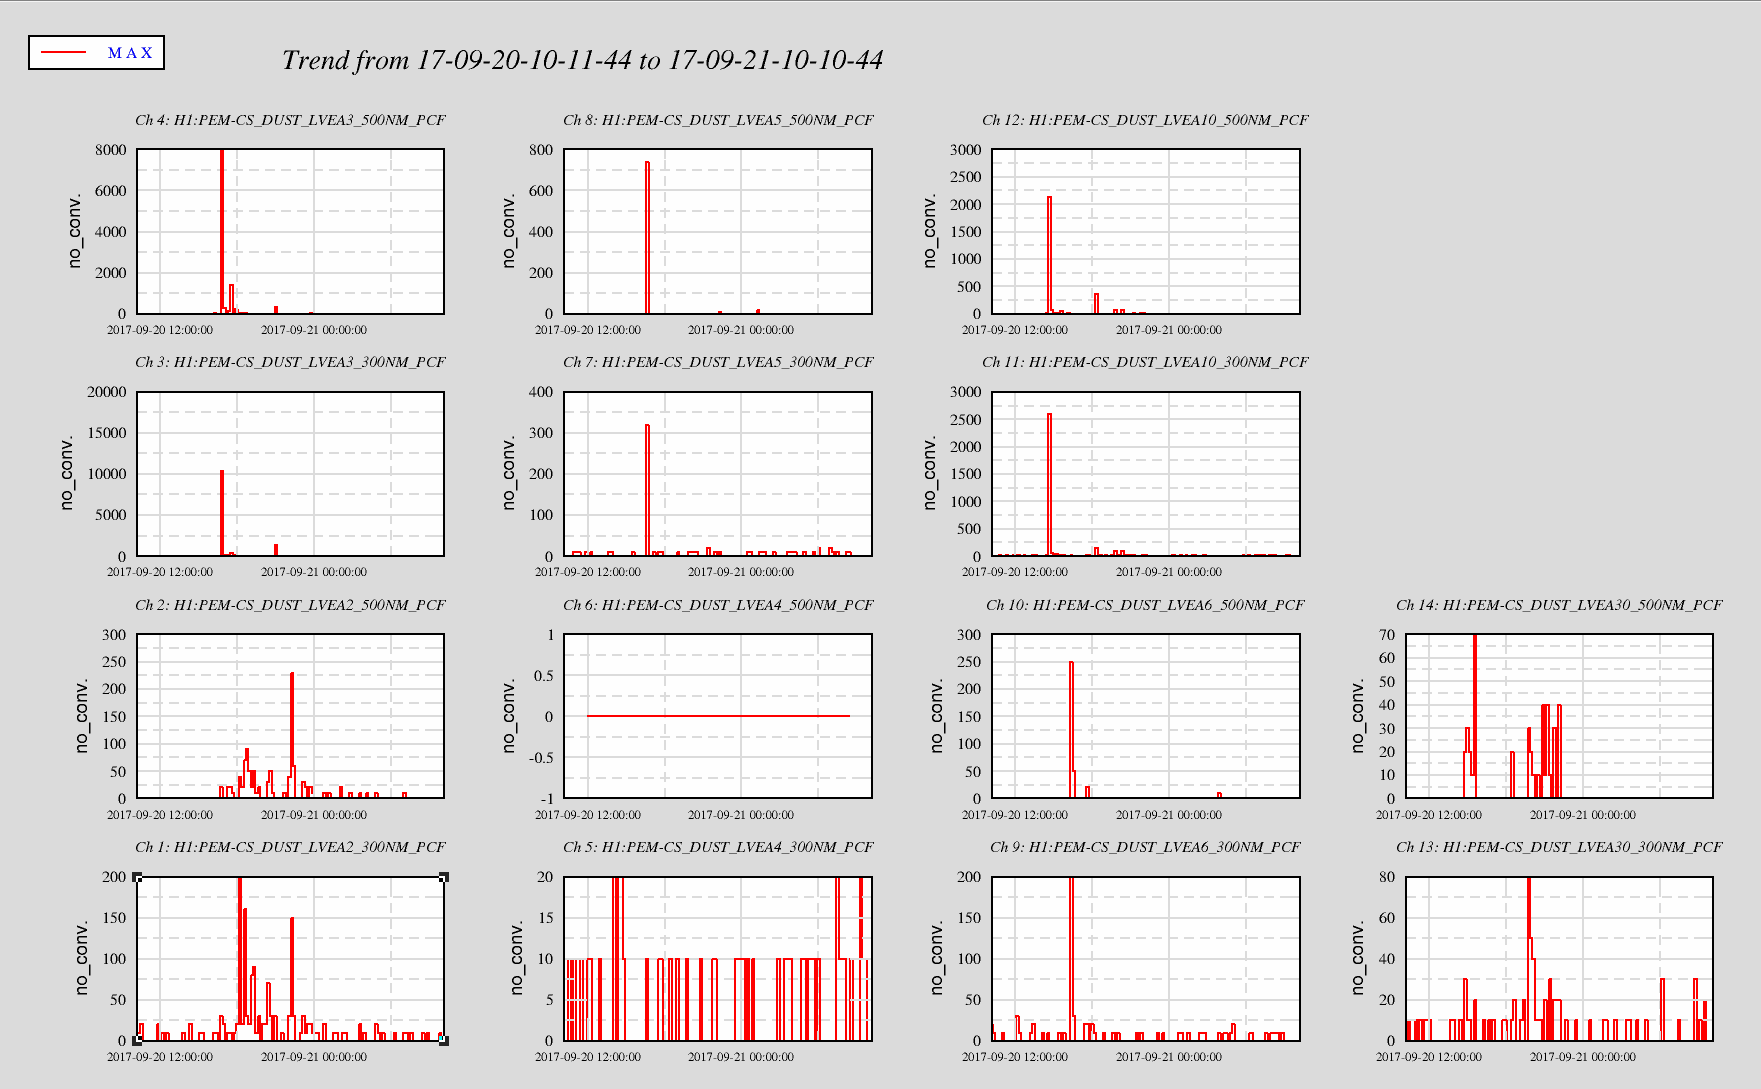
Attached are the plots and data summaries for the 7 dust monitors running in the LVEA. In general the counts are very low. The spikes (specificity HAM3 0.5u counts) are associated with major door removal work or cleaning in the chamber. At this time the LVEA and cleanrooms in the LVEA are looking clean.
Measured the output power of the NPRO with an Ophir 20C-SH power meter (S/N 171175) to be 1.82 W.  This was
measured before the phase correcting EOM.
  1.82 W corresponds to 1.097 V on photodiode (-1797 counts)
     0 W corresponds to 0.068 V on photodiode (-111 counts)

    Pulling up the filter MEDM screen (H1PSLPMC_PWR_NPRO.adl), INMON was ~ -1765 counts.  So ~ -32 counts
were "missing".  I changed the offset to reflect this value.  The gain was taken to be -0.00101263150
(ie 1.82 W 1797 counts /).

    With these changes, the laser MEDM screen displays a value for the output power of the NPRO close to
the value measured with a power meter.
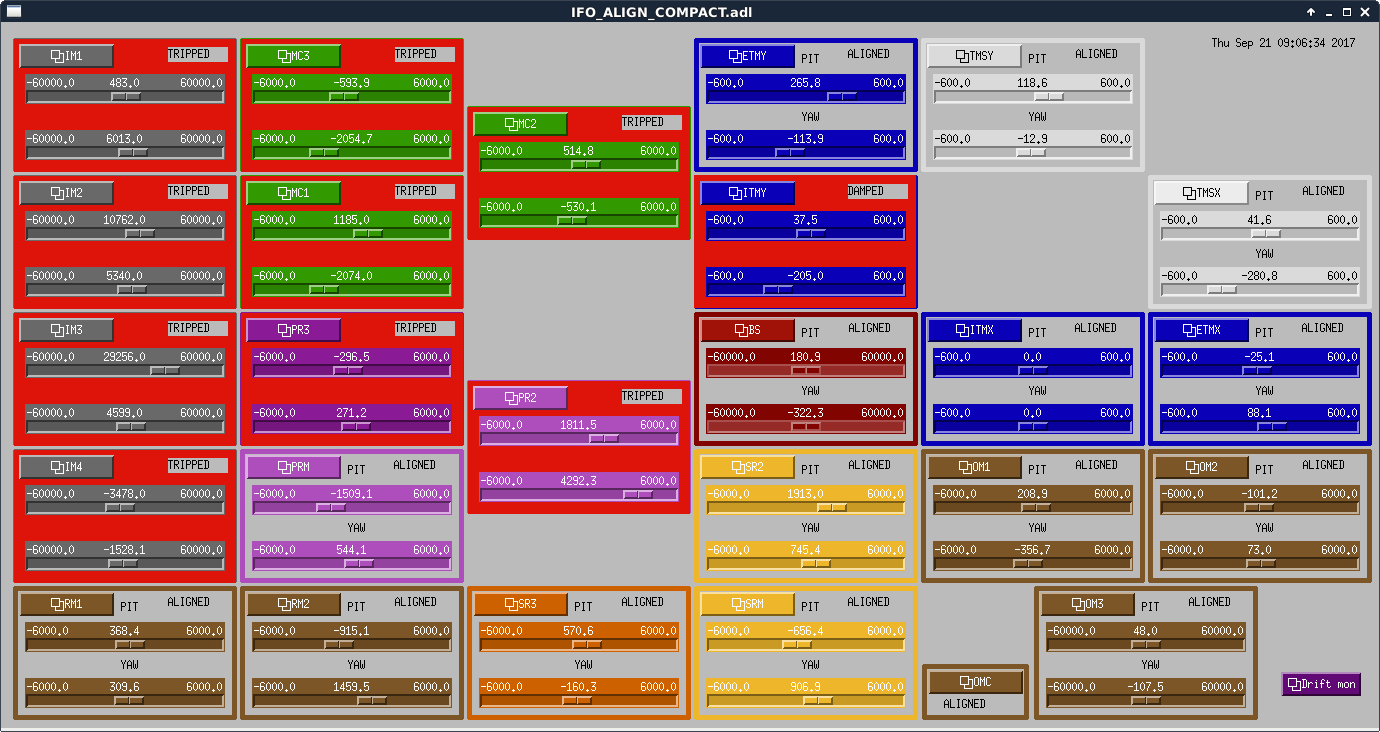
Per request I have burtrestored the SUS alignment offsets. I set them to Aug. 24 2017 at 20:10:00 UTC because it appears from trends of H1:ODC-OPERATOR_OBSERVATION_READY and H1:CDS-SENSMON_CAL_SNSW_EFFECTIVE_RANGE_MPC that we were in observing at that time.

patrick.thomas@zotws3:/ligo/cds/lho/h1/burt/2017/08/24/20:10$ burtwb -f h1ifoalignepics.snap

I then zeroed the offsets for ITMX.

The first image is a screenshot of the offsets before the burtrestore. The second image is a screenshot of the offsets after the burtrestore and zeroing ITMX.

I just turned off the HVAC in the north end of the H-2 electronics room and closed the door. I will monitor the south room for temperature change throughout the day.
(Sheila Daniel)
We started setting up the squeezer bay for table assembly. Both ISCT6 and SQZT6 have been moved there earlier.
A temporary cable tray will be needed between the SQZ-R1 rack and the squeezer bay to support testing.
We mounted the feedthrough panels. The only two missing ones were the CLF/OPO fiber panel and one picomotor feedthrough, D1101691. Still looking for the later. Corey ordered the missing posts for H1 to support the rack mounting on top of the table. We are in the process of rewiring the LED lightening power to use the interlocks/lighting feedthrough panel.
With (6) ea, chamber doors removed and with (6) ea. soft covers in place, the Kobelco air compressor duty cycle is

270 seconds LOADED vs 18 seconds UNLOADED = 94% df.

This isn't, necessarily, unexpected but I noticed that the load/unload thresholds don'tt appear to be dictated by the receiver tank's pressure.  I'll investigate tomorrow, but my recolection is that the compressor should load at a receiver tank pressure of  80psi and unload at 110 psi.  This wasn't happening while I was observing a few cycles this evening.  Instead, the unloading appeared to be based on elapsed time as opposed to receiver tank pressure.

I surveyed the open chambers and all soft covers are on and in-chamber work seems done for the day, so I reduced the purge flow a bit.
Vent progress today:
HAM2 (Hugh, Kissel, Jim, Rick, Sheila)
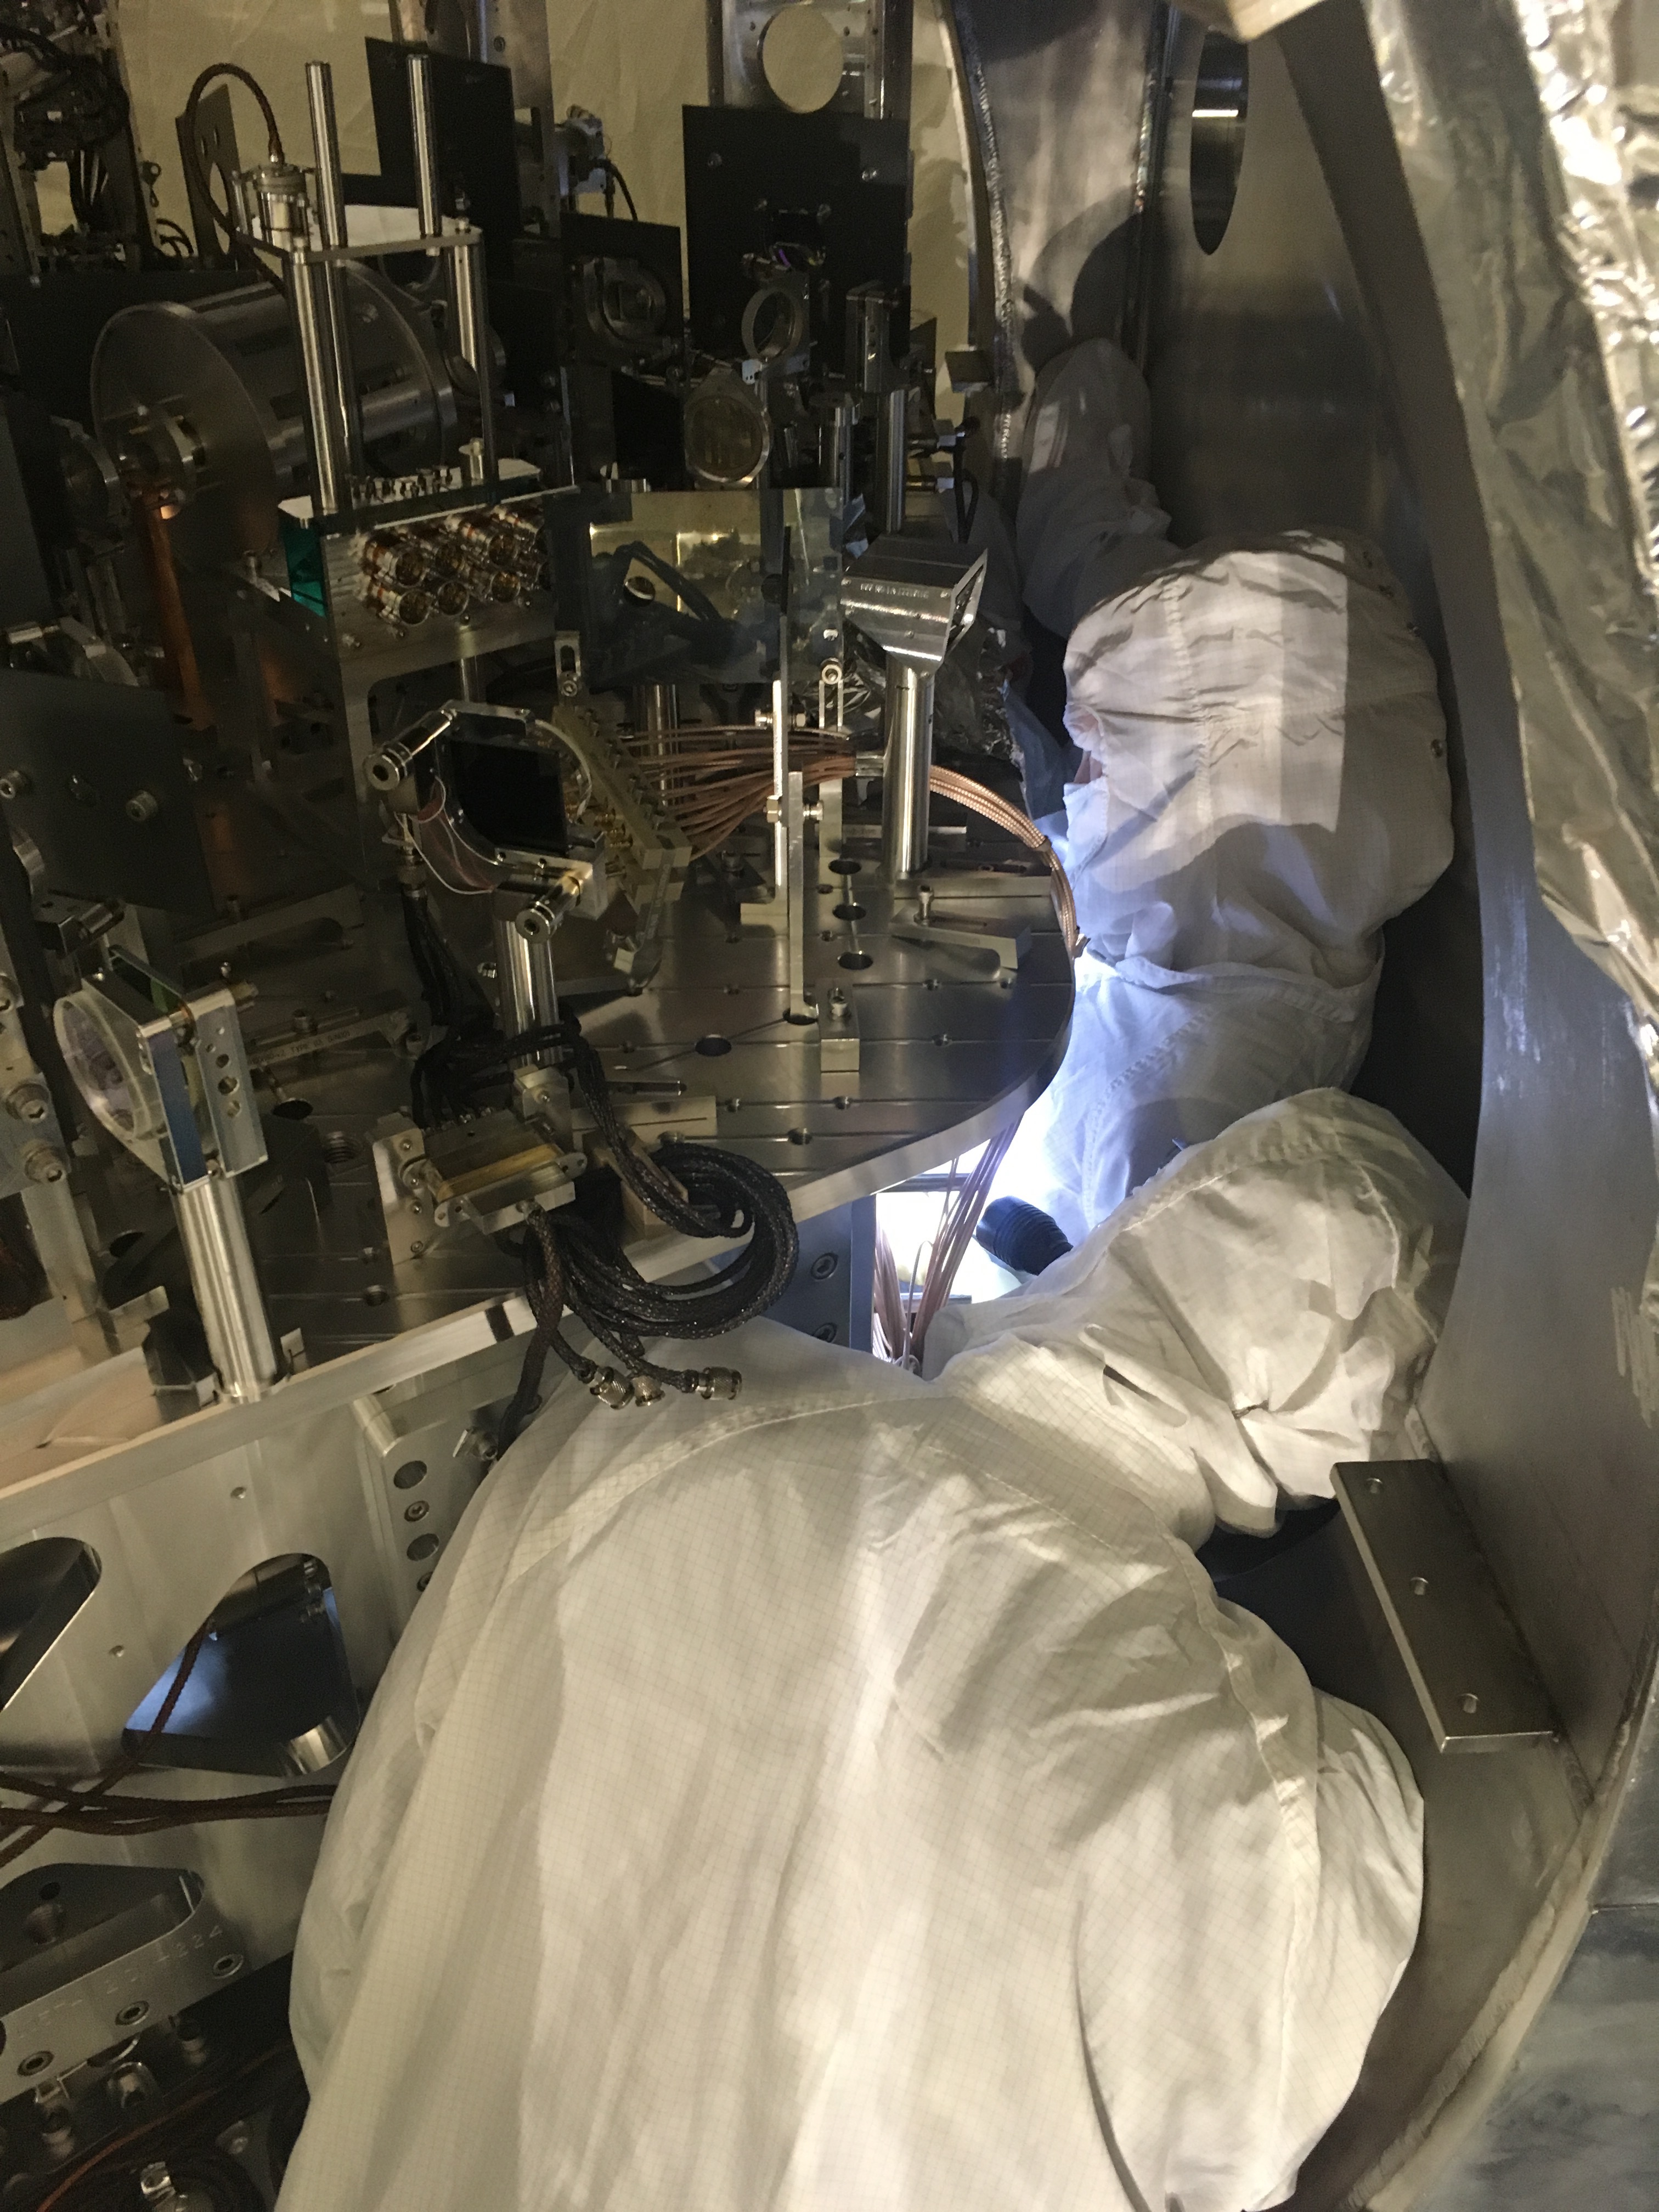
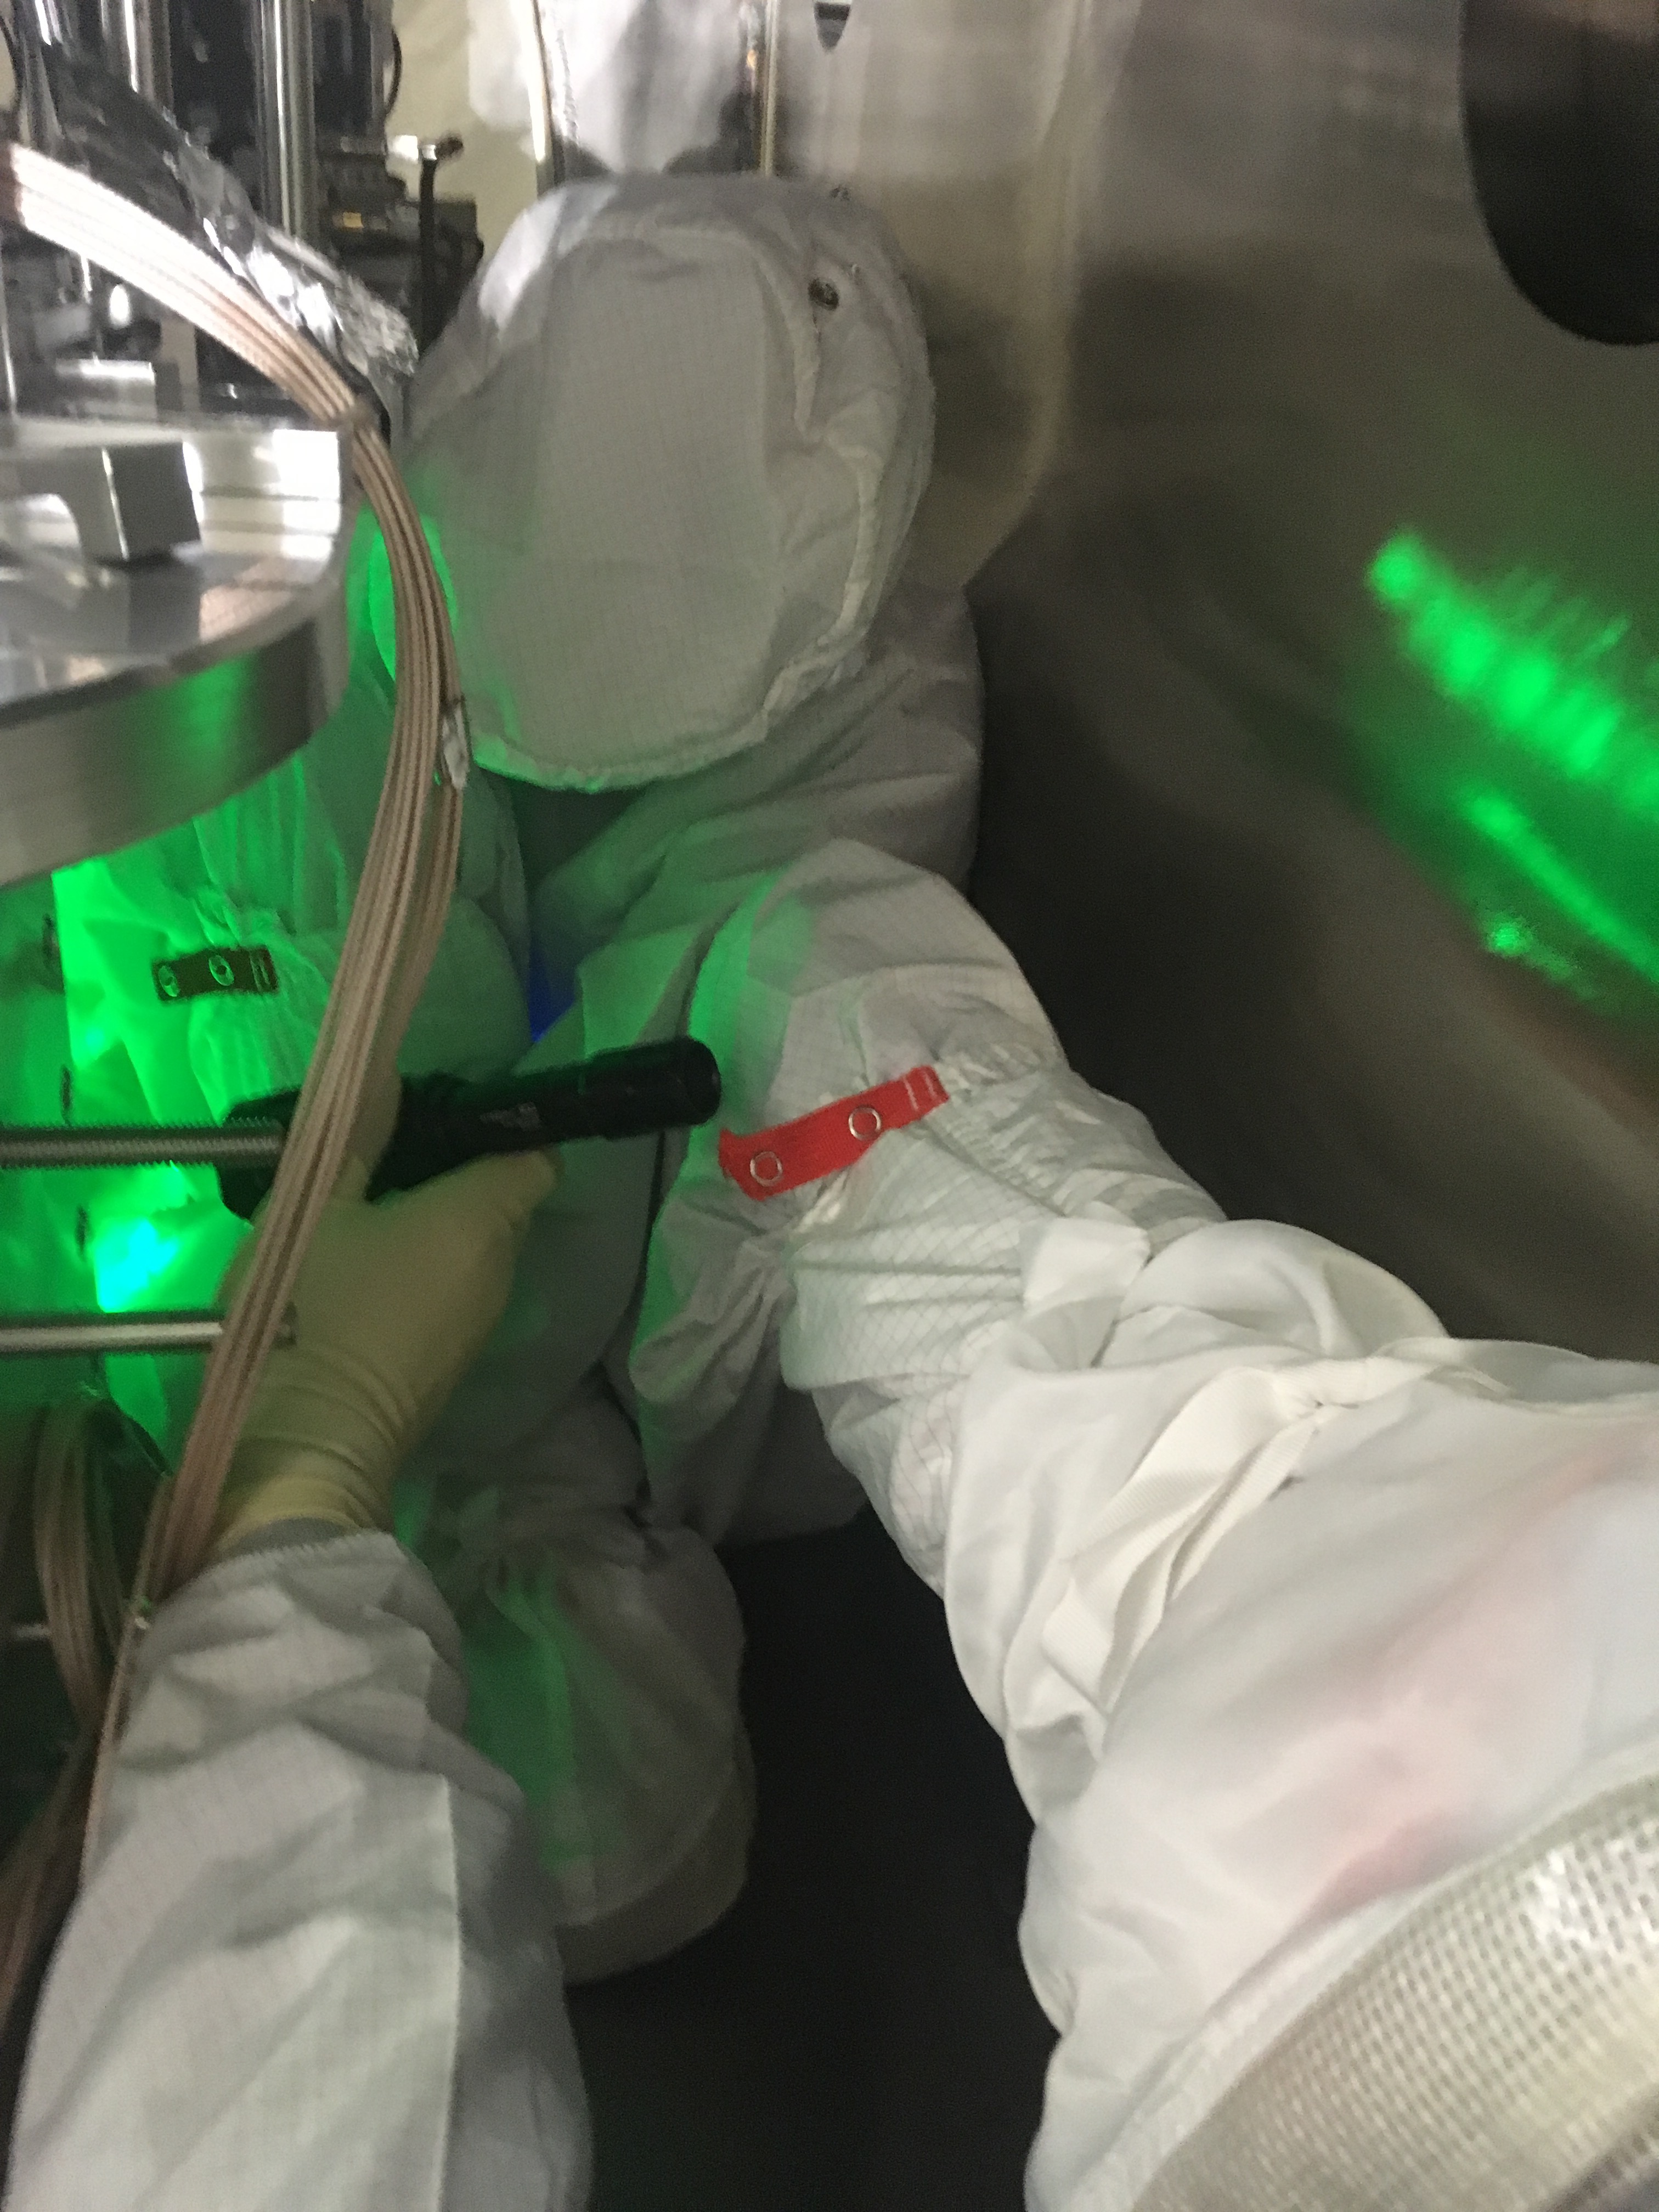
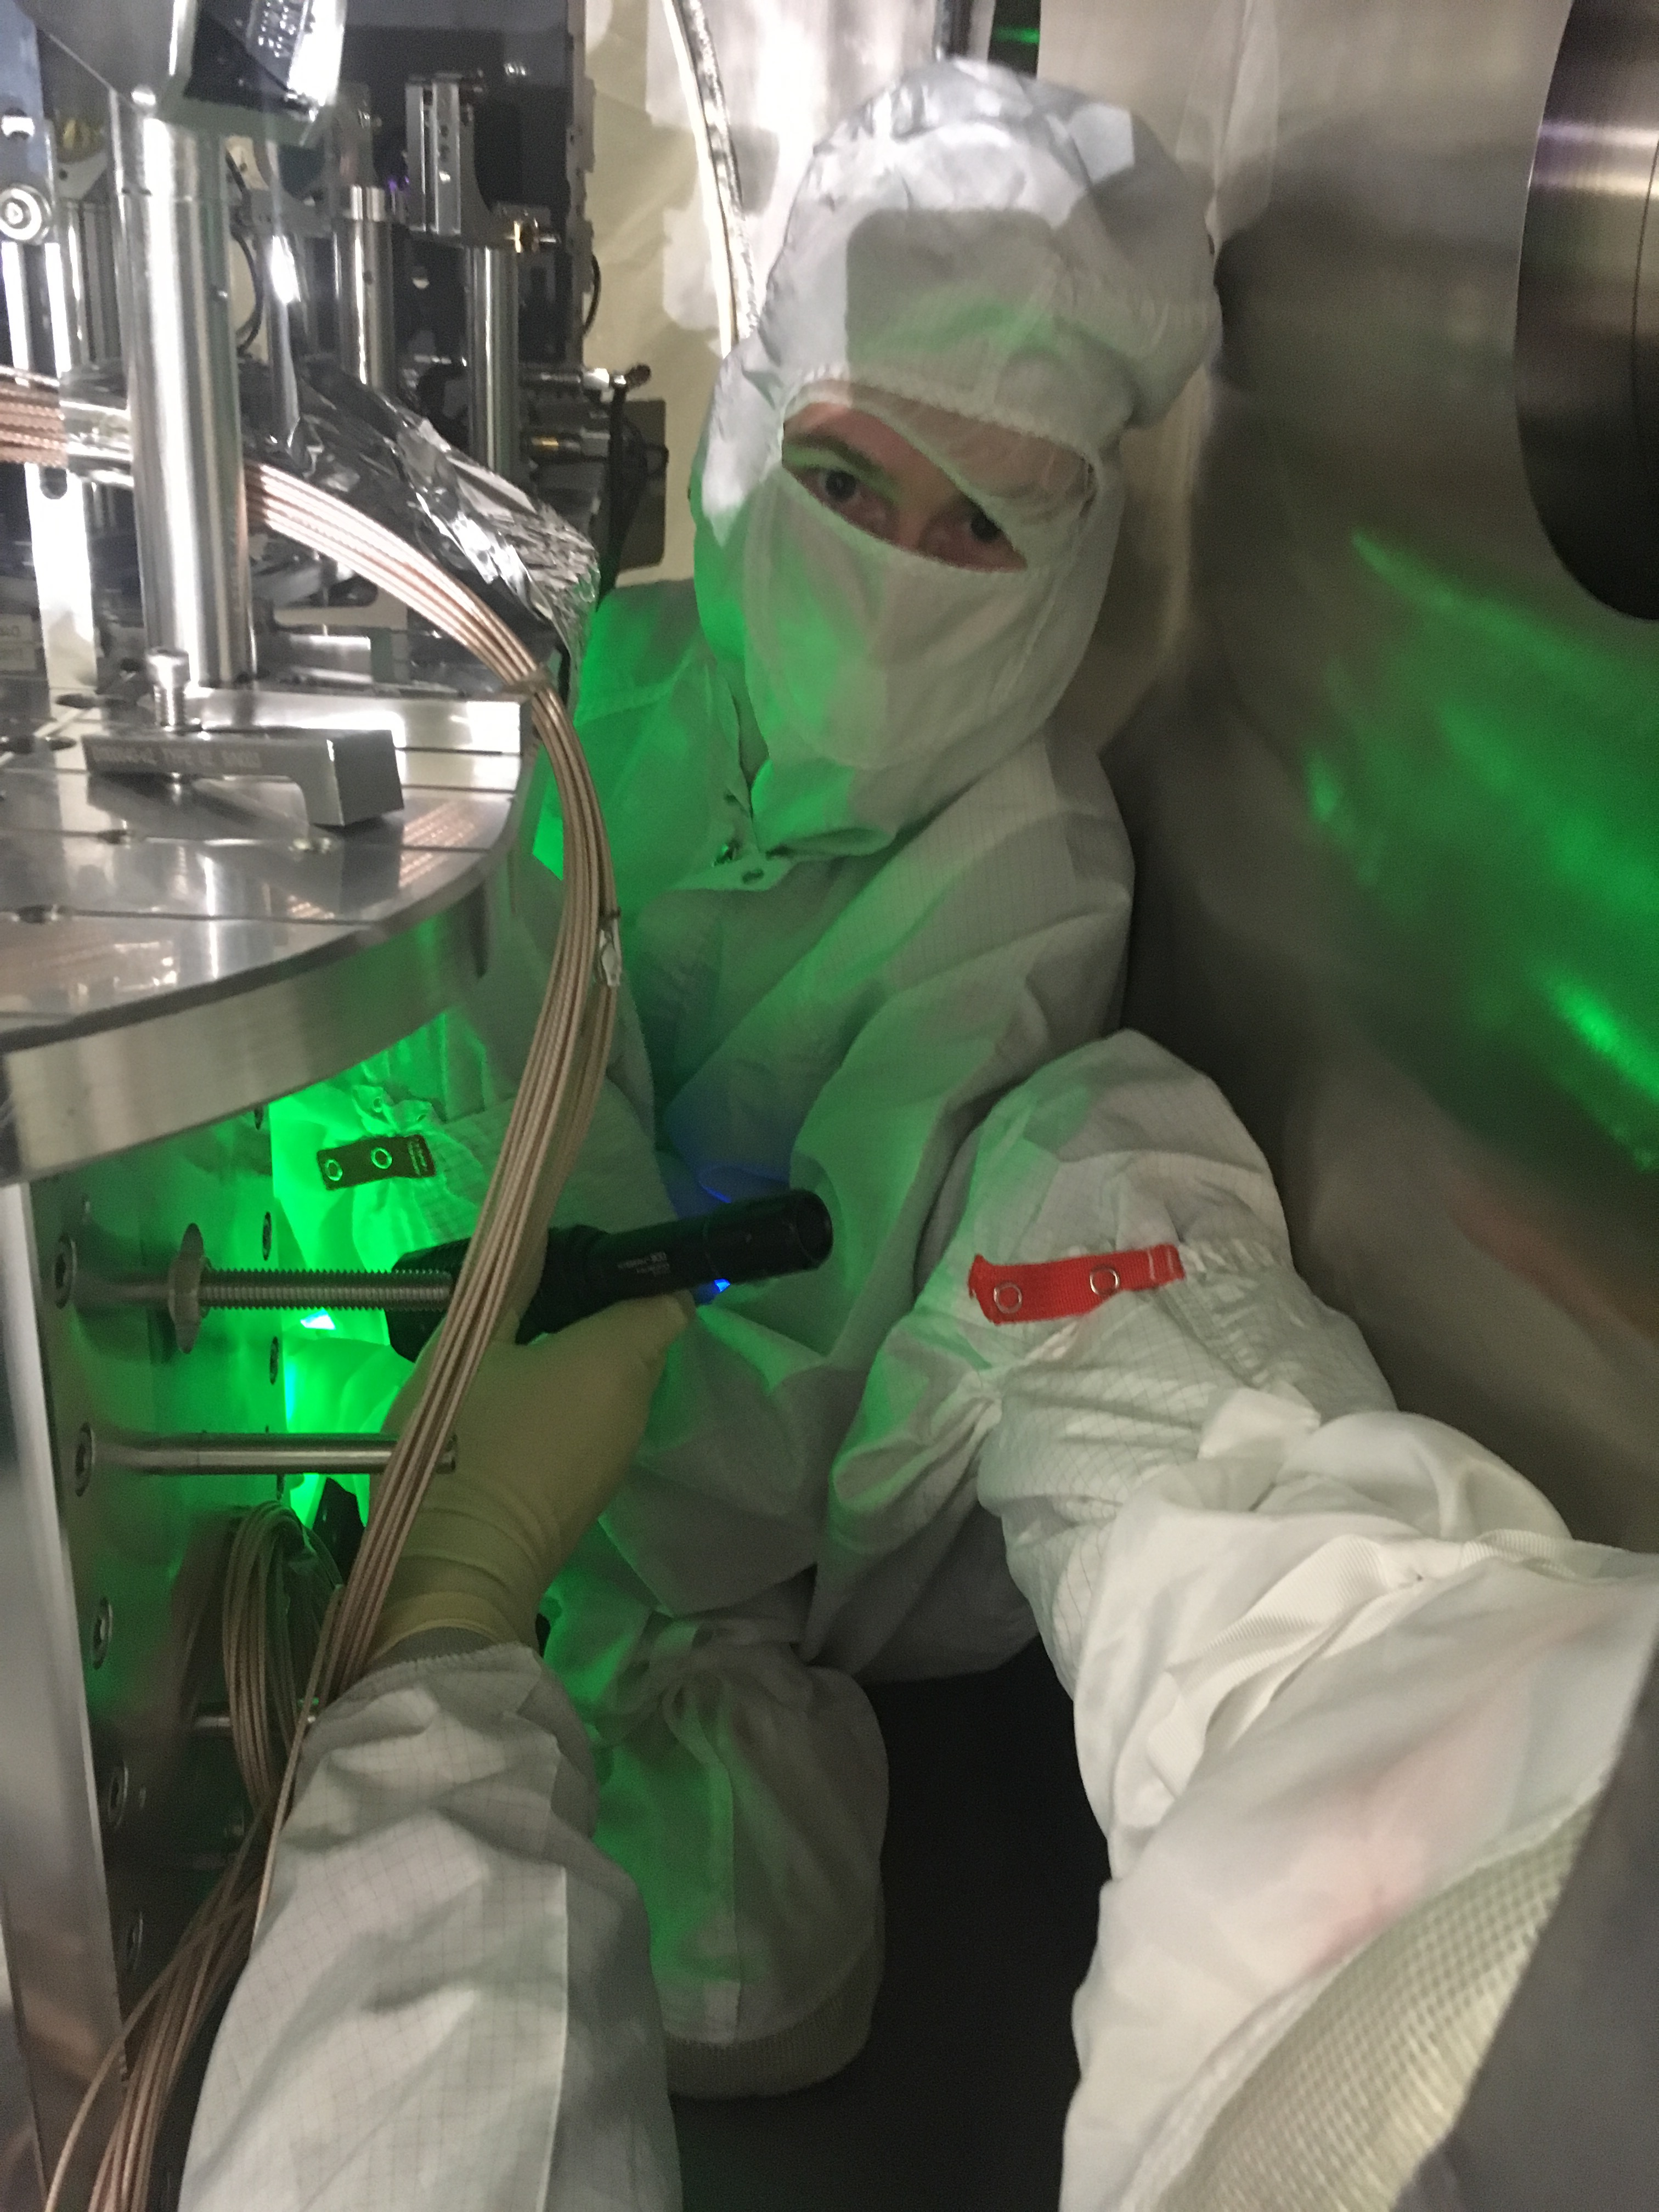
HAM2 ISI dampers are installed, minus the 3 TMDs which are currently being tuned by Jeff K and will be reinstalled in ~ the morning. Thanks to Sheila The Bolt Breaker for crumpling and contorting her skeleton in order to reach those difficult to reach ISI guts in that one corner inside the ISI.
Rick assisted with unplugging and moving the ISS array out of the way for the damper install. He also hunted more appropriate cable relief hardware which he'd like to install in the next few days when the ISS goes back into place.
BSC3 (Betsy, Travis)
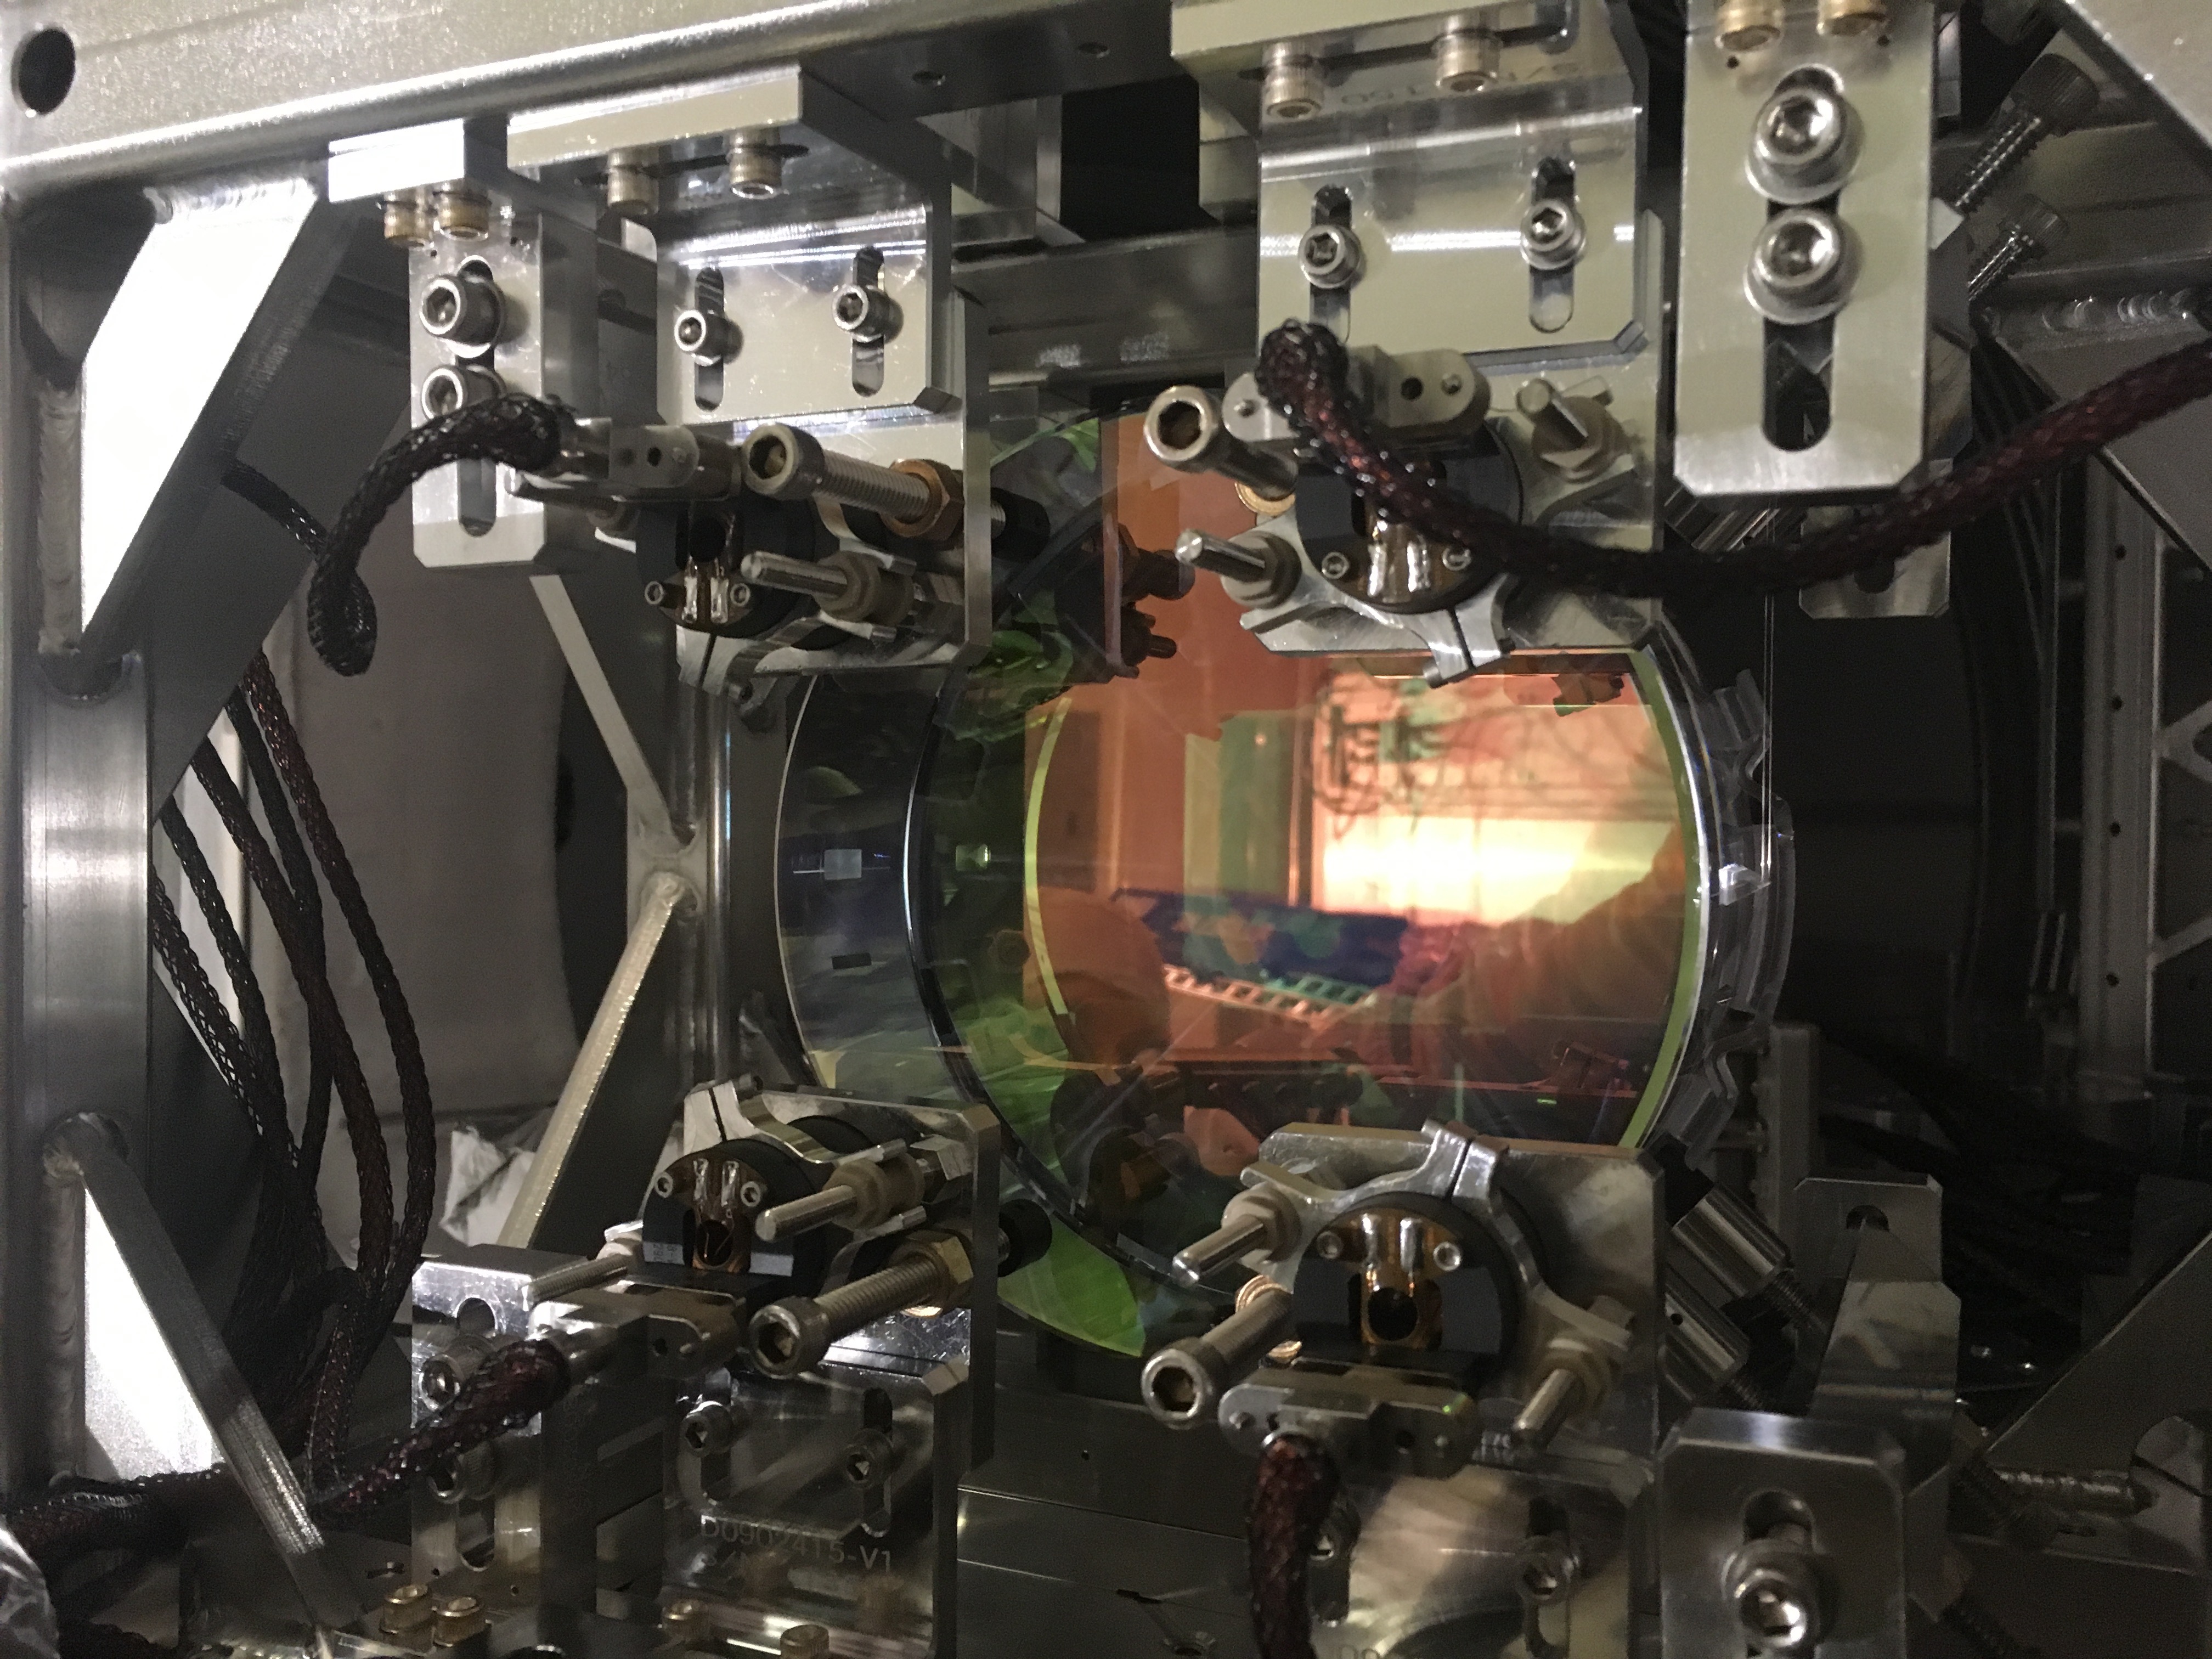
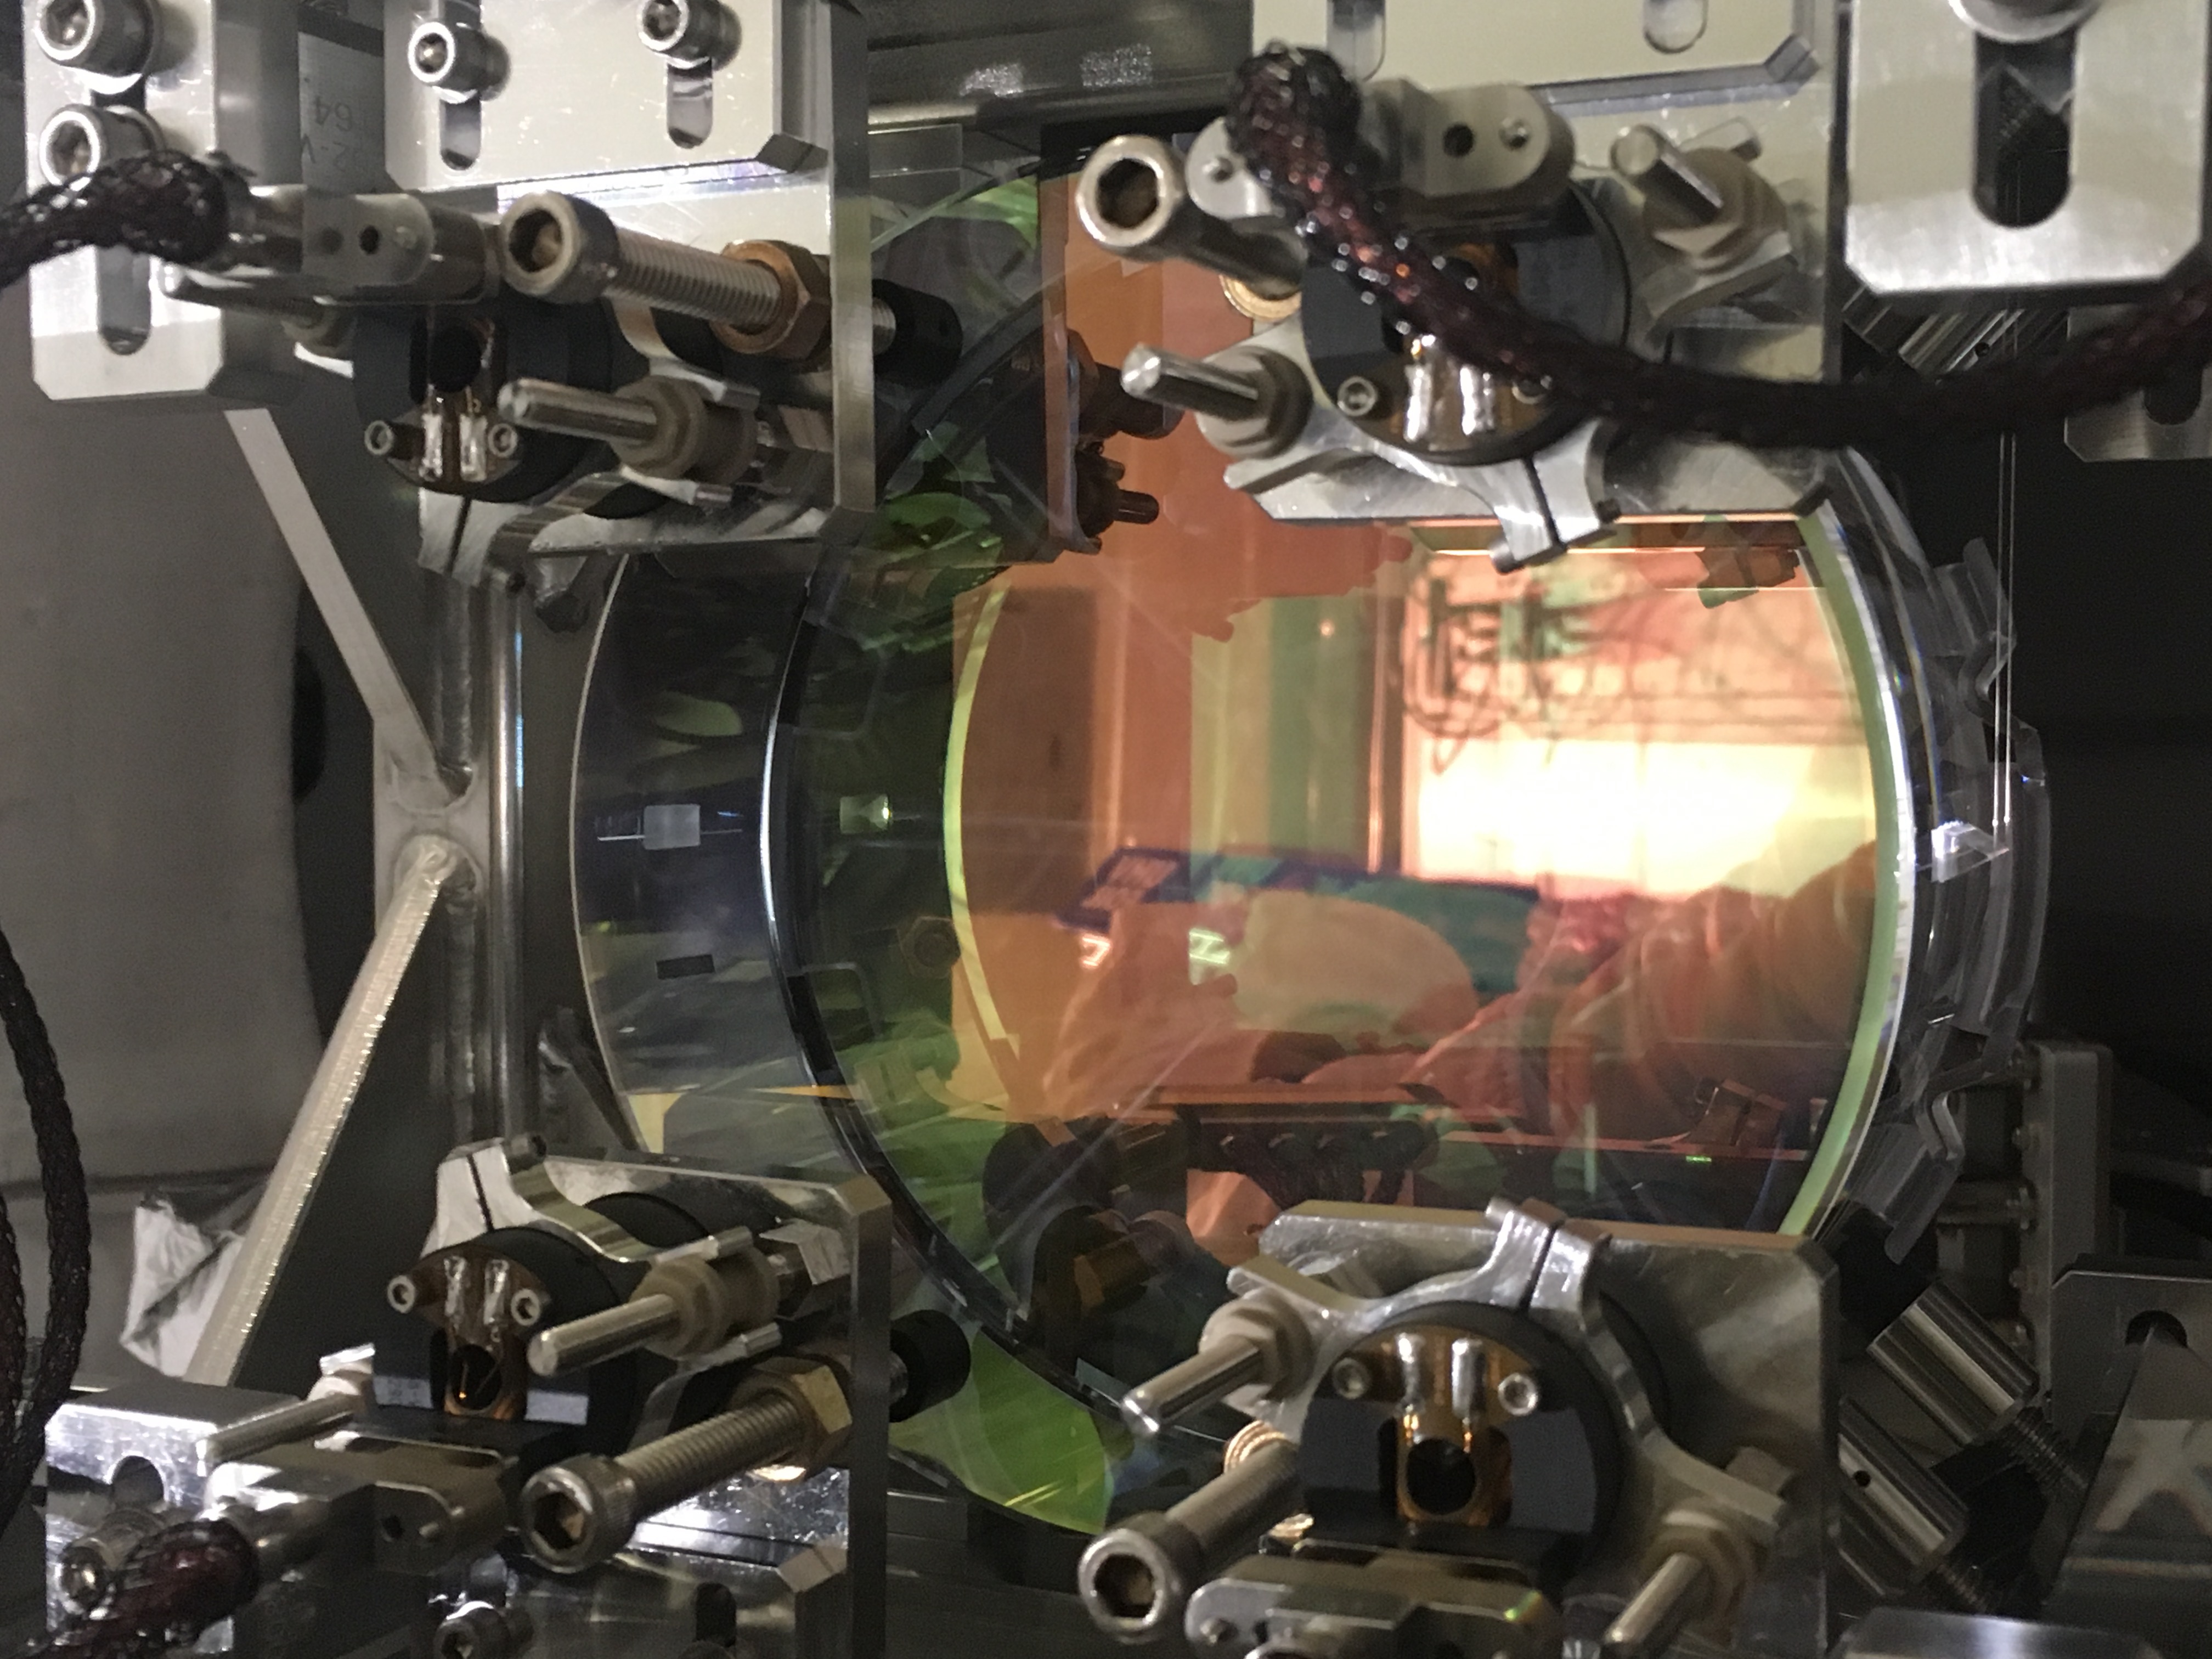
ITMX was thoroughly inspected to check for any mechanics* which may have cause the IFO to need it to be maxed in pitch after the May cleaning vent. All looked fine with zero pitch offset and with maxed pitch offset. We have zeroed the biases on the main and reaction chains and will reset both chain mechanical pointing to the optical lever when we reinstall the new ITM optic.
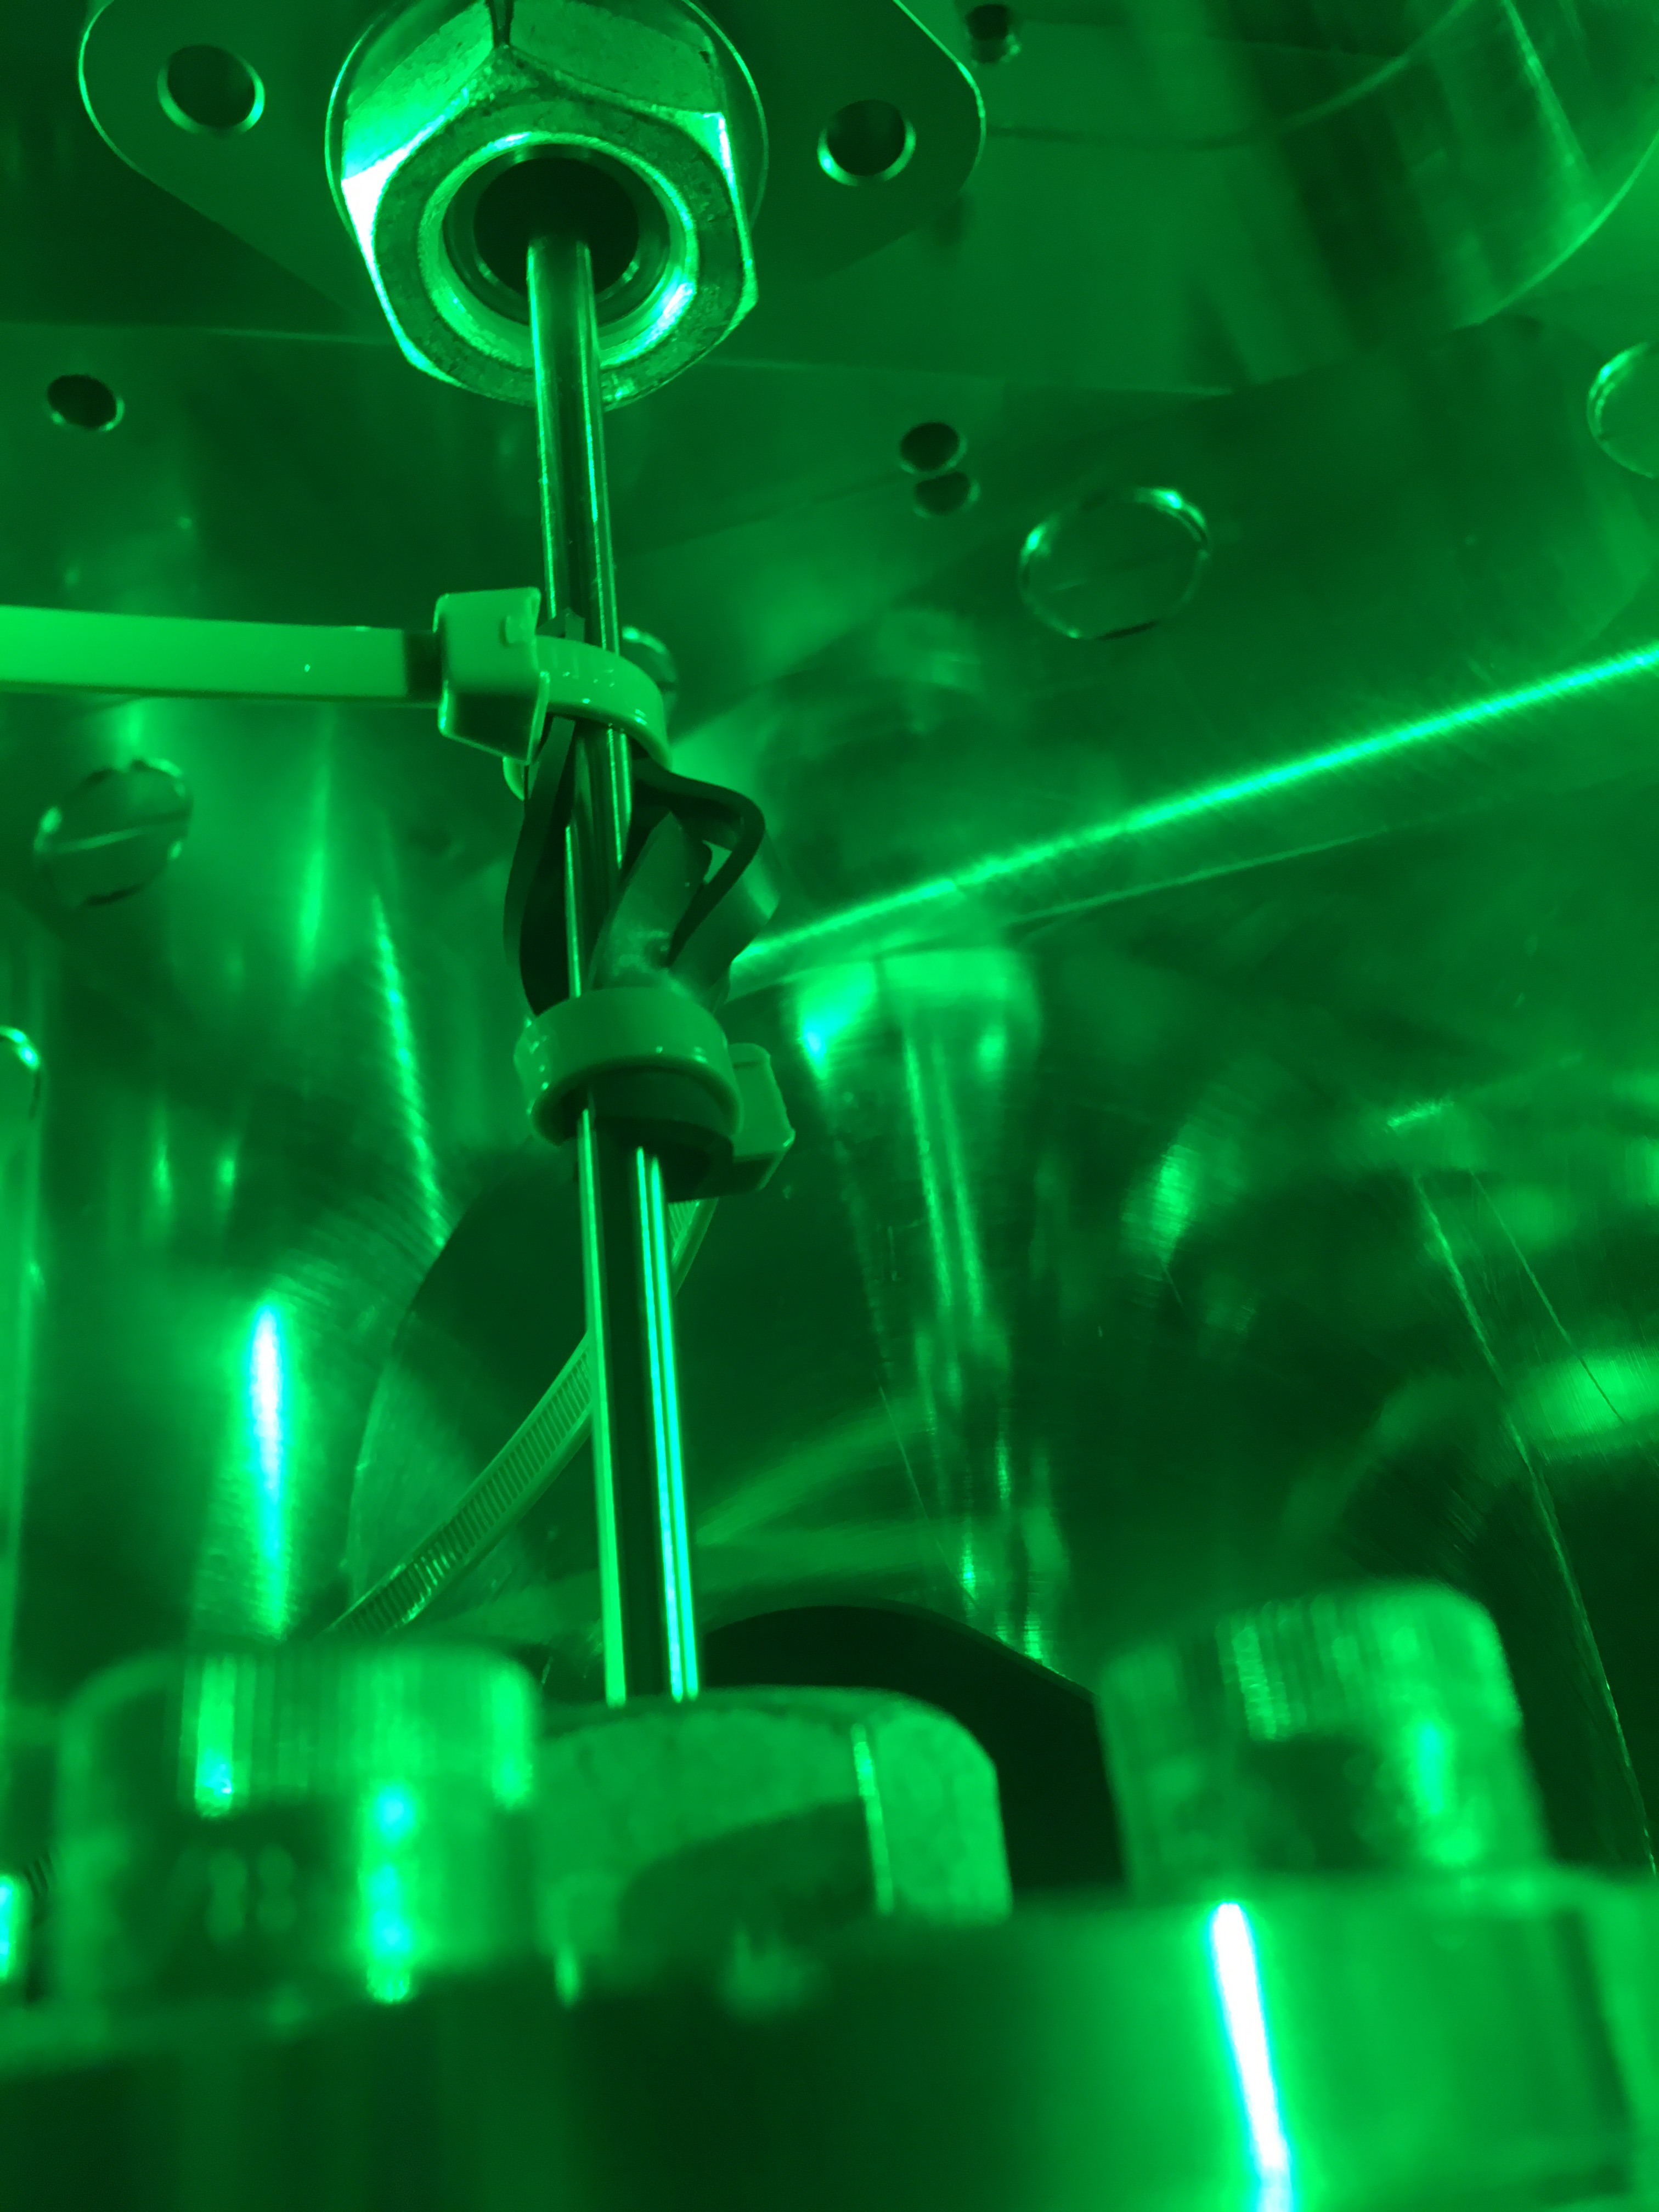
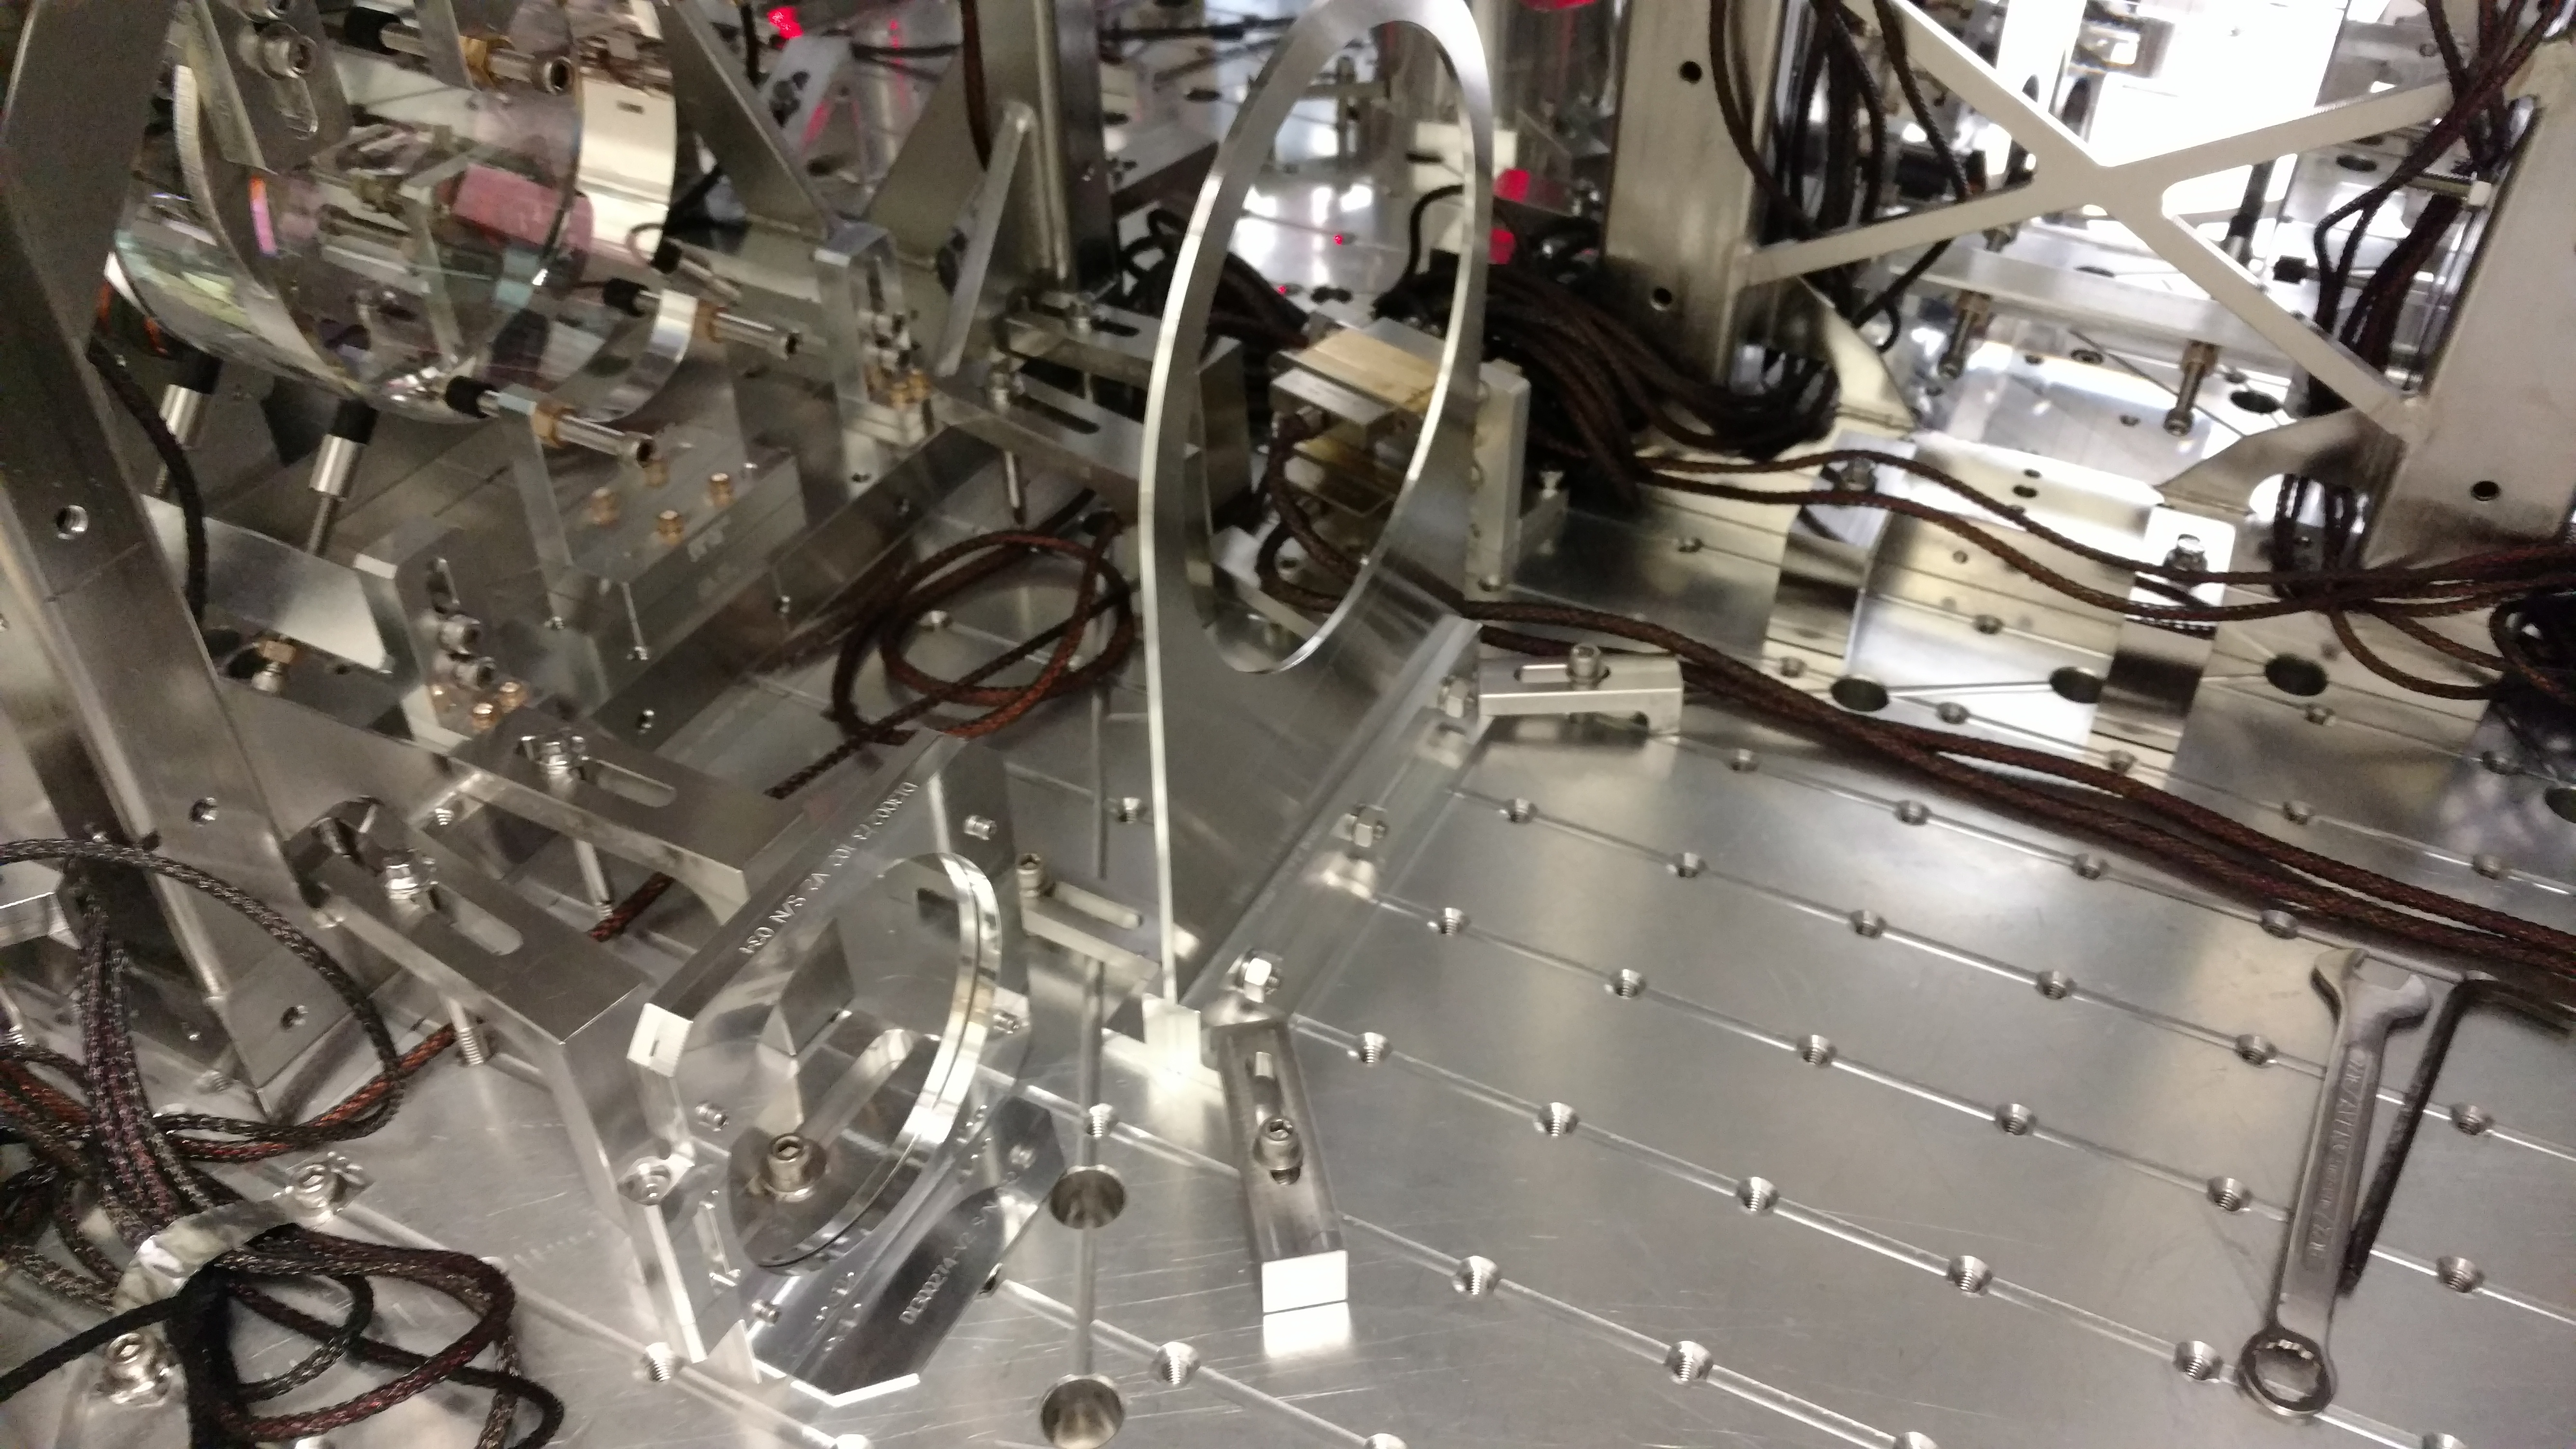
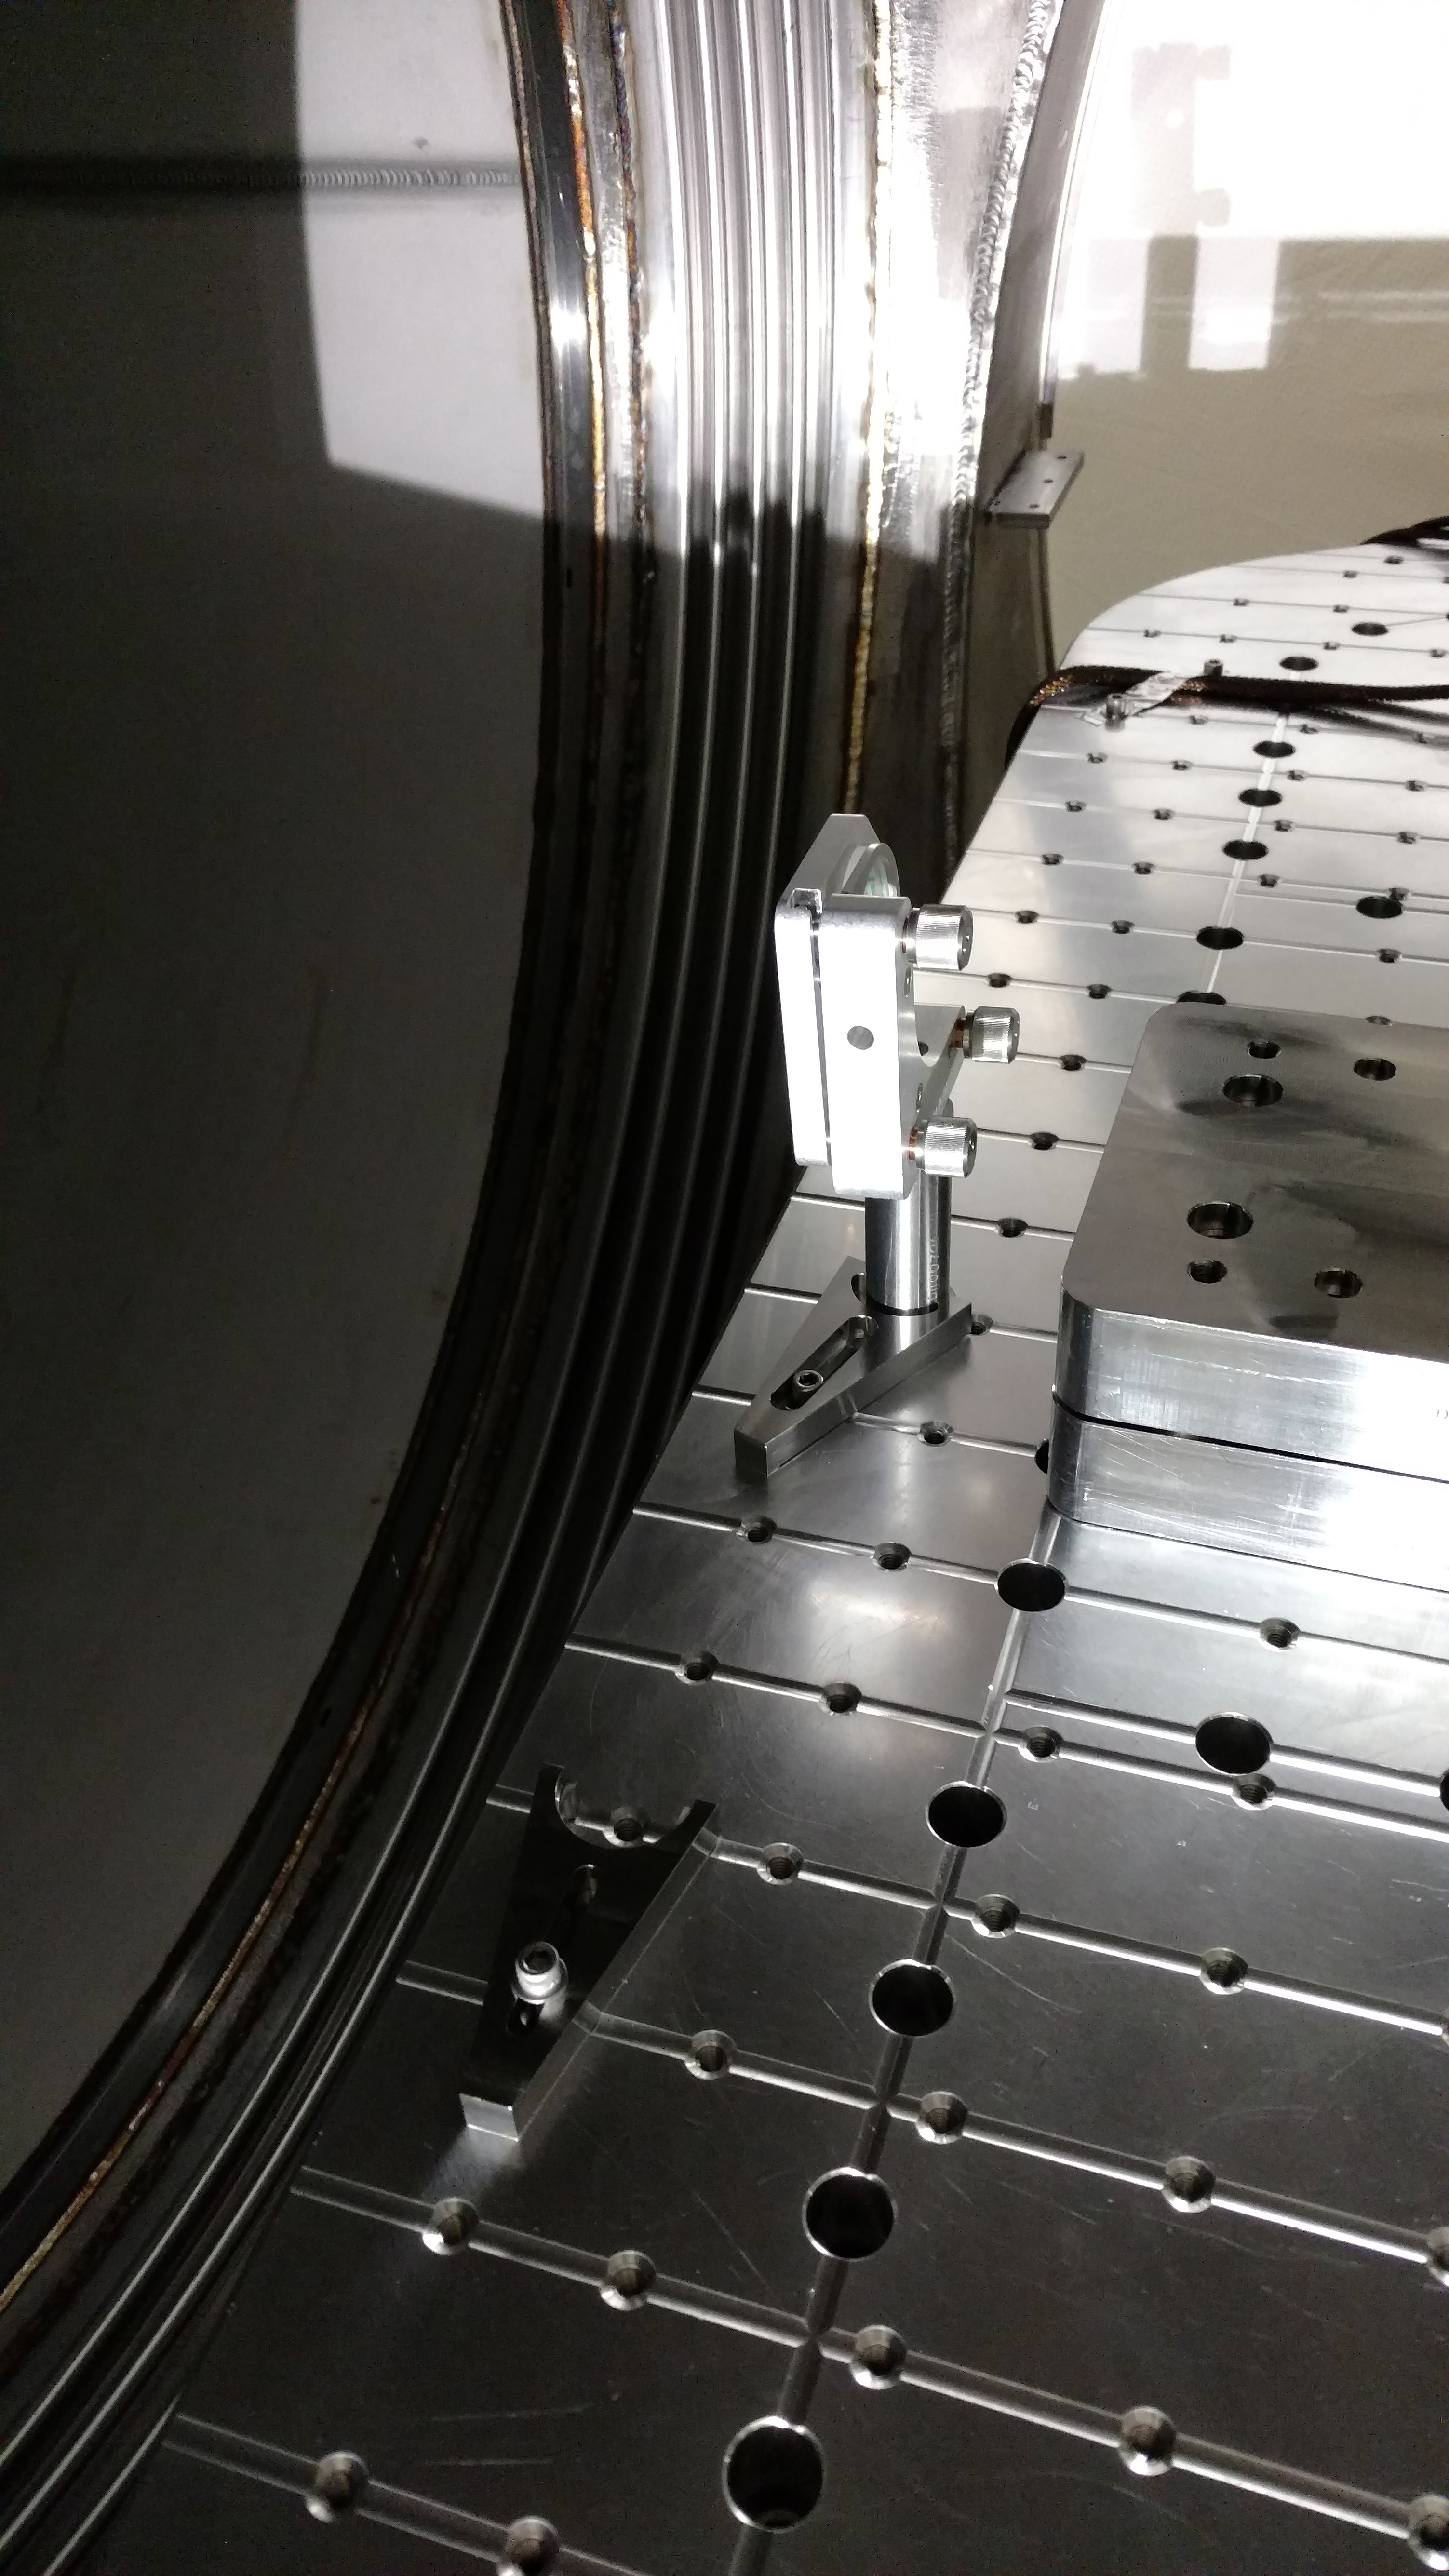
While looking at it, we also mapped the optical lever beams heading out of the viewport down the manifold (Travis hoofed it down there with a head lamp, target and a pen while I steered the suspension around with a CDS laptop). I'll post results of that separately - at first glance the CP-HR beam and ITM-AR beam look much closer together than we found months ago on the ITMy, good.
Started work to remove the sleeve, vibration absorber blocks, wedges, structure cross braces, and flooring panels (to get the sleeve off). Face shields were added to the exposed QUAD optic surfaces. (The suspension is still suspended so violin measurements can be done in the next day or so after we get the LSAT on the structure for measurement equipment support.)
HAM3
Bubba, Mark, and Tyler removed the doors from HAM3 today.
Jim locked the HAM3 ISI.
* All 4 main chain pitch adjuster rods were found tightly locked in place. All chain cabling was as we left it - nominal, not touching any place it shouldn't. The ACB assembly was still nominal at only ~1mm away from the QUAD structure, but not touching. All magnet flags looked reasonably centered at all stages. All EQ stops looked well positioned and not touching. Nothing was found that possibly fell from higher up and landed on a stage in order to cause a pitch change. (Recall the suspension had a clean bill of health via TFs a few times over the last month, so we didn't expect to find anything really.)
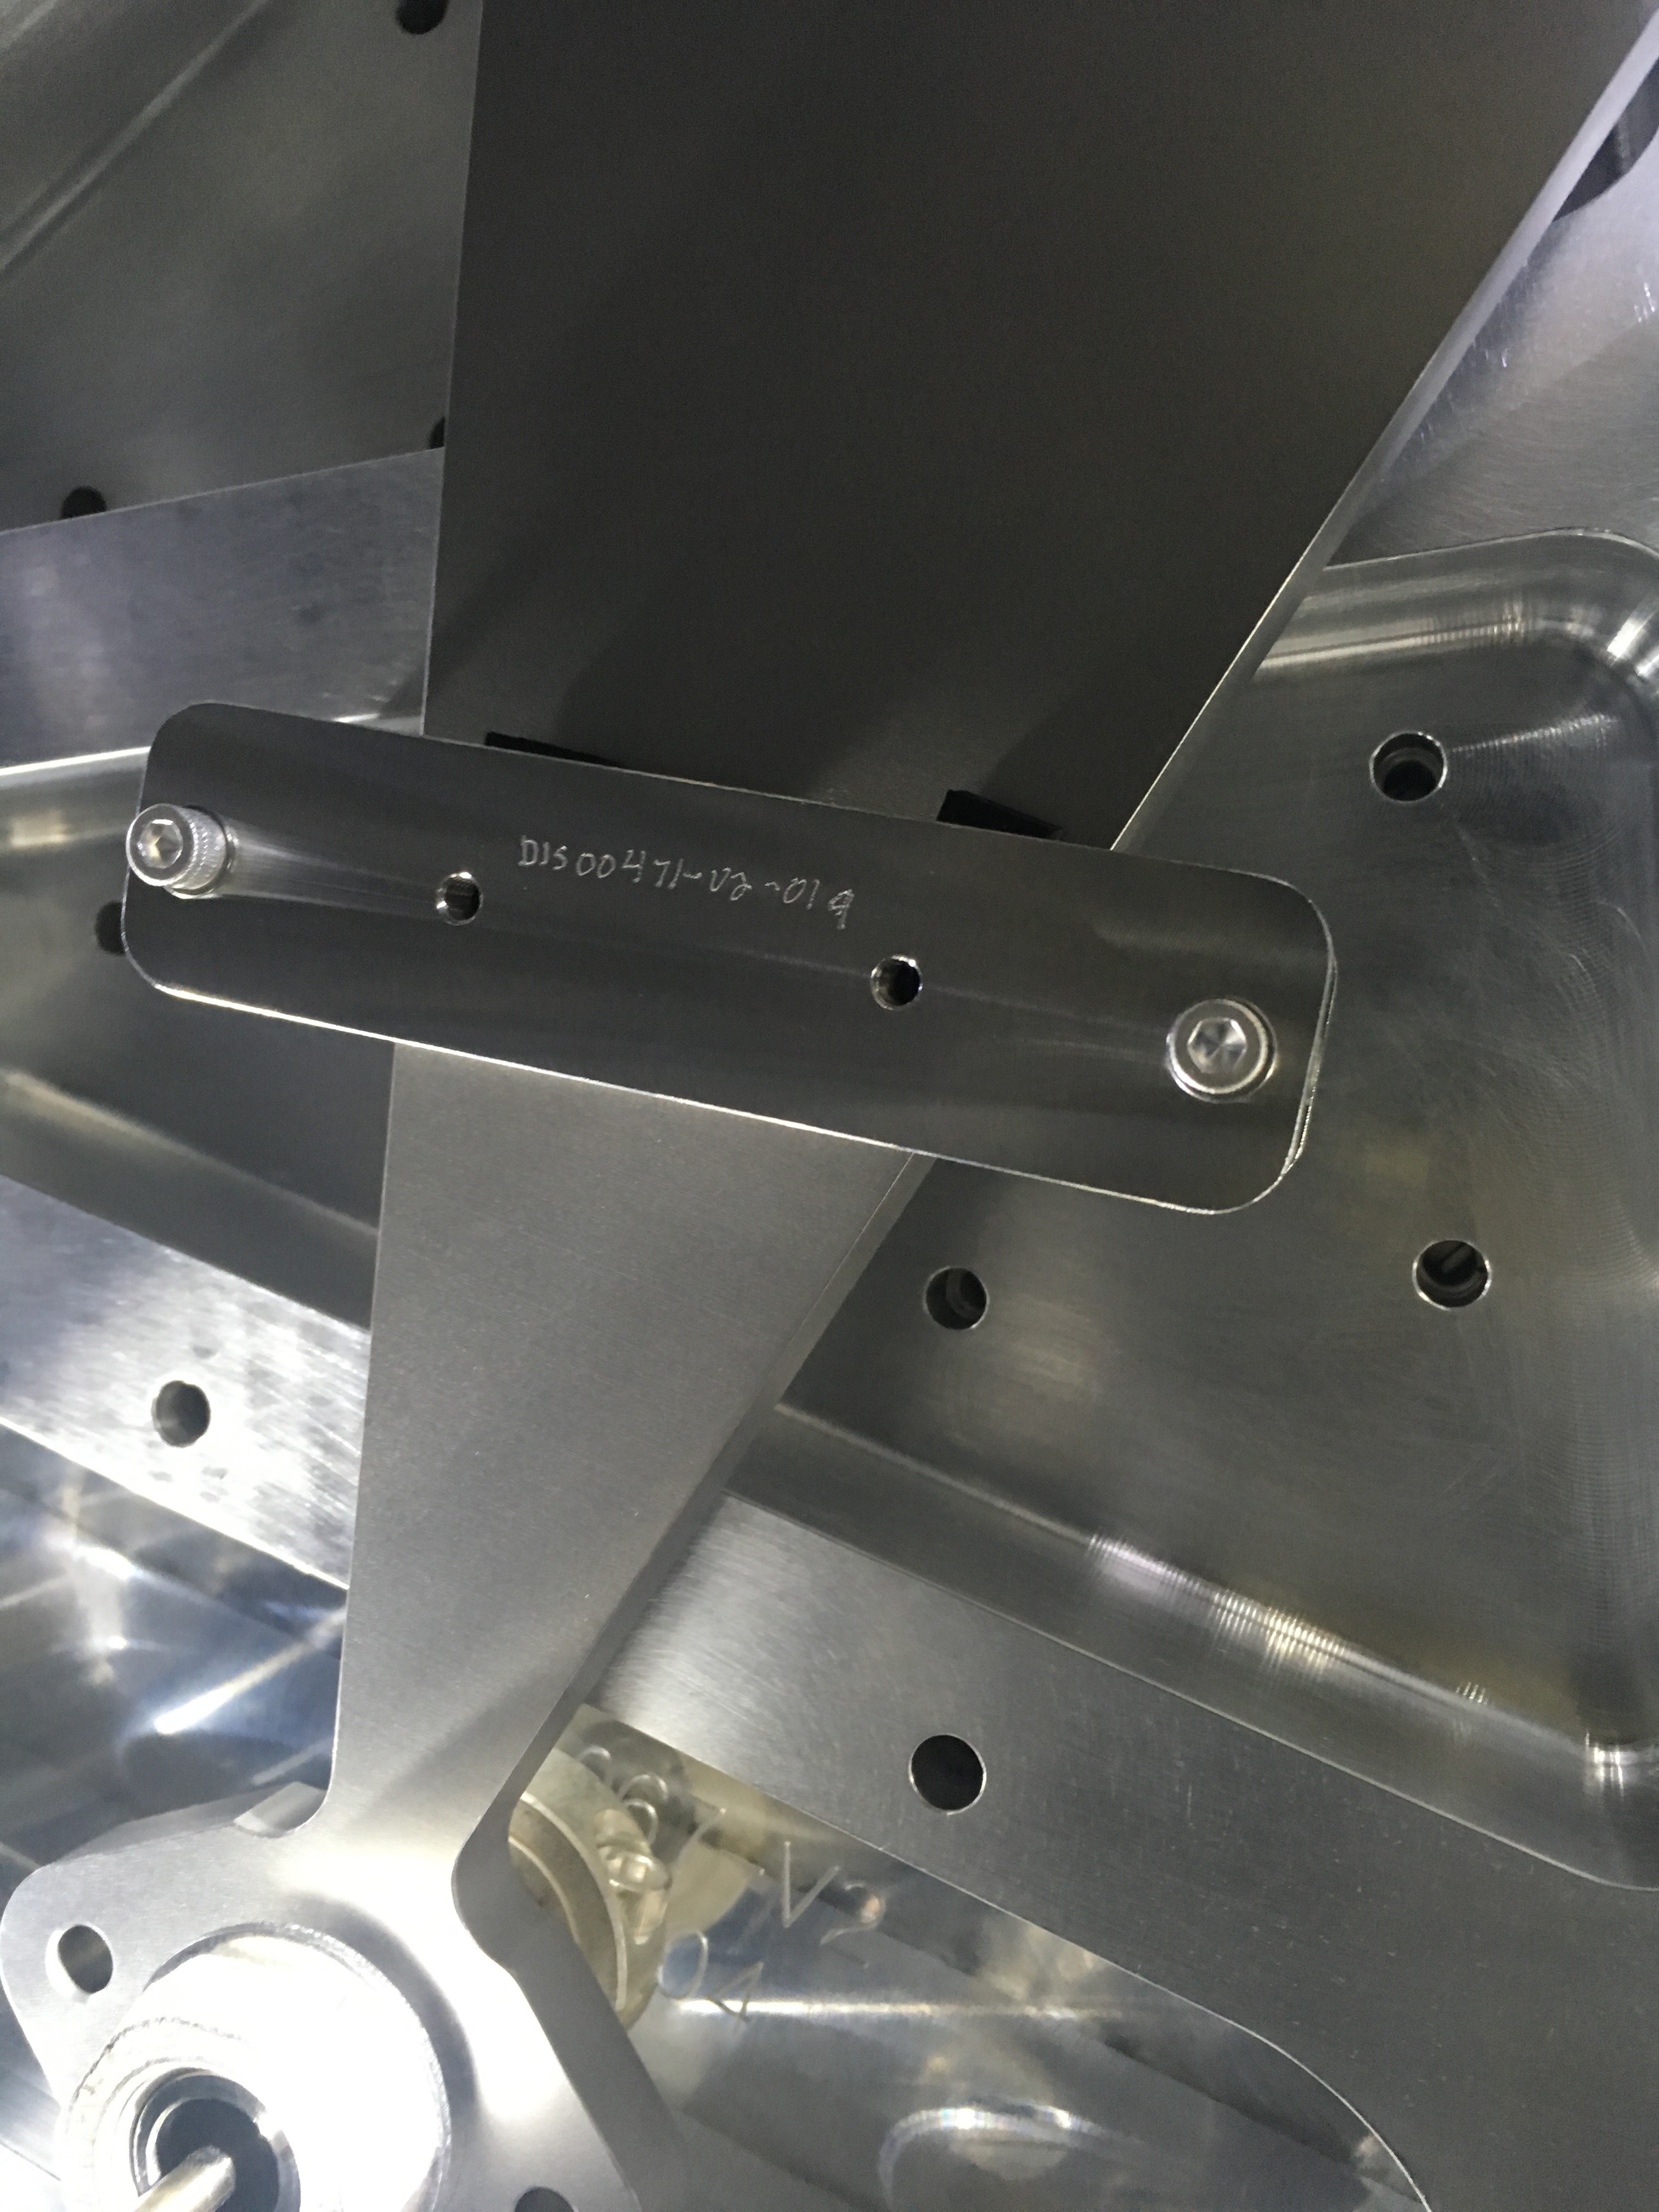
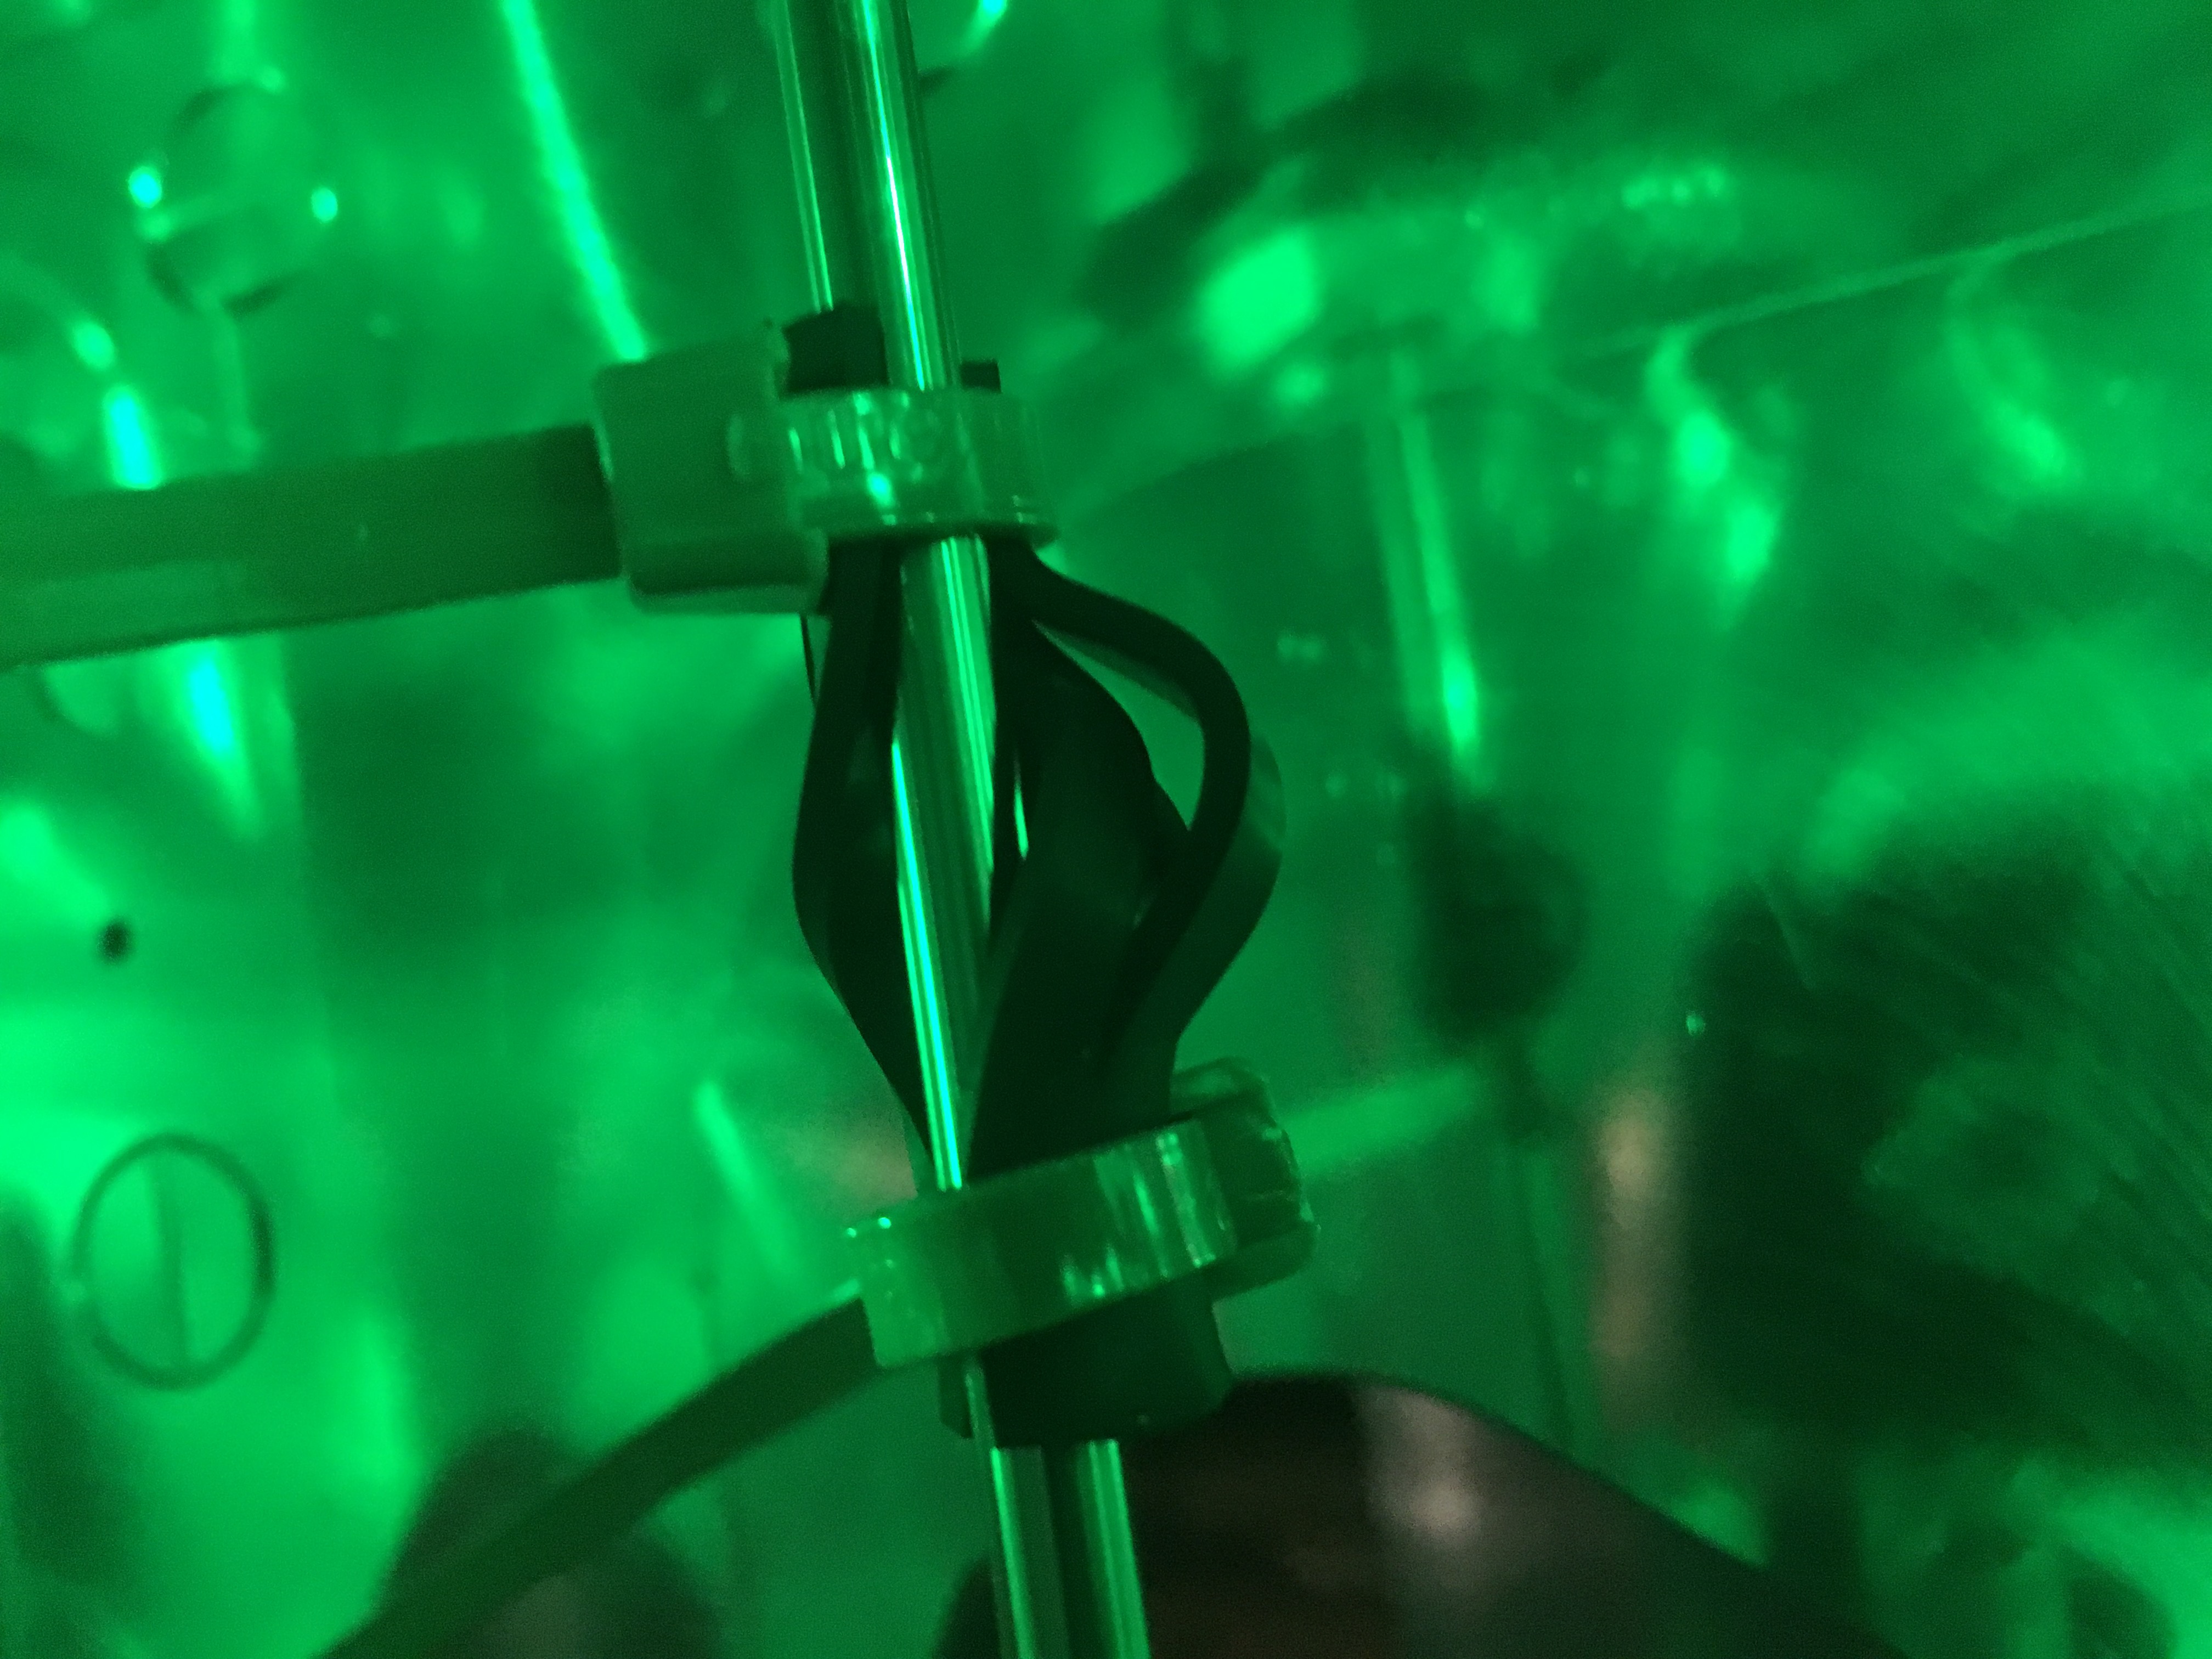
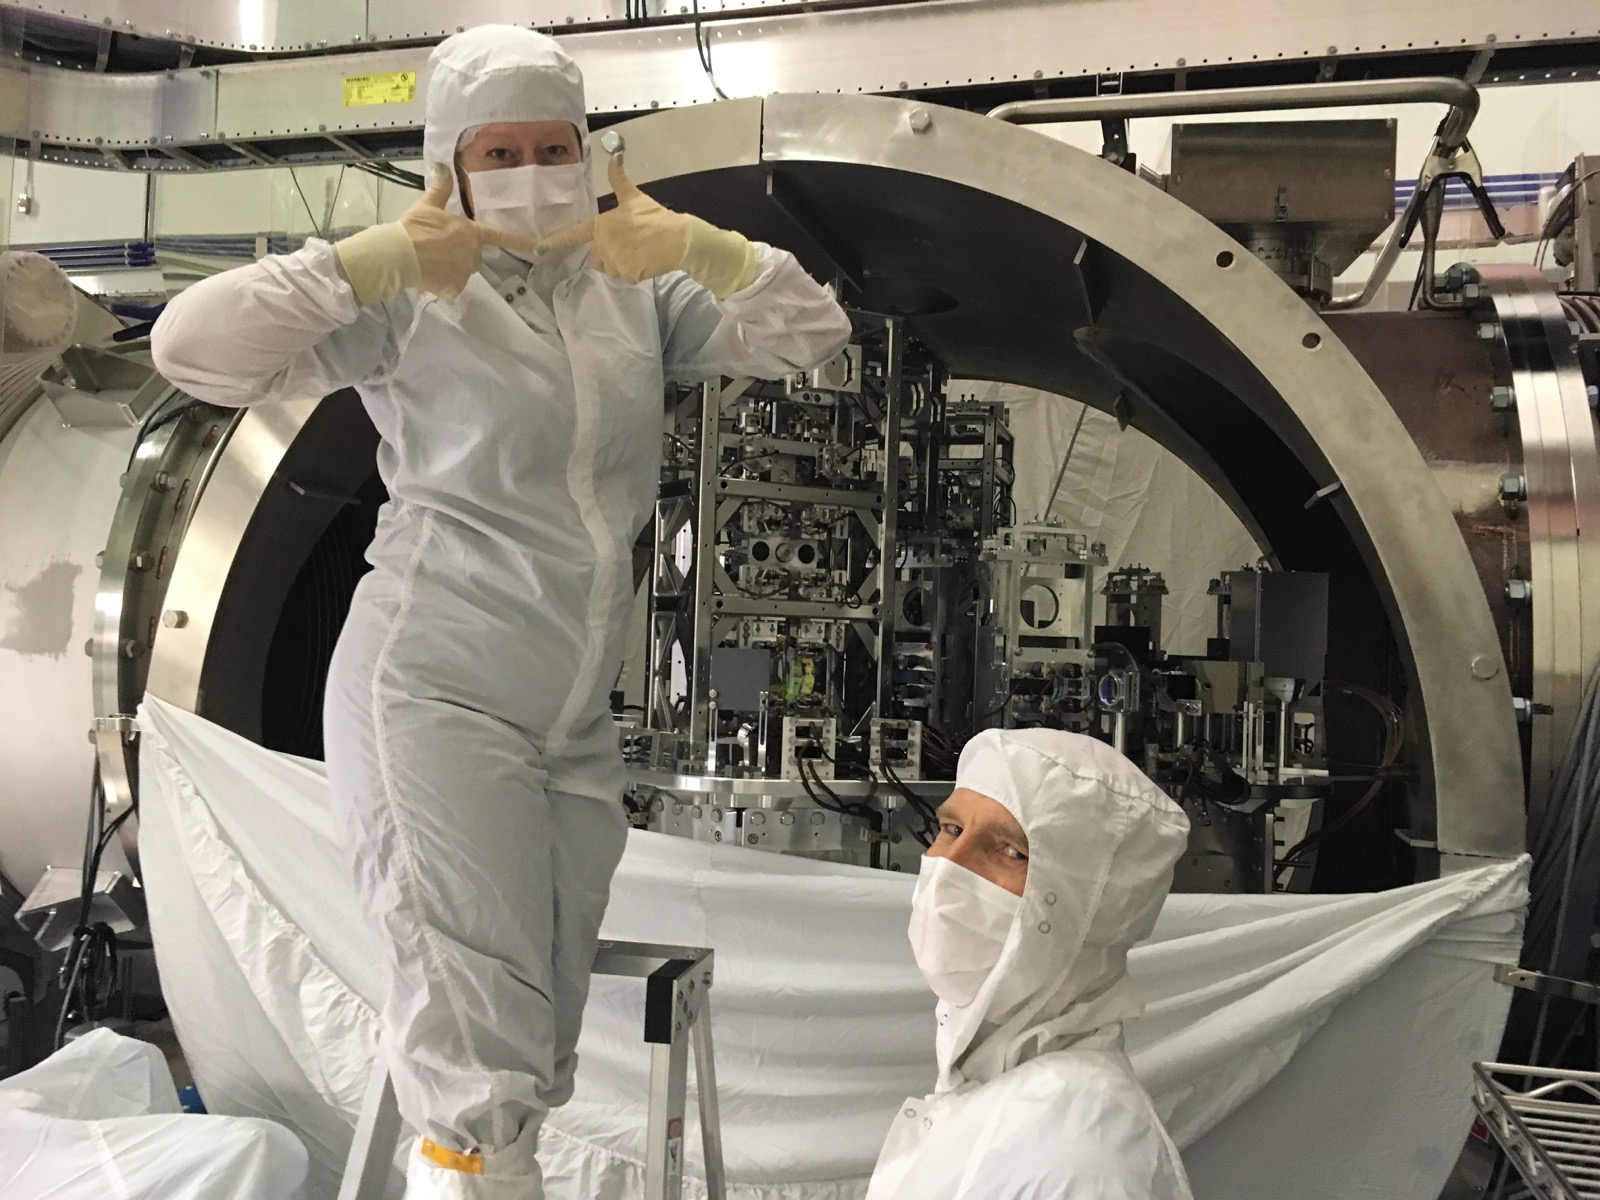
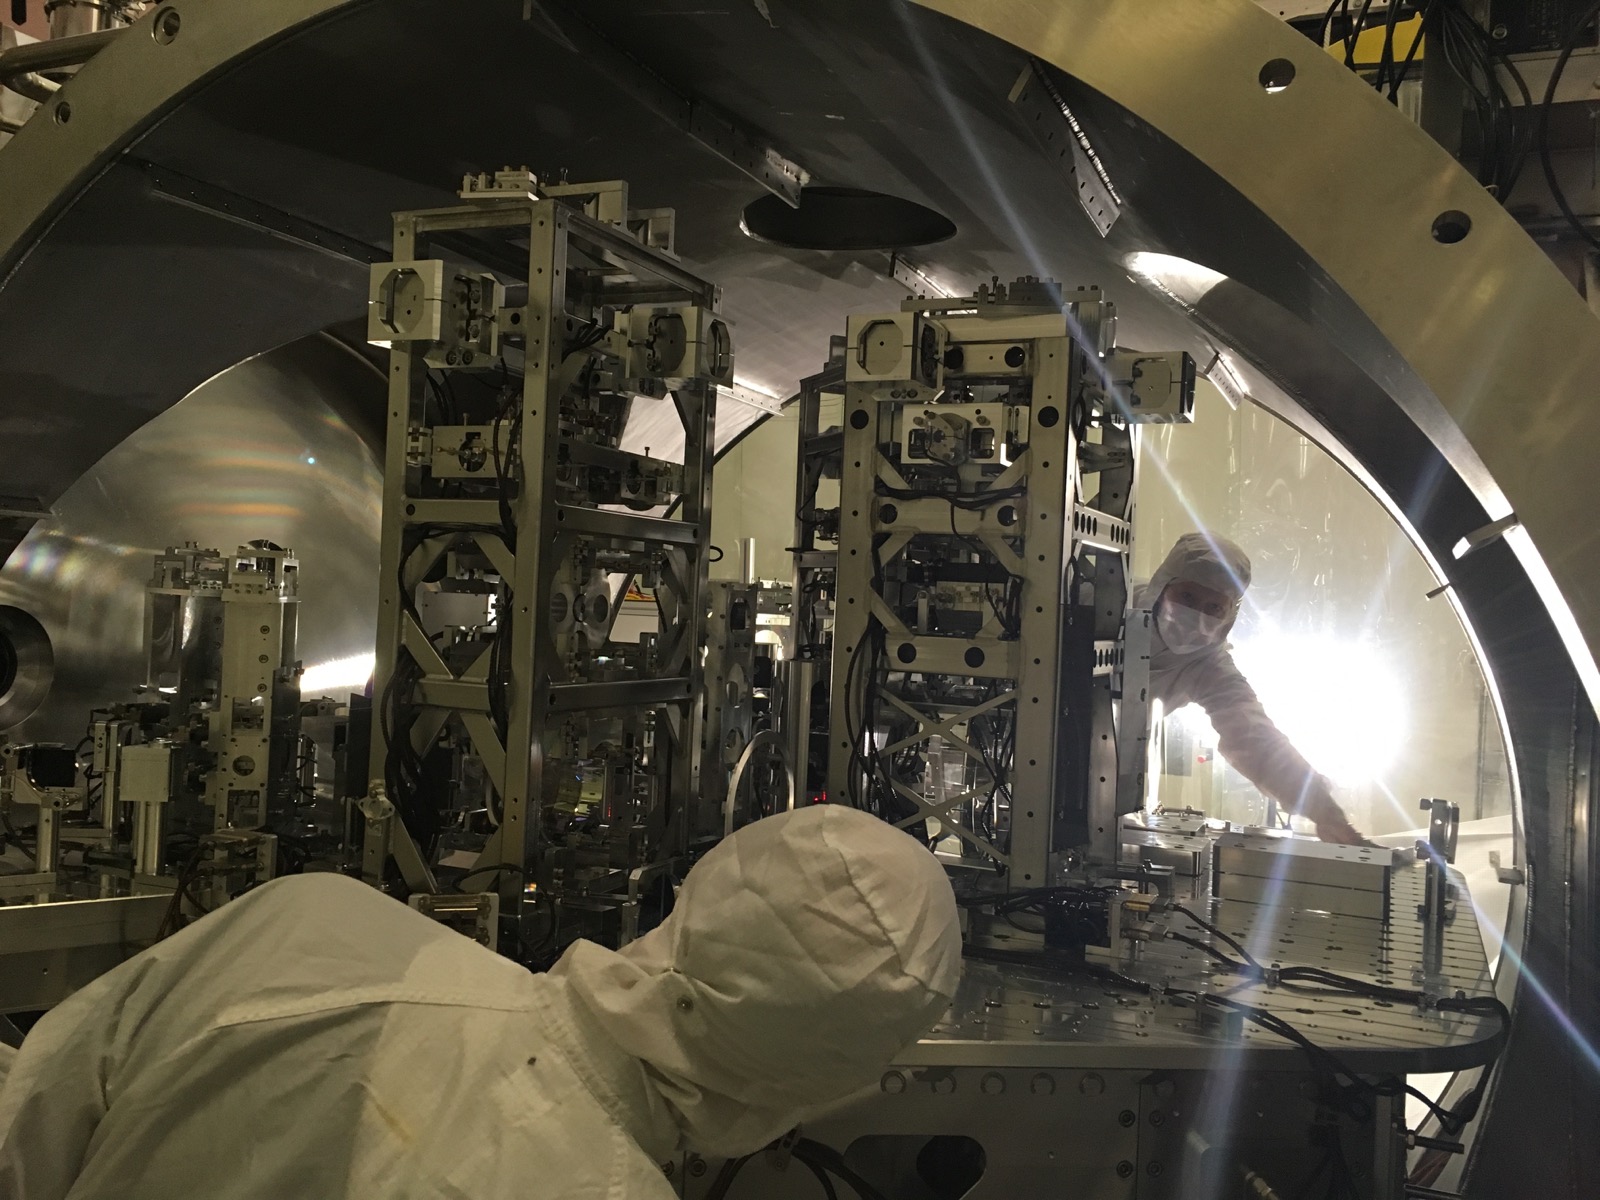
J. Kissel

I second the many thanks to Sheila for getting in all of the damping mechanisms for the "Corner 1" blade and V2 GS13 can. I attach some great pictures of her crumpling skills.

Also attached are pictures of the blade tip and flexure dampers post-install. While the flexure dampers arrangement isn't amazing, I'm quite confident viton is forgiving enough that this will still do the job. I'm also confident that although it looks messy, the flexure damper still won't move around.

Note because this was a difficult ask to just install these components, I made the executive decision *not* to B&K hammer the blades as we'd done for Corner 2 and 3 (in LHO aLOG 38716). The cabling would likely have been a nightmare to keep from touching the innards of the chamber, let alone trying to get a good strike with the hammer while not interfering with the table / measurement. We've seen enough post-blade-tip-damper-install blade responses to know that the fundamental blade mode moves from 153 Hz to 139 Hz, and the Q of the TMDs is low enough that it'll cover any spread we see. (However, this is an exception, we will continue to hammer ever other HAM blade.)

And for the record, at the close of business this day, all of ISIHAM2's dampers (save the to-be-tuned TMDs) on all corners have been installed:
    - Blade-Tip Dampers
    - Flexure Dampers
    - Horz. and Vert. GS13 Can Dampers

Also, also, I grabbed a publicity photo of the back of MC3 while I was there.
Retroactively tagging EPO for the great pictures, now that we have the tag!
Message: Our current charge measurement (Veff) doesn't tell us everything we want to know about how much charge is on the optics, or do a good job of predicting noise in DARM caused by electrostatics. Here is a way of measuring the ESD actuation strength that could give us a slightly more complete picture of what is happening. These measurements still don't give us a conclusive charge measurement that we can rely on to understand the DARM noise.
Motivation:
In an effort to track the charging of our optics, we have been measuring and tracking the bias voltage at which our ESD actuation strength is minimized for a few years (38604) , but we have some clues that this measurement gives us incomplete information about the charge that creates noise in DARM. After the July EQ, we saw a large increase in the noise in DARM. There was also a change in the charge measurements, but not a significant increase in Veff (38401). However, discharging the end test masses partially reduced the noise in DARM, and reduced Veff. We also saw coupling from the ETMX and ITMY ISIs to DARM, which made noise that was well below the limiting DARM noise. Discharging fixed this coupling for ETMX.
New measurements:
Over the last few weeks I've been thinking about ways we could measure other parameters that depend on the test mass charge. Four coefficients (alpha, beta, beta2, and gamma) that describe the ESD actuation, their measurements and calibration are described in T1700446. Scripts for making these measurements and the log files for the measurements plotted here are in the userapps repository, at /userapps/sus/common/scripts/quad/InLockChargeMeasurements (revision 16175). These measurements take about 10 minutes to complete for all 4 test masses when we are in low noise. I suggest that after this vent we repeat this measurement in a way similar to the optical lever charge measurements for tracking the charges on the optics.
Calibration:
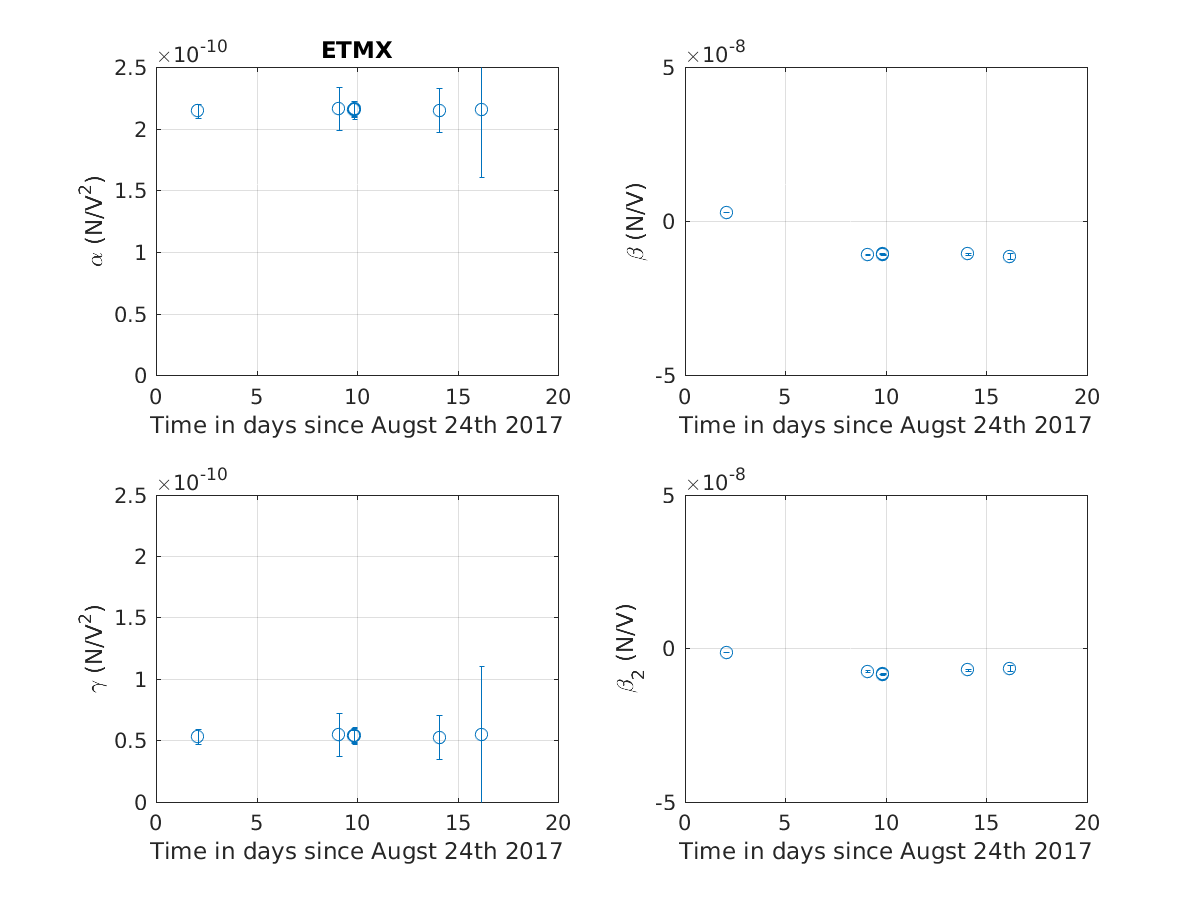
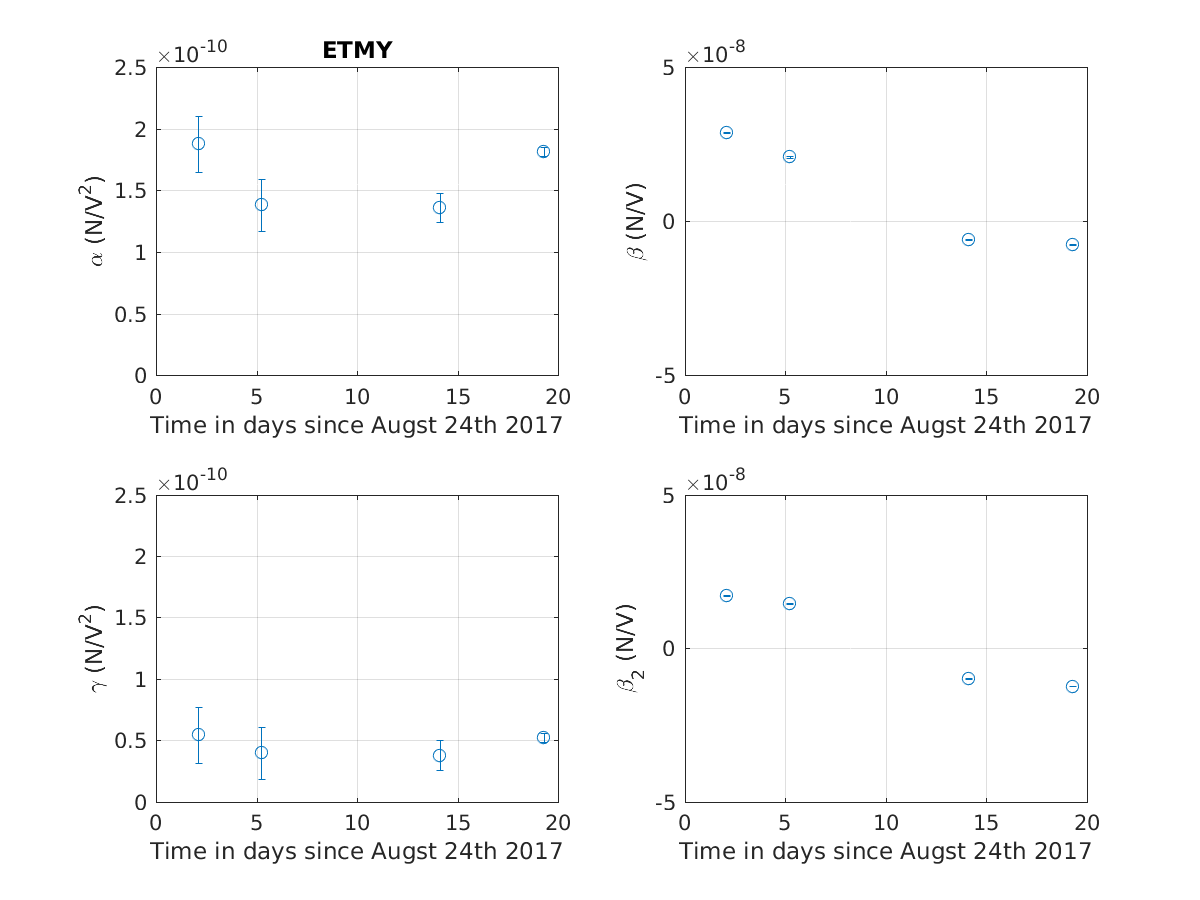
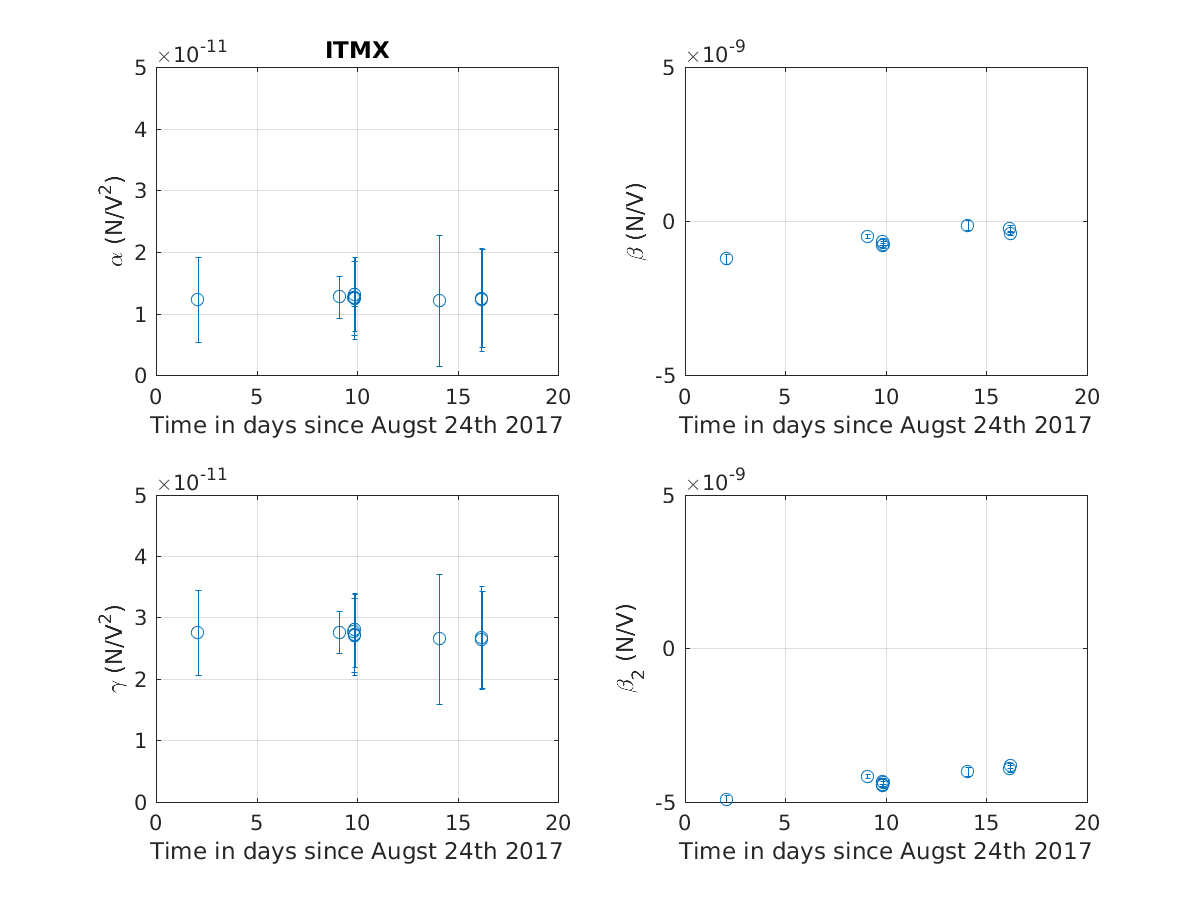
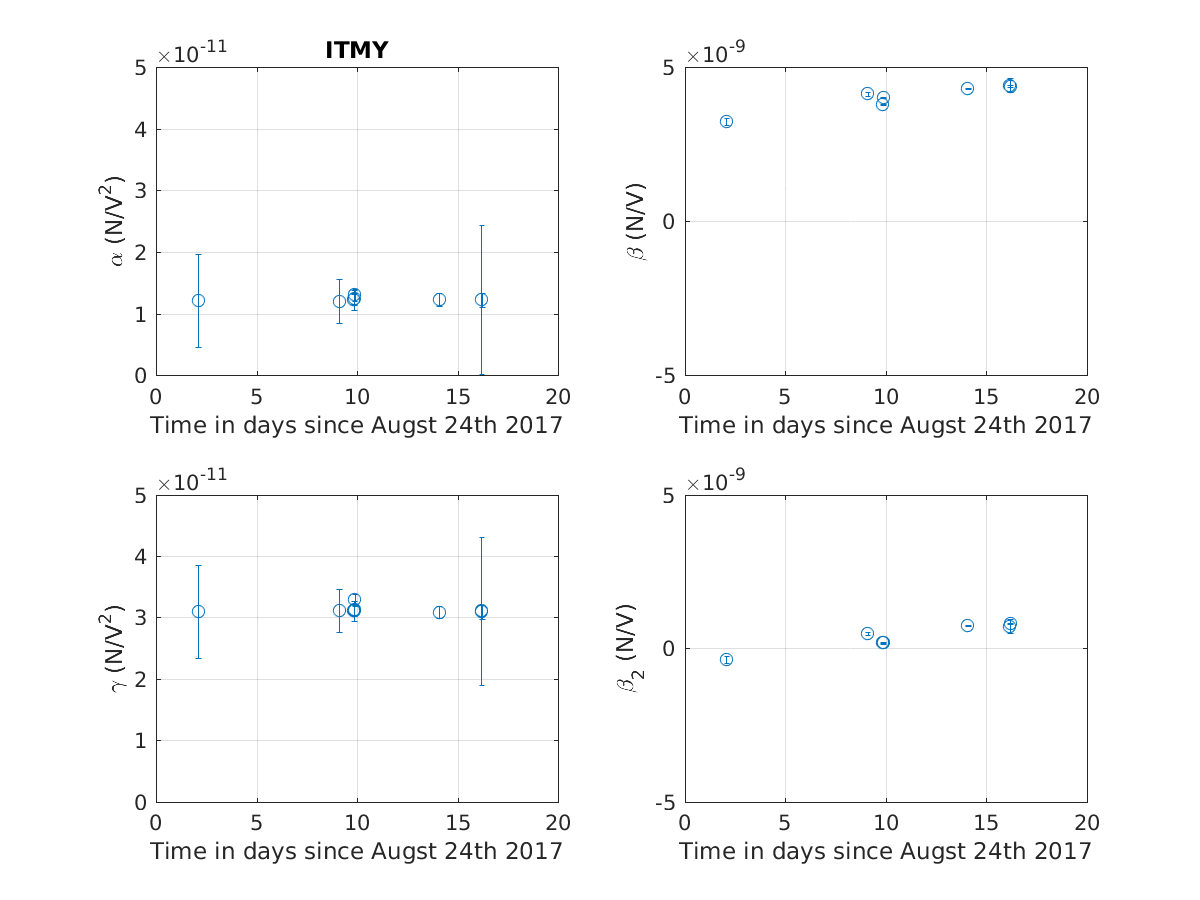
The attached screenshots show the results of these measurements of the 4 coefficients, with error bars based on statistical uncertainty (the coherence of DARM with the excitation). I used two different methods to calibrate the measurements, first calibrating the DAC outputs then using the monitor inputs (where the correct monitors are in the frames, FRS ticket 8995 is in part going to make sure that all the correct monitors are stored). The applied bias voltage I end up with is about 13% lower if I use the DAC outputs (380V) compared to the result I get using the monitor channels (430V), which results in about a 22% discrepancy in the values of alpha and gamma (coefficients that describe the quadratic ESD response). I am using the ESD monitors, since they are consistent with the high voltage that is supplied, and the calibration of the monitors is simpler (especially for the ETM HV divers where the schematics are hard to follow).
Results:
For the ETMs, alpha is around 2e-10 N/V^2, while according to G1100968 it should be 4e-10N/V^2. For ETMY the measurements are inconsistent; alpha and gamma should be unchanged by the discharging. I looked at the L2 L witness sensors to see if differences in the distance between the reaction mass and test mass could explain these discrepancies, it doesn't. For the ITMs, alpha is around 1.2e-11N/V^2; a little higher than the value of 7.5e-12 N/V^2 in G1100968.
The gamma term describes the dielectric force caused by fields which terminate on the conductors surrounding the optic (the cage). This should also be independent of charge, and I'm not aware of any FEM models that predict the size of this term. The coefficients are similar for the ITMs (3e-11N/V^2 for ITMY, 2.7e-11 N/V^2 for ITMX) and ETMs (5.4e-11N/V^2 for ETMX, varying between 4-5e-11 N/V^2 for ETMY). This means that for the ITMs, the forces caused by the field lines that terminate on the suspension cage actually dominate the overall actuation strength of the ESD, not the field lines which begin and terminate on the ESD electrodes.
The beta and beta2 terms are due to the interaction of two different distributions of charge on the optic with the fields from the ESD electrodes. The TMDS at EX was used at days 5+6 on this plot (3 cycles) while it was used for one cycle at EY on day 11. It is surprising that the betas at EX seem to have increased after the discharge, there is only one measurement from before the discharging. I looked back at the data and indeed, the response to driving the electrodes without any bias applied was smaller before the discharging than after. It should be possible to estimate charge densities based on these betas.
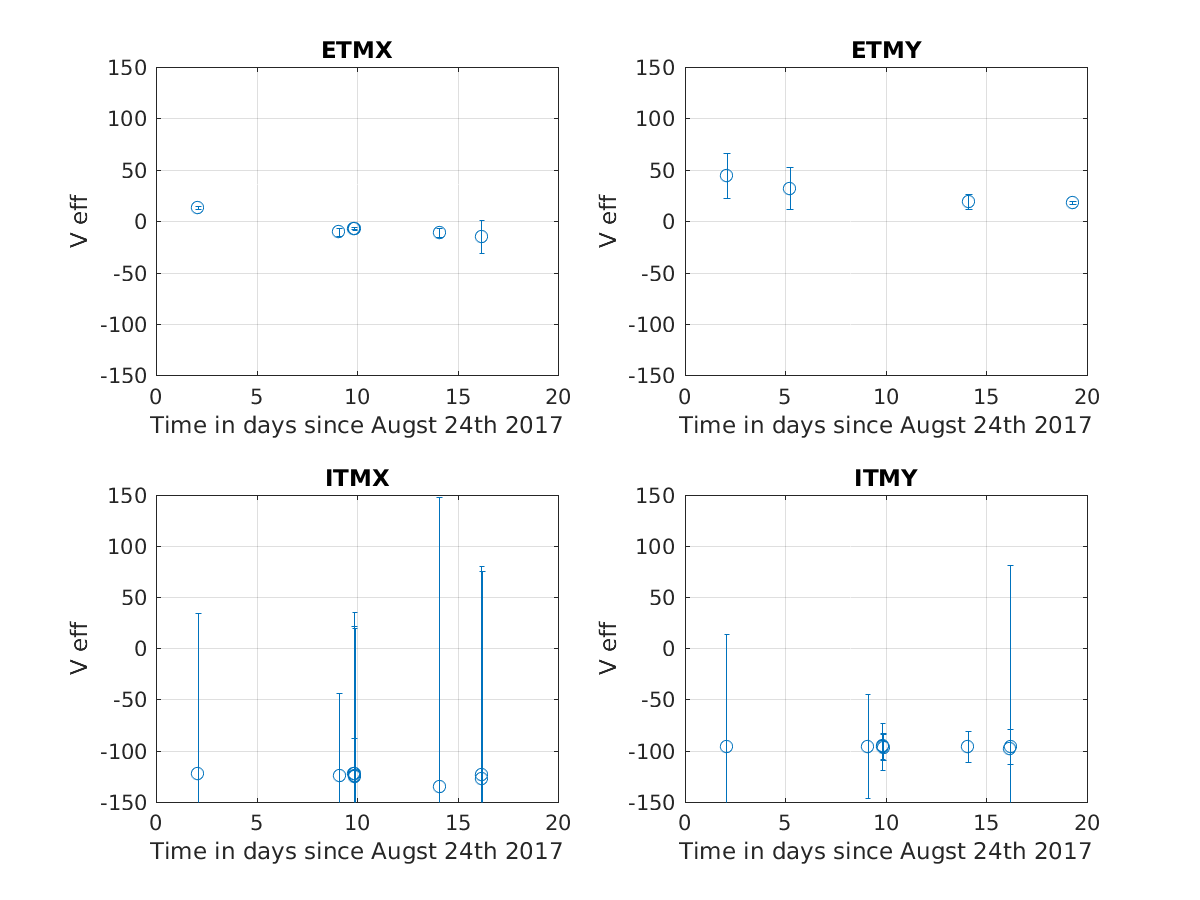
Comparing these measurements to Veff:
In terms of the coefficients measured here, the usual charge measurement measures the bias at which the signal response is minimized, V_eff = (beta-beta2)/2*(alpha-gamma). The fifth attachment here shows Veff calculated from the measured coefficients, this matches pretty well with the results I got from making a longitudinal measurement of Veff in alog 38608 (In that alog I was reporting bias voltages based on the DAC outputs, so they should be about 13% smaller than what is here, which is based on ESDAMON. These ETMY numbers are rather different from the Veff measured using the optical lever in alog 38604
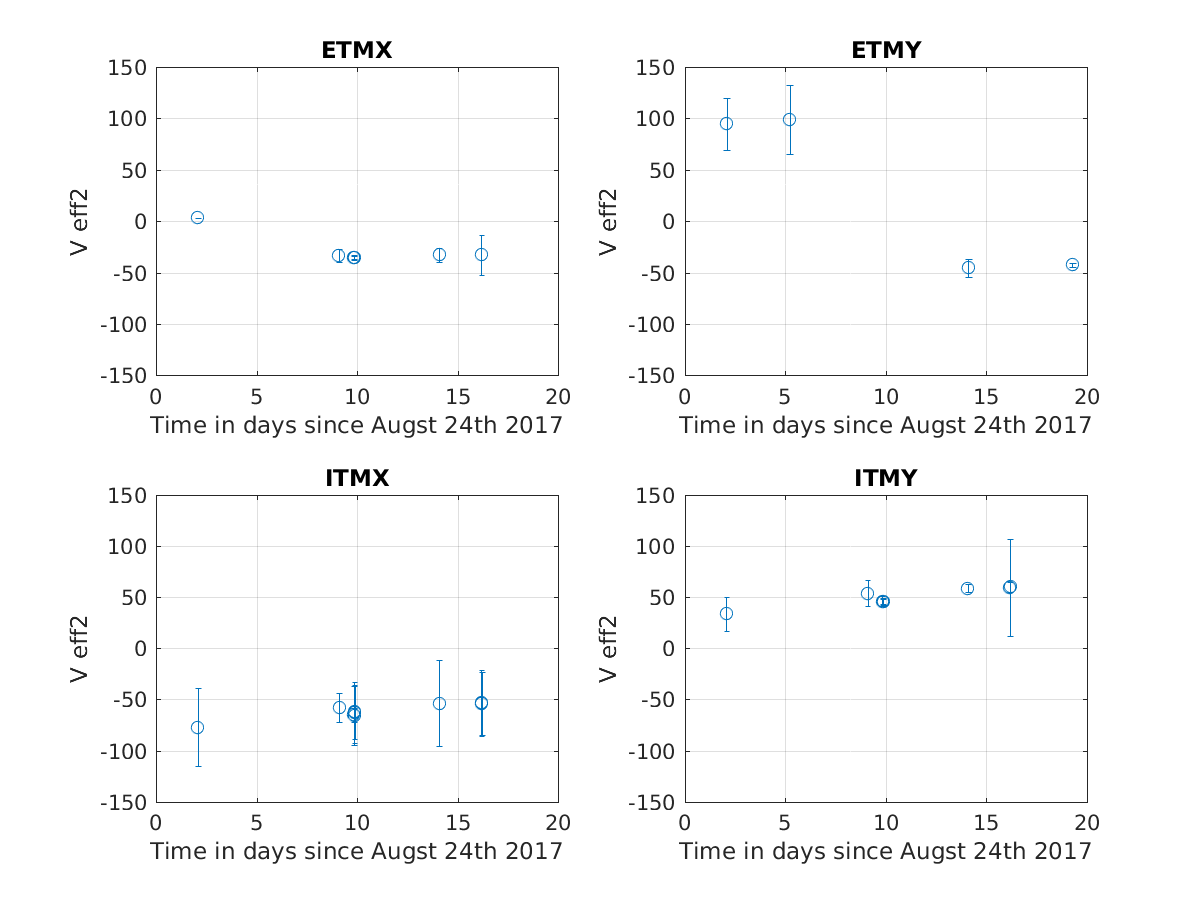
A new Veff2:
If instead of driving the signal electrode and finding the bias voltage that minimizes the response, we can do the same measurement by driving the bias electrode and finding the bias voltage that minimizes that response. This is just a different combination of the ESD coefficients, Veff2 = (beta+beta2)/2(alpha+gamma), which is shown in the 6th attachment to this alog. This is also in reasonable agreement with the measurement I made off this Veff in 38608 . This Veff could also be measured with the optical levers.
A somewhat nicer measurement of all 4 of these paramters could be made by driving the signal and bias electrodes in common and differential. We would need to account for the different low pass filters in the analog paths to these electrodes to do the measurement this way.
Shiela, Thank you and Jeff for making these coupling measurements. I have been worrying about this coupling
for a long time. It is one of the reasons we made an injected ion system for each test mass chamber so that
one could imagine a regular rate of discharge (monthly?) once we baffled/moved the ion pumps. The discharge is a
temporary fix. As we improve the detector sensitivity we are going to hit a limit from the charge on the
test mass just from charge hopping. At some point we will simply have to bite the bullet and coat the entire
mass with a mildly conducting (Gohms/sq) coating and "ground" the test mass through a coating on the silica fibers. I thought
the Stanford group is working on this coating.
RW
TITLE: 09/20 Day Shift: 15:00-23:00 UTC (08:00-16:00 PST), all times posted in UTC
STATE of H1: Planned Engineering
LOG:

Appears that Bubba and crew are in bier garten and Jeff B. is in LVEA. Peter is in the PSL enclosure.

15:21 UTC Hugh to LVEA to survey HEPI
15:30 UTC Filiberto moving SUS chassis from rack on high bay side of HAM6 to rack on other side and rerouting cables with them.
15:36 UTC Richard to LVEA to work with Filiberto.
15:41 UTC Rick to LVEA to work with Hugh
16:04 UTC Travis to LVEA to take cameras off HAM3
16:28 UTC Travis back
16:47 UTC Richard back. Filiberto dressing tip tilt cables.
Rick in HAM2 removing ISS array
17:39 UTC Betsy and Travis to inspect BSC3
17:41 UTC Door being craned (on camera)
17:46 UTC Richard to LVEA to see Fil
17:55 UTC Karen to end Y
17:56 UTC Jeff and Sheila to HAM2 to install last of ISI damper mechanisms
18:10 UTC Gerardo to end Y to pick up TMDS part
18:31 UTC Karen leaving end Y, going to mid Y
18:47 UTC Corey to LVEA to distribute clean tools
18:57 UTC Karen leaving mid Y, going to end X
19:03 UTC Corey back
One door off of HAM3
19:33 UTC Karen leaving end X
21:04 UTC Corey to squeezer bay
21:44 UTC Rick taking visitors through LVEA
22:00 UTC Site weekly meeting
23:02 UTC Hugh to LVEA
Reset ITMX SUS WD and rerequested ALIGNED.
I failed to turn these annulus ion pumps off before doors were removed, so they were exposed to air. HAM3 supply is now off and BSC1 supply is unplugged.
The alignment into the pre-modecleaner needs to be tweaked.  Unfortunately the Picomotor controller
appears to be off-line.  At least the MEDM screen says there's a communication problem with the
driver.

    Minor adjustment to the reference cavity alignment.

    Both the frequency and pre-modecleaner servoes locked without issue.
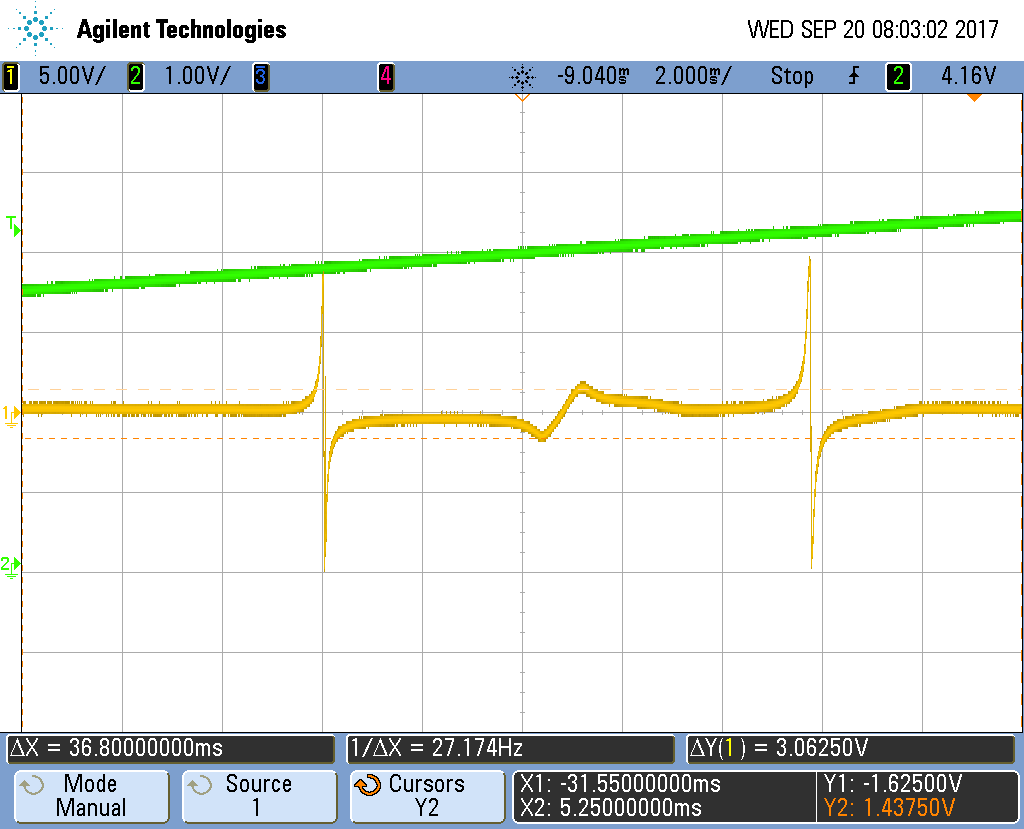
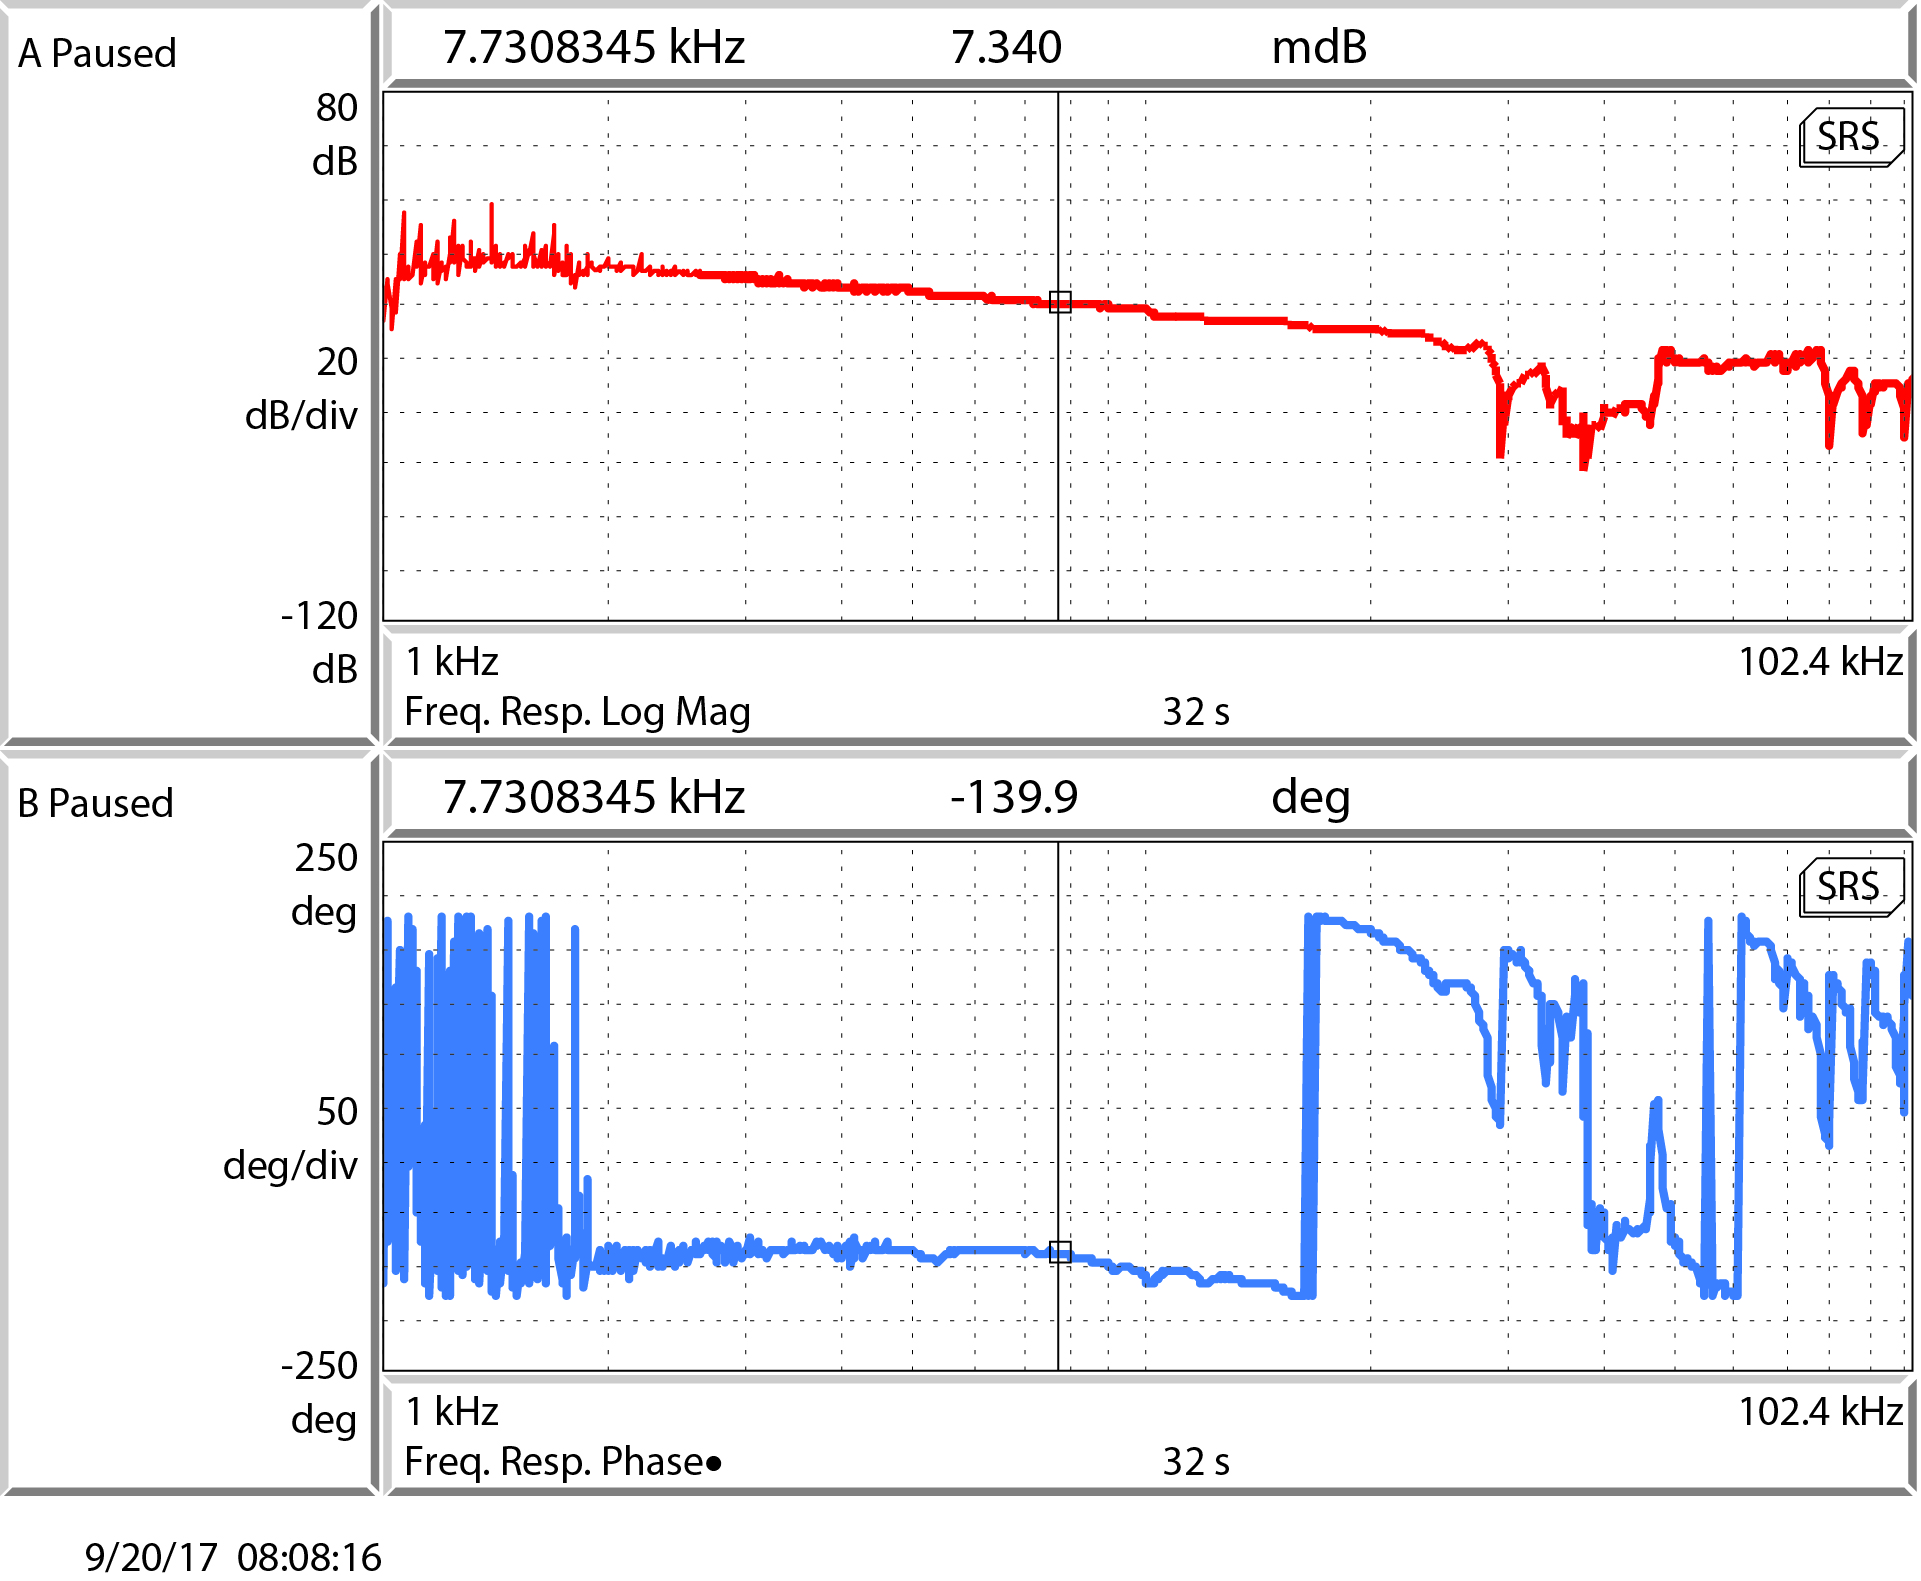
Attached are plots of the injection locking error signal and the servo transfer function.  Note that
the servo transfer function measurement does not include the SR560 low frequency boost stage that was
added before the O2 run.  This measurement was taken with
  - servo gain = 1.00 V
  - reference level = -1.30 V
  - error point offset = 0.20 V
which are the same ones in use for yonks.  The transfer function is comparable to the measurement taken
from before the observing run.

    As noted from yesterday, the RF summing box was placed on to an insulating plastic bag to isolate
it from the front end laser breadboard (and hence the table).  Touching the box did not appear to affect
the injection locking.  However I did notice that the frequency servo went into oscillation whenever I
touched the box and table.

    Suspected grounding problem.  Probably not noticed, or paid attention to, before because we rarely
touch the RF summer.  Will be chasing this up over the next few weeks.
Jeff B, Dave:
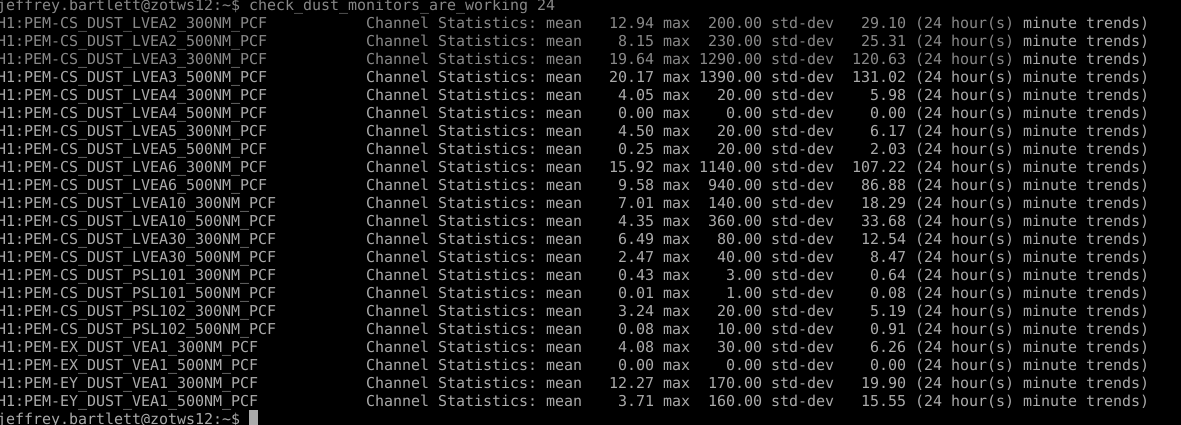
I have updated the check_dust_monitors_are_working script to scan all the LVEA dustmonitors, and added both 300nm and 500nm channels. I also modified the script to allow the user to specify the look-back time in hours (used to be days). This is needed as the script cannot transit a daq restart time.
Here is the output for the past 20 hours of dust data:
david.barker@zotws6: check_dust_monitors_are_working 20
H1:PEM-CS_DUST_LVEA2_300NM_PCF Channel Statistics: mean 9.43 max 280.00 std-dev 33.31 (20 hour(s) minute trends)
H1:PEM-CS_DUST_LVEA2_500NM_PCF Channel Statistics: mean 1.94 max 40.00 std-dev 6.41 (20 hour(s) minute trends)
H1:PEM-CS_DUST_LVEA3_300NM_PCF Channel Statistics: mean 114.62 max 10320.00 std-dev 1026.39 (20 hour(s) minute trends)
H1:PEM-CS_DUST_LVEA3_500NM_PCF Channel Statistics: mean 101.03 max 7970.00 std-dev 803.59 (20 hour(s) minute trends)
H1:PEM-CS_DUST_LVEA4_300NM_PCF Channel Statistics: mean 4.57 max 30.00 std-dev 6.38 (20 hour(s) minute trends)
H1:PEM-CS_DUST_LVEA4_500NM_PCF Channel Statistics: mean 0.00 max 0.00 std-dev 0.00 (20 hour(s) minute trends)
H1:PEM-CS_DUST_LVEA5_300NM_PCF Channel Statistics: mean 6.78 max 320.00 std-dev 31.90 (20 hour(s) minute trends)
H1:PEM-CS_DUST_LVEA5_500NM_PCF Channel Statistics: mean 7.40 max 740.00 std-dev 73.63 (20 hour(s) minute trends)
H1:PEM-CS_DUST_LVEA6_300NM_PCF Channel Statistics: mean 6.12 max 200.00 std-dev 20.86 (20 hour(s) minute trends)
H1:PEM-CS_DUST_LVEA6_500NM_PCF Channel Statistics: mean 3.16 max 250.00 std-dev 25.34 (20 hour(s) minute trends)
H1:PEM-CS_DUST_LVEA10_300NM_PCF Channel Statistics: mean 30.58 max 2590.00 std-dev 257.52 (20 hour(s) minute trends)
H1:PEM-CS_DUST_LVEA10_500NM_PCF Channel Statistics: mean 24.54 max 2130.00 std-dev 213.26 (20 hour(s) minute trends)
H1:PEM-CS_DUST_LVEA30_300NM_PCF Channel Statistics: mean 4.78 max 30.00 std-dev 6.08 (20 hour(s) minute trends)
H1:PEM-CS_DUST_LVEA30_500NM_PCF Channel Statistics: mean 1.45 max 70.00 std-dev 8.00 (20 hour(s) minute trends)
H1:PEM-CS_DUST_PSL101_300NM_PCF Channel Statistics: mean 0.68 max 15.00 std-dev 1.72 (20 hour(s) minute trends)
H1:PEM-CS_DUST_PSL101_500NM_PCF Channel Statistics: mean 0.31 max 24.00 std-dev 2.42 (20 hour(s) minute trends)
H1:PEM-CS_DUST_PSL102_300NM_PCF Channel Statistics: mean 4.32 max 50.00 std-dev 8.14 (20 hour(s) minute trends)
H1:PEM-CS_DUST_PSL102_500NM_PCF Channel Statistics: mean 0.10 max 10.00 std-dev 0.99 (20 hour(s) minute trends)
H1:PEM-EX_DUST_VEA1_300NM_PCF Channel Statistics: mean 13.76 max 150.00 std-dev 22.49 (20 hour(s) minute trends)
H1:PEM-EX_DUST_VEA1_500NM_PCF Channel Statistics: mean 5.99 max 60.00 std-dev 10.98 (20 hour(s) minute trends)
H1:PEM-EY_DUST_VEA1_300NM_PCF Channel Statistics: mean 675.02 max 4180.00 std-dev 1015.13 (20 hour(s) minute trends)
H1:PEM-EY_DUST_VEA1_500NM_PCF Channel Statistics: mean 22.69 max 160.00 std-dev 34.25 (20 hour(s) minute trends)
david.barker@zotws6:
All Damping installed on the HAM2 ISI for Corners 2 & 3 as well as the Horizontal GS13 Can Damping on Corner1. Remainder is Corner1 Spring and Flexure dampers and the Vertical GS13 Can Damper. Working with PSL on the ISS cabling which complicates the Corner1 work on the blade spring.
J. Kissel, H. Radkins, J. Warner, B. Weaver, T. Sadecki

Given the speed at which Jim and Hugh put in Corner 2 and Corner 3 dampers, Jim and I were able to B&K hammer those corners in prep for tuning the smaller Tuned Mass Dampers.

I attach the data from the B&K results, plus a bunch of pictures from the day.

Regarding the B&K results -- remember, we expect that the Blade Srping Dampers will reduce the first bending mode of the blade from ~153 to ~139 Hz. We see exactly that again here in HAM2. However, while the resonance is clear in Corner 3, the feature looks not-so-clear in Corner 2.

I'm confident this is due to the orientation of the accelerometer: we weren't able to find the same mounting plate that we used in 2016 (see pics from LHO aLOG 26488), so we just mounted it directly to the baseplate of stage 1. In doing so, we got lucky with Corner 3 and the Z axis of the accelerometer was well-aligned with vertical. In Corner 2, we were not so lucky (see pg 9 and 10 of attached).

Still, I think it's good enough to confirm that the Corner 2 resonance is where expected, and we'll tune the TMDs accordingly.

This morning, the door crew was at it early and had the doors off of HAM2 (E and W) by 9:30am. Hugh and Jeff B started the entry contamination control, Hugh locked the ISI, and I locked the 4 large SUS (PRM, PR3, MC1, MC3) in order to put the face caps on for protection over the first few days of ISI work. (The optics are the only masses locked, and somewhat lightly in order to just support the addition of the caps on.) WHile there, Hugh and I also removed the 2 MC free-standing arc baffles which are going to be replaced, and the OPLEV 2" mirror/mount which is going to be replaced.
Hugh started the HAM2 ISI damper work mid morning, which is expected to run the next couple of days with Jim.
Since they were all geared up and ahead of schedule, Bubba and crew went ahead and pulled the BSC3 W door in the biergarten.
attached is a striptool trend of dust monitor 300 (BSC3) 0.3um counts while the BSC3 door was removed.
The Y scale dotted lines are 200 and 400 counts, the max number is 435
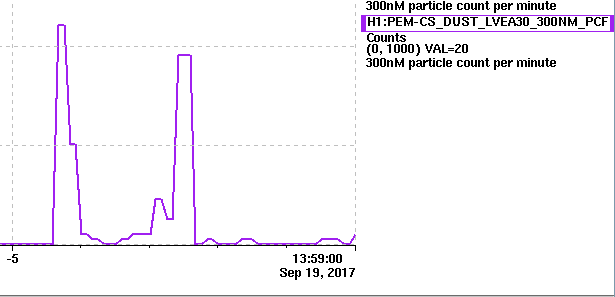
We also turned off the PR3 OPLEV, hence why that SUM is near zero.
I also unplugged the power supply adapter box for HAM3 Optical Lever Transceiver to get an open power port to power the B&K setup.

For pictures of today's work, check out 38716.
I attach the two money shots I got here though, 'cause they're great.

For future reference, it's Betsy and Hugh in garb.

I did a couple more measurements of the ESD actuation tonight.
1)I re-ran the script that allows us to measure 4 coefficicents for each test mass, (described in 38387). Plots coming soon...
2) I measured Veff by driving the signal electrodes in length while we were locked and adjusting the bias voltage to minimize the coupling to DARM. This can be checked against the results from the first measurement. Veff = (beta-beta2)/2(gamma-alpha)
3) For some optics I also measured a different effective bias, by driving the bias path at 12 Hz and changing the offset in the bias path to minimize the coupling to DARM. Veff 2= (beta+beta2)/2(alpha+gamma)
| Veff | Veff 2 (driving bias) | |
| ETMX | -10.8 | |
| ETMY | 24.13 | 38 |
| ITMX | 122.4 | -53.6 |
| ITMY | 95 | 54.8 |
Here I have written these as positive if the voltage requested out of the DAC is positive, although in reality there is a sign flip in some of the drivers (I will edit this entry in the morning with the correct sign).
The signs are wrong for the ITMs in this table. Multiply all ITM results by -1.
On friday Thomas and I ran excitations on all 4 ESDs in order to measure the 4 coefficients in this equation for the force applied by the ESDs (G1600699) Equation 2:
F = α (V_b-V_s)2 +β (V_b+V_s)+ β _2(V_b-V_s)+γ (V_b+V_s)2
The first 2 excitations for each suspension were on the bias path with no signal voltage so that the linear response is:
F = [β+β_2+2(α+γ)V_b] δV_b
The bias path was excited twice, first with the normal bias of 380 V on and second with no bias. Then the script excited the signal path which gives a linear response of:
F = [β-β_2+2(α+γ)V_b+2(α-γ)V_s] δV_s
This path is excited 3 times, once with no DC offset on any electrodes, once with an offset of 7.6Volts on the signal electrodes, and once with the bias at its normal value of 380V.
The first 4 of these measurements allow us to make a complete measurement of all four coefficents, α, β β_2, and γ The fifth measurement is redundant and could be skipped, I used it as a sanity check. I am still worried that I have some signs wrong which are making these results confusing.
| ETMX | ETMY | ITMX | ITMY | |
| α (N/V^2) | 2.1e-10 | 2.0e-10 | 8e-11 | 5.5e-11 |
| β(N/V) | -9.9e-10 | 2.0e-8 | 1.0e-8 | 5.6e-9 |
| β_2 (N/V) | 2.8e-9 | 3.2e-8 | -4.2e-9 | -8.5e-9 |
| γ | 1.5e-10 | 1.2e-10 | -4.0e-11 | -1.2e-11 |
| V_eff = (beta-Beta2)/(2*(alpha-gamma)) | -31 V | -75 V | 60 V | 105 V |
All of the scripts needed for taking the measurement and getting the coefficents are in userppas/sus/common/quad/scripts/InLockChargeMeasurements/
The table above is wrong because of multiple minus signs (which are different between the ITM and ETM ESD drivers) being wrong. Here is a corrected table:
| ETMX | ETMY | ITMX | ITMY | |
| α (N/V^2) | 9.6e-11 | 8.7e-11 | 4.9e-11 | 5.8e-11 |
| β(N/V) | -1e-9 | 2e-8 | -1e-8 | -5.6e-9 |
| β_2 (N/V) | 2.8e-9 | 3.2e-8 | 4.2e-9 | 8.5e-9 |
| γ | 2.6e-10 | 2.3e-10 | -9.2e-12 | -1.5e-11 |
| V_eff = (beta-Beta2)/(2*(alpha-gamma)) | 12 | 38 | -124 | -97 |
The values in this table still had some calibration errors. New log coming soon.


