david.barker@LIGO.ORG - posted 10:28, Saturday 16 September 2017 - last comment - 10:42, Saturday 16 September 2017(38669)
remote login working
Richard and Jonathan have fixed remote login to CDS.
Richard and Jonathan have fixed remote login to CDS.
I am able to see FMCS from my computer at home and all FMCS systems have restarted and are working towards back to normal.
We had what appears to be a site-wide power glitch at 08:12 PDT this morning. Both CDS and GC UPS systems report being on battery power for about 6 seconds. Systems on UPS power rode through this, all other systems are down.
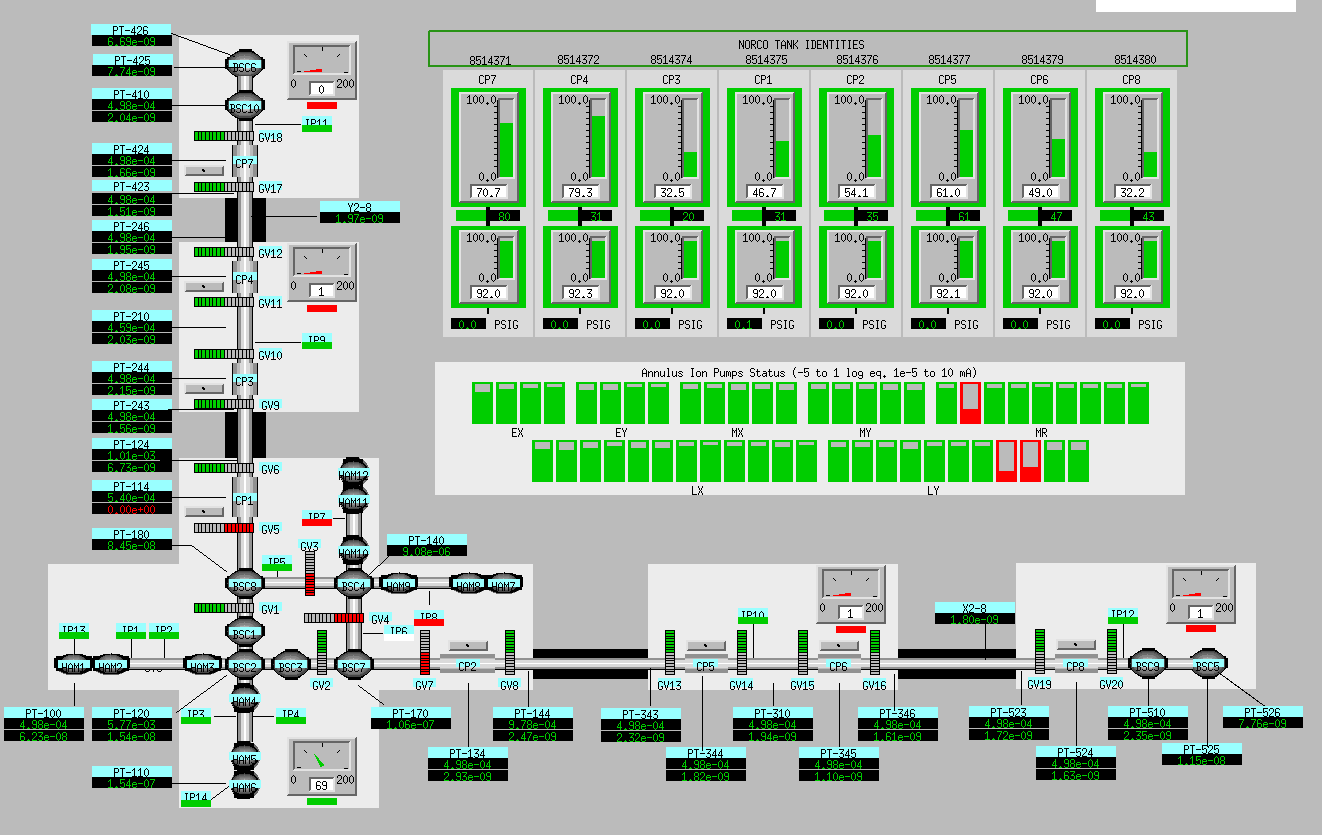
Vacuum controls is OK, MEDM overview screen is attached. Also DAQ is OK.
Systems down includes end station Beckhoff, all front ends, FMCS. We are getting multiple text alarms due to the systems being INVALID.
Here is the GC-UPS system's report:
Subject: lookout UPS gc-osb Power Failure !!!
lookout UPS gc-osb Power Failure !!!
APC : 001,035,0858
DATE : 2017-09-16 08:12:37 -0700
HOSTNAME : lookout
VERSION : 3.14.12 (29 March 2014) debian
UPSNAME : gc-osb
CABLE : Ethernet Link
DRIVER : SNMP UPS Driver
UPSMODE : Stand Alone
STARTTIME: 2017-08-22 08:29:07 -0700
STATUS : ONBATT
LINEV : 120.0 Volts
LOADPCT : 26.0 Percent
BCHARGE : 100.0 Percent
TIMELEFT : 209.0 Minutes
MBATTCHG : 15 Percent
MINTIMEL : 5 Minutes
MAXTIME : 0 Seconds
MAXLINEV : 121.0 Volts
MINLINEV : 120.0 Volts
OUTPUTV : 120.0 Volts
SENSE : Unknown
ITEMP : 22.0 C
BATTV : 211.0 Volts
LINEFREQ : 60.0 Hz
LASTXFER : Unacceptable line voltage changes
NUMXFERS : 4
XONBATT : 2017-09-16 08:12:31 -0700
TONBATT : 6 Seconds
CUMONBATT: 6556 Seconds
XOFFBATT : 2017-09-10 14:13:57 -0700
SELFTEST : OK
STESTI : 168
STATFLAG : 0x05060010
EXTBATTS : 20
BADBATTS : 0
END APC : 2017-09-16 08:12:37 -0700
Here are the CDS UPS reports (20 seconds on battery power):
Name : ups-msr-0
Location : LHO MSR
Contact : CDS Administrators
http://ups-msr-0.cds.ligo-wa.caltech.edu
http://10.99.3.10
Serial # : ZA0522010987
Device Ser #: PD0615240264
Date: 09/16/2017
Time: 08:12:29
Code: 0x0109
Warning - UPS: On battery power in response to an input power problem.
---------------------------------------------------------
Name : ups-msr-0
Location : LHO MSR
Contact : CDS Administrators
http://ups-msr-0.cds.ligo-wa.caltech.edu
http://10.99.3.10
Serial # : ZA0522010987
Device Ser #: PD0615240264
Date: 09/16/2017
Time: 08:12:49
Code: 0x010A
Informational - UPS: No longer on battery power.
For reasons unknown, we are unable to initiate new remote login sessons to lhocds and cdslogin. Bubba is currently logged in, presumably he started his session prior to the power glitch. Jonathan suspects the cdsadminctrl machine.
The good news is Bubba is able to remotely view the FMCS status.
The bad news about the remote access issus is that I am currently unable to turn off the cell phone texter, and we are getting multiple messages. This will quiet down as the alarms age.
J. Oberling, E. Merilh, P. King
A rather frustrating day with little progress. We started in the morning by turning down the diode current for the NPRO and the MOPA to get 35 W out of the MOPA. After trying several different settings, at Peter's suggestion we set the NPRO to output ~1.8 W; for this the diode current was set to 2.221 A, which yielded an output power of 1.81 W, which in turn gave 1.56 W at the entrance to the MOPA. Before adjusting the MOPA diode currents too much we wanted get a look at the beam profile, as adjusting the diode current by too much can change the beam profile (this is where things began to fall apart...). We intially set the WinCam behind the shutter for the 35W DBB path, as this was the only spot with enough room for the WinCam; the MOPA diode currents were set at 44.0 A for D1 and D2, and 45.0 for D3 and D4 (a leftover from earlier adjustments). The beam profile here looked horrendous. It was at least round, but there was a significant shoulder that ringed the bottom half of the beam; changing the MOPA diode currents up and down only served to make the profile worse. Seeing this, we decided to go ahead and skip the MOPA diode current adjustment (leaving the currents at the previously stated level) and move straight into mode matching.
From section 4.3.4 of the 35W FE laser user manual (T0900646), the MOPA wants a 150 µm diameter beam approximately 30 mm inside the MOPA enclosure. Using the leakage beam on mirror FE_M4, we measured out the required distance and set up the WinCam. The beam diameter at this point was ~330 µm horizontal and ~377 µm vertical. We then proceeded to adjust the mode matching lenses to improve this. We moved lens FE_L3 towards the NPRO by a few cm (had to loosen the pedestal the lens was attached to in order to make the move) and lens FE_L4 towards the NPRO by ~4 mm. This gave us a beam diameter of ~290 µm horizontal and ~310 µm vertical; still not where it should be, but better than it was. We then installed the 200W power meter at the exit of the FE and turned on the MOPA. At the same pump diode currents (44.0 and 45.0 A respectively), the laser was outputting 28.5 W. Ed tweaked the beam alignment into the MOPA and we ended up with 36.0 W output from the FE. Unfortunately, the beam profile was unchanged (I did not have the presence of mind to get a picture of the beam here).
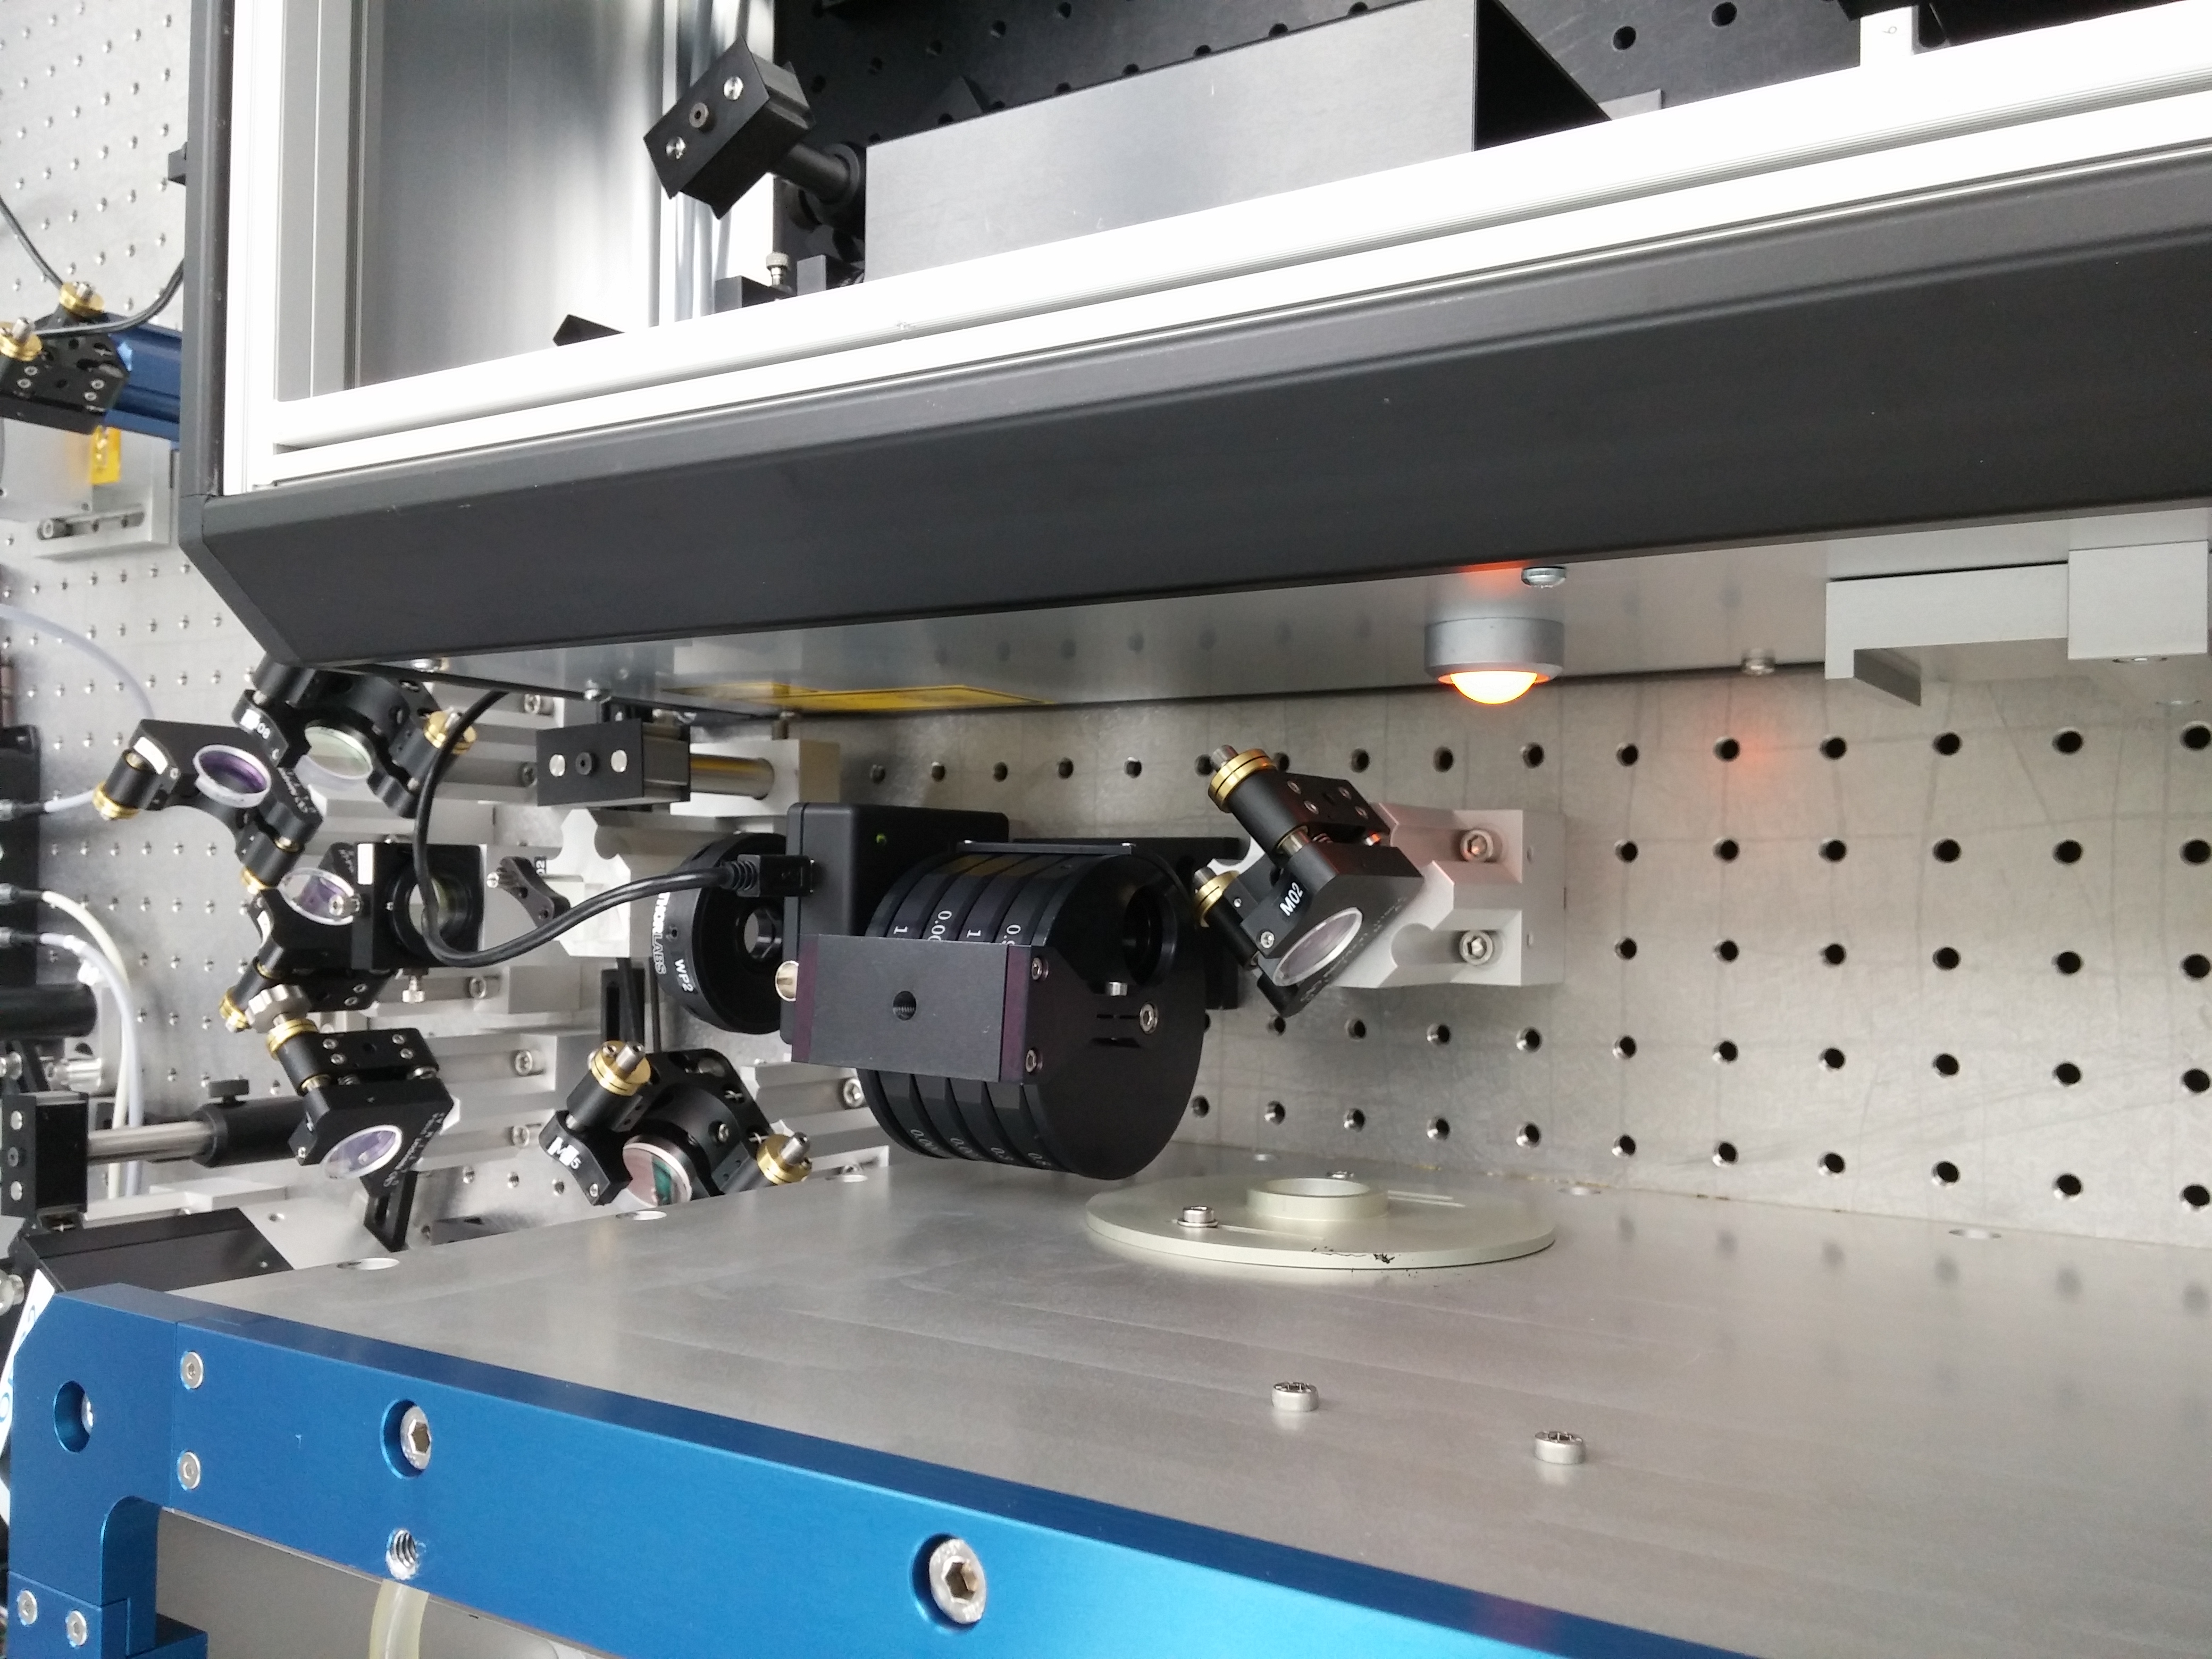
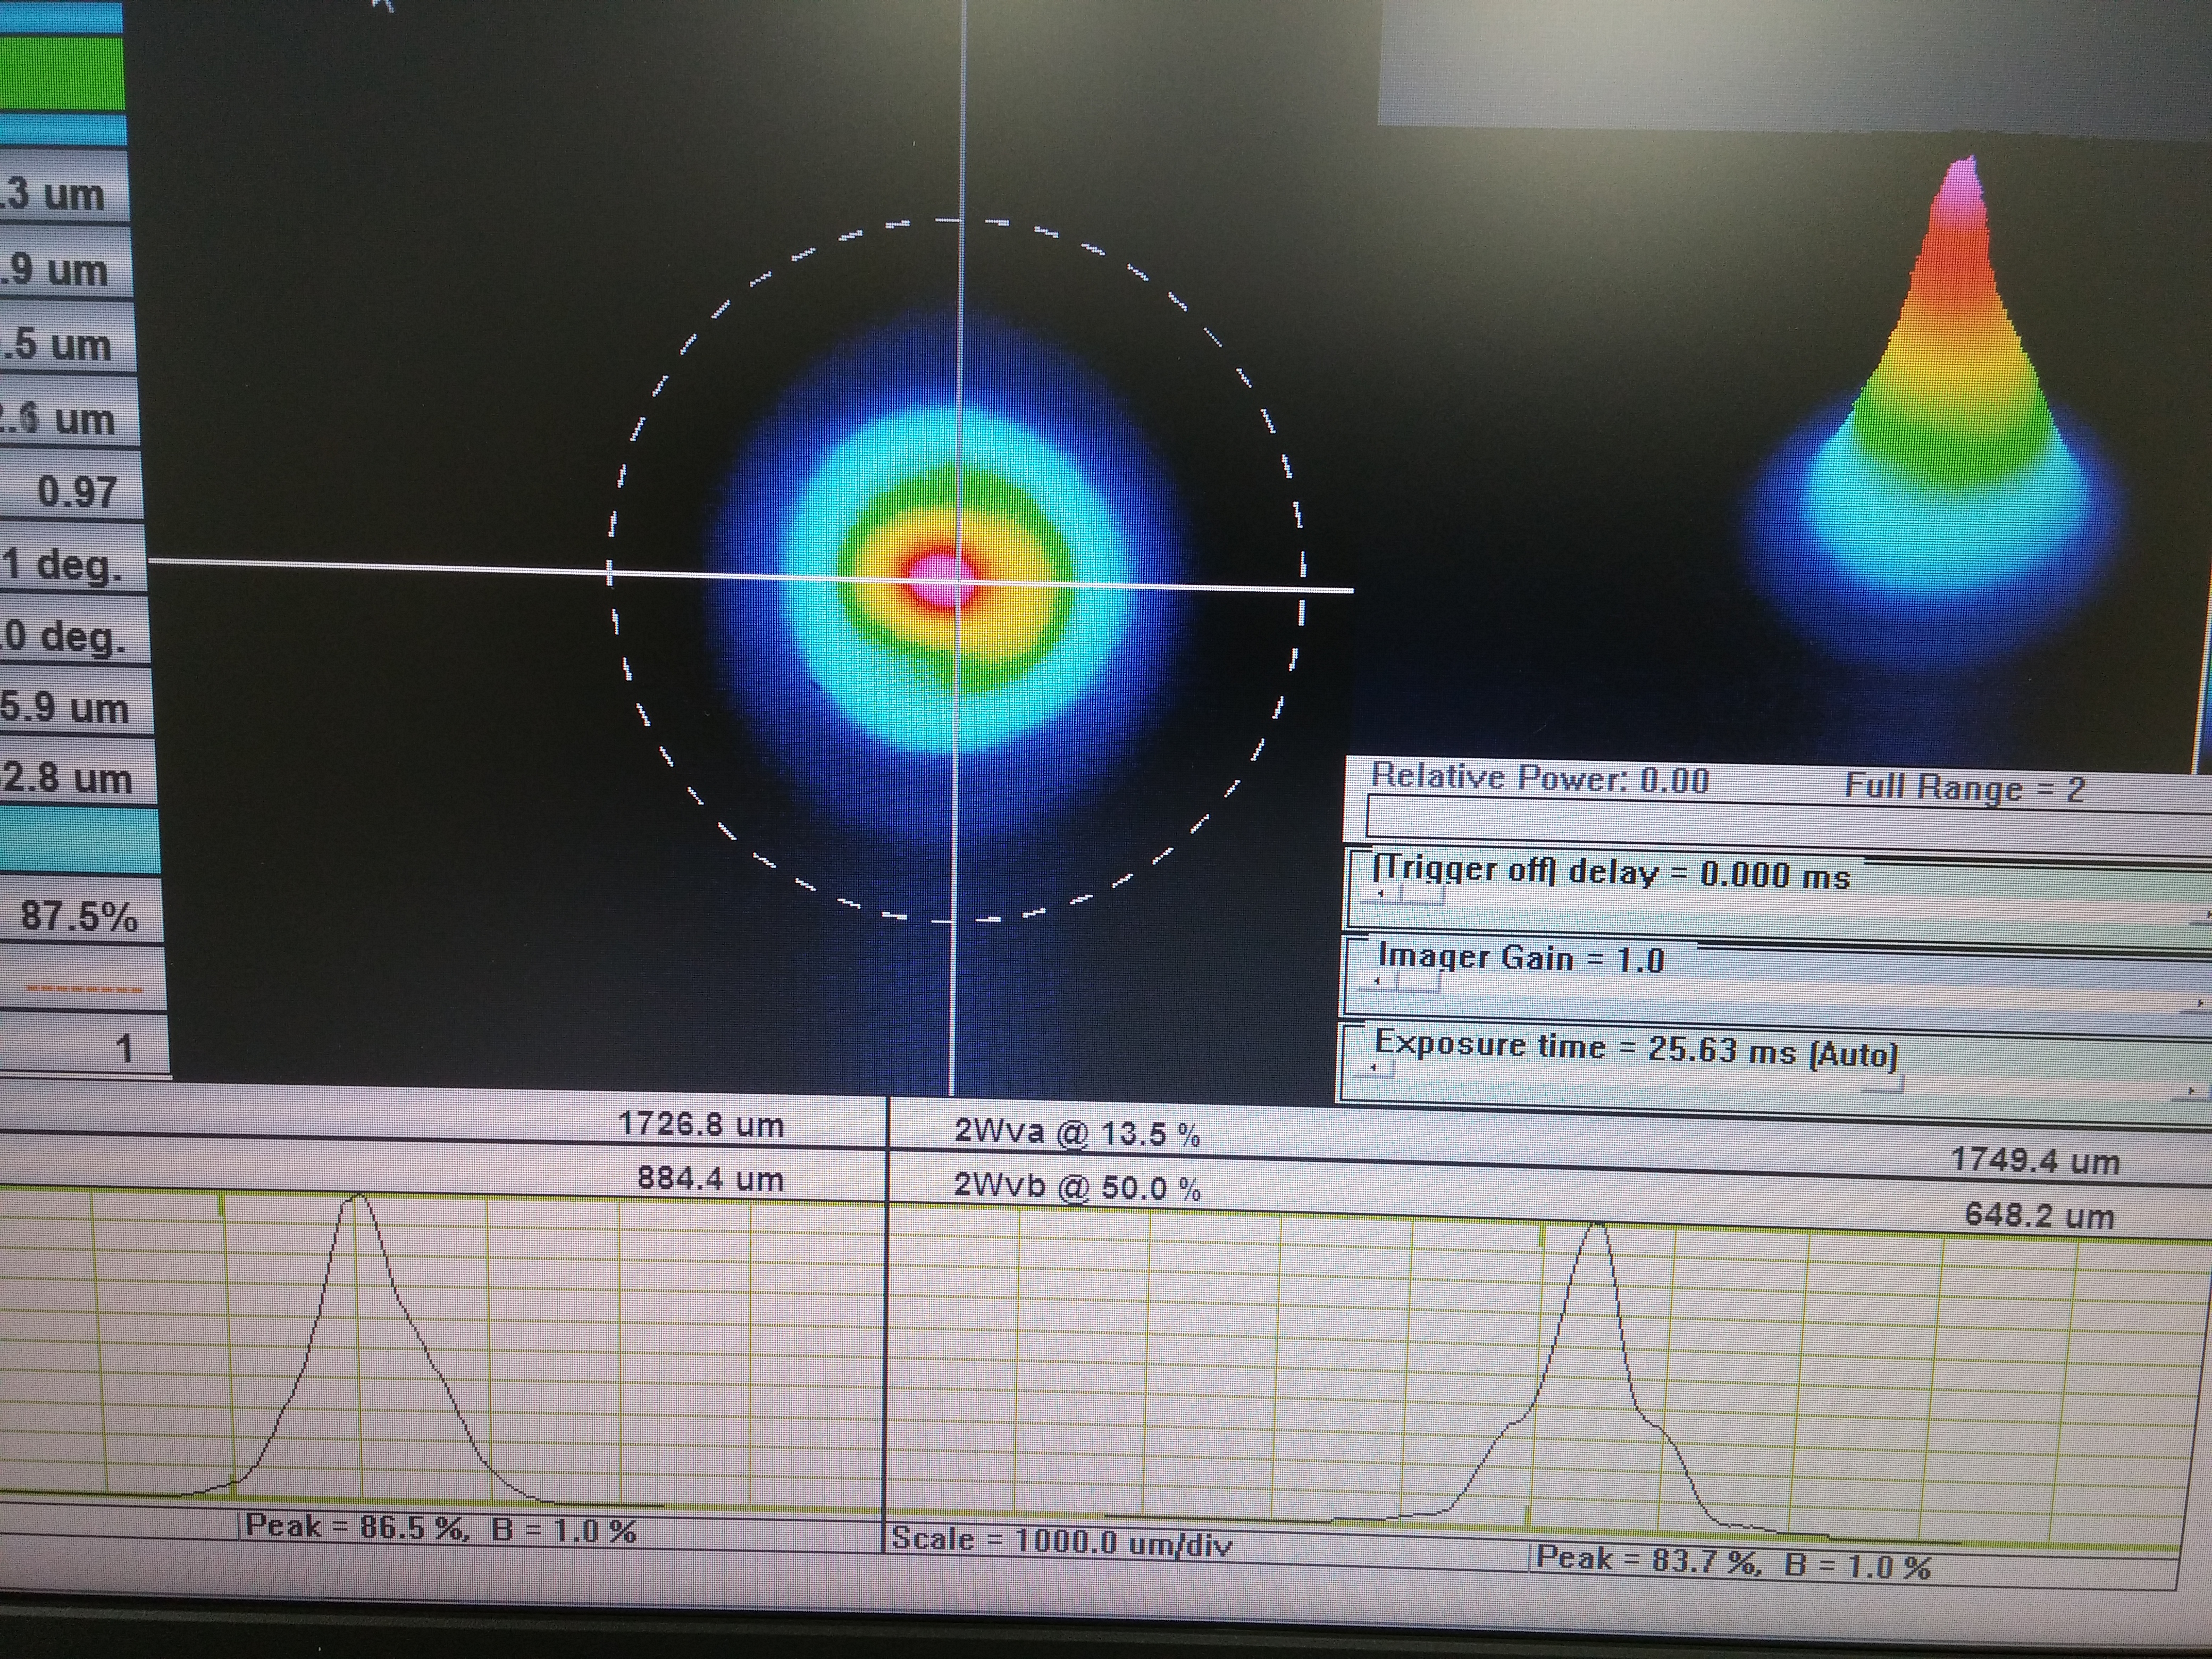
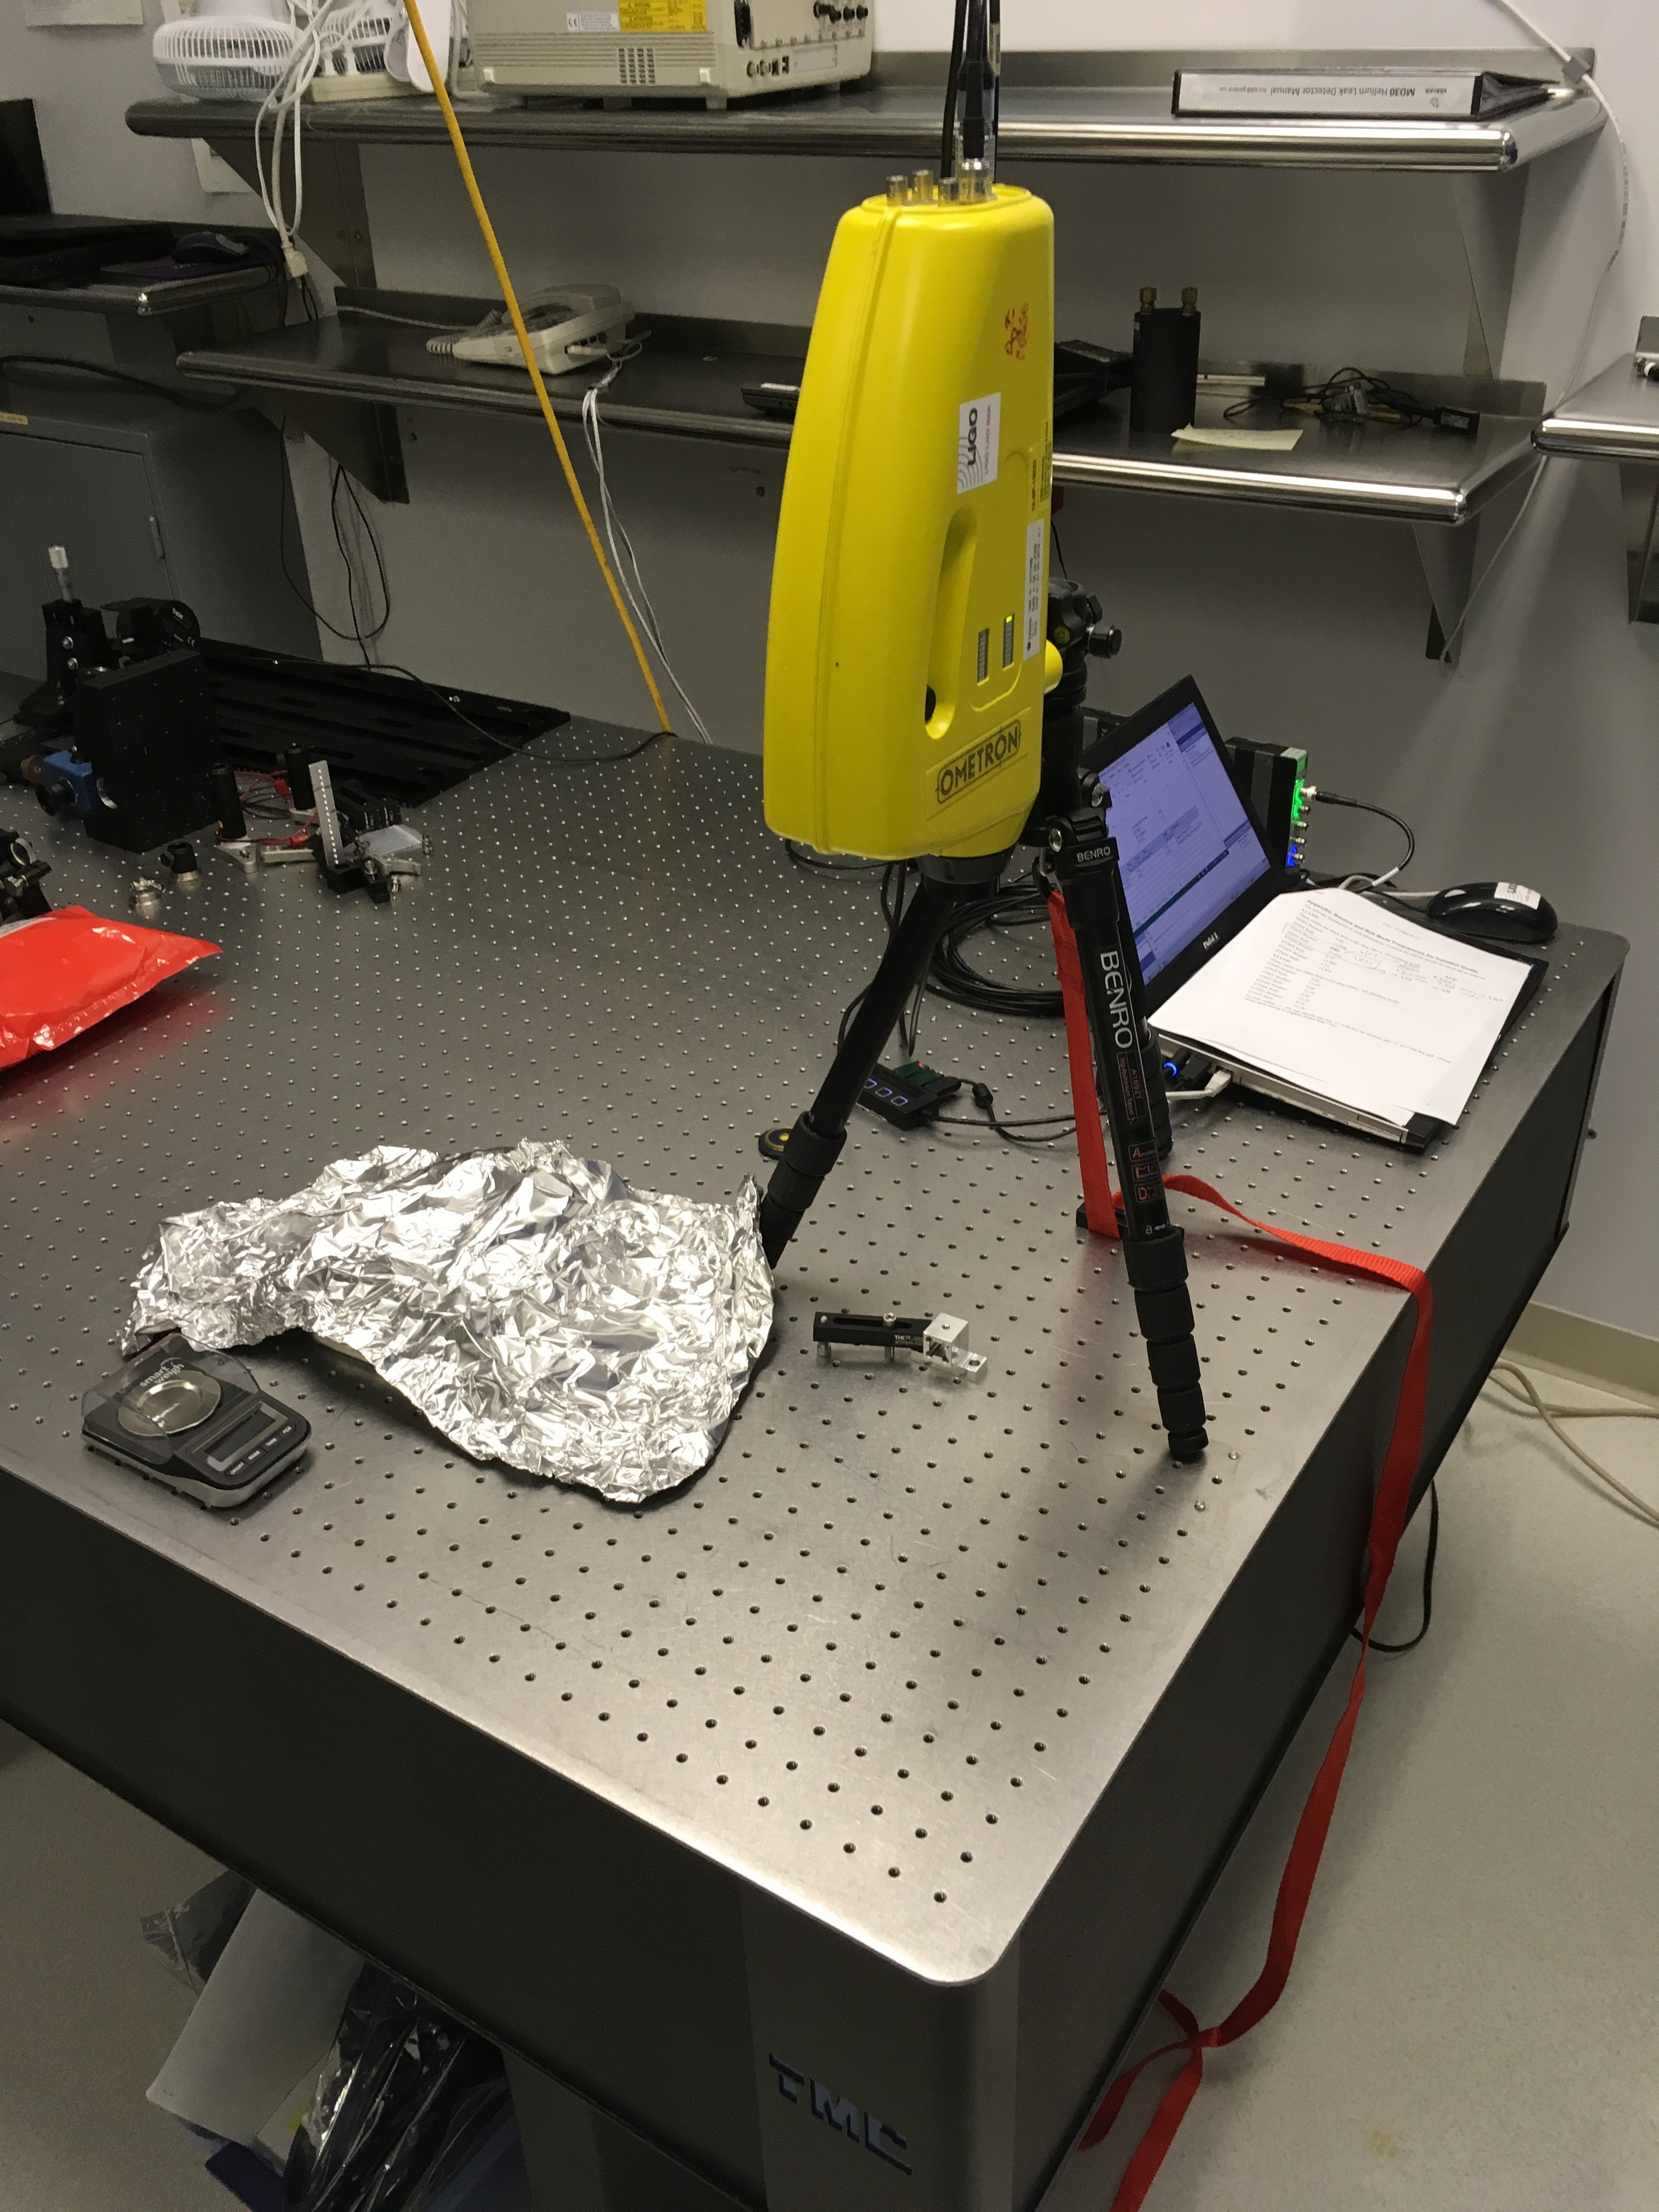
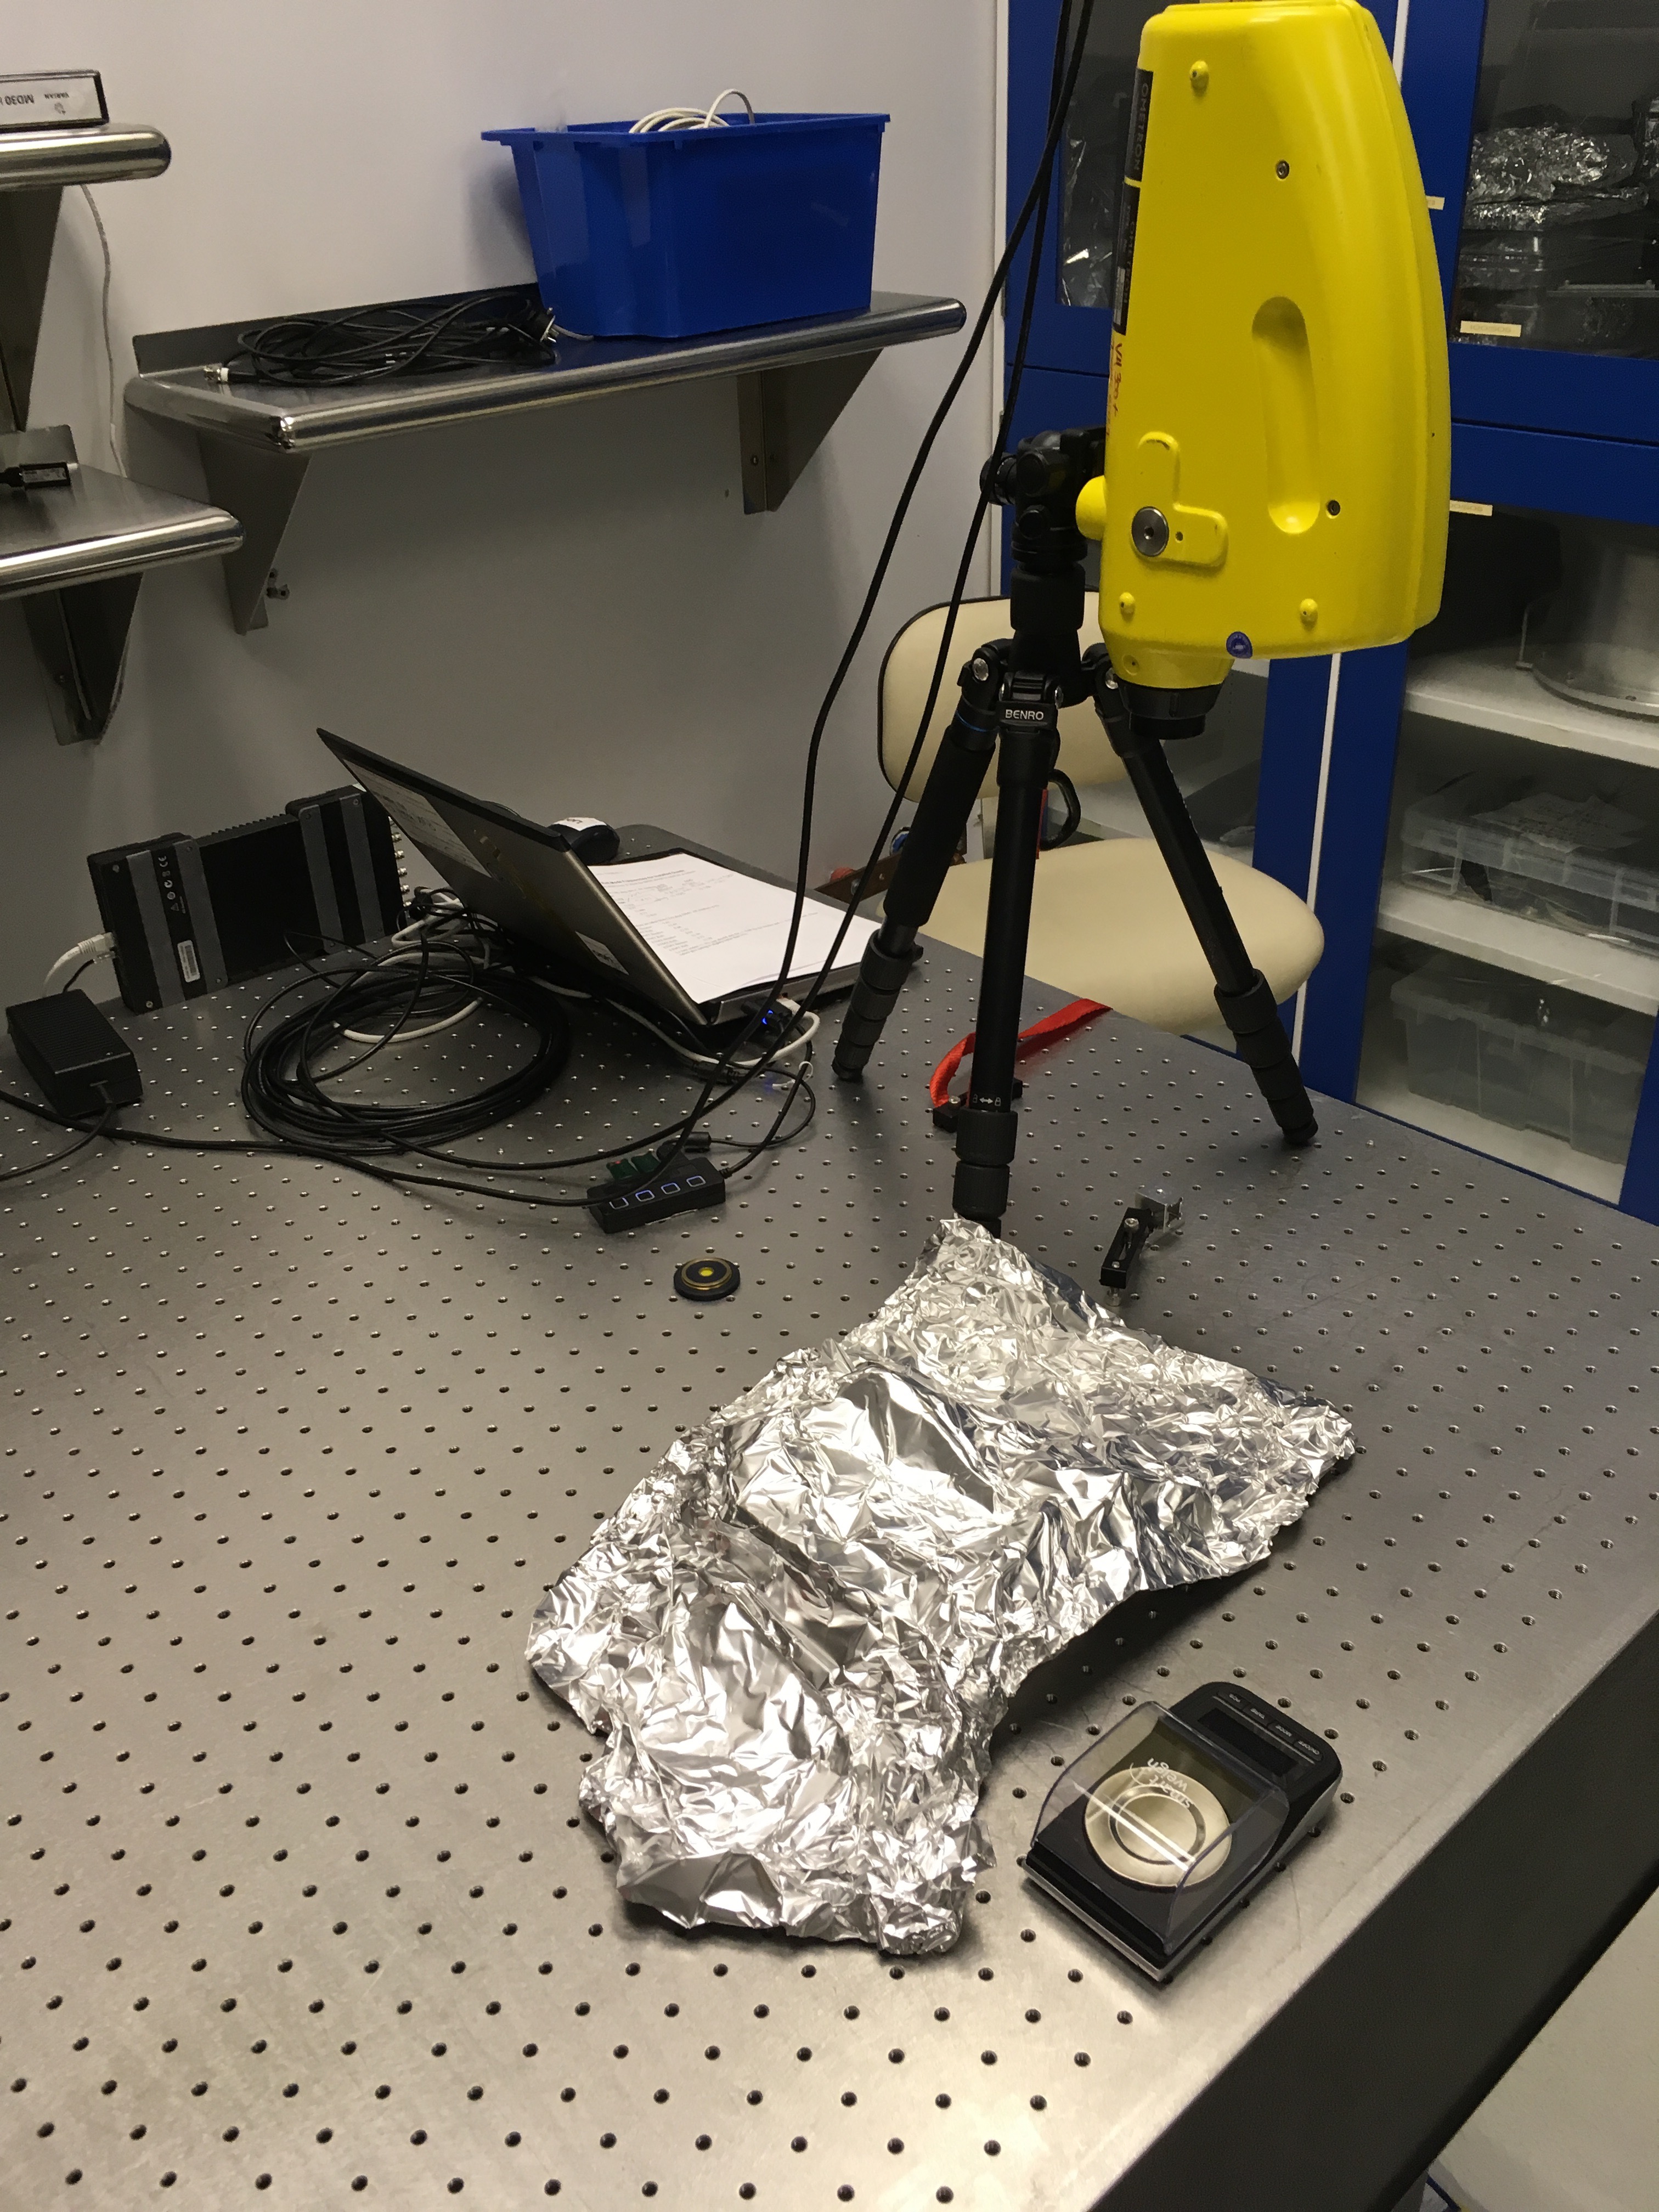
Thinking that maybe we were clipping on something, we checked the FE alignment through the HPO irises to get an idea of how misaligned the beam was. These actually looked pretty good; horizontal alignment through the irises was as before the swap, vertical alignment was slightly high. Peter was thinking that there could be something in the optical path from the FE to the WinCam down the DBB path that could be contributing to the beam profile issue (some back reflection causing interference maybe?). To check this, the polarizing beam splitter cube PBS01 was removed from the table and the WinCam was installed in its place (this is the pick-off right behind the turning mirror M02 that directs the FE beam into the HPO, see first attachment); in this way we eliminated the entirety of the DBB path. At this point in the optical path the beam looked much better, round and almost Gaussian. I tweaked the horizontal alignment into the MOPA to get the beam symmetric, the results are shown in the 2nd attachment (beam profile is rotated by +90°, i.e. UP is on the right side of the profile). At this point we called it a night and will continue mode matching and HPO recovery on Monday.
This morning at 16:09 UTC, IP14 on HAM6 turned off for some unknown reason. Turned back on this evening.
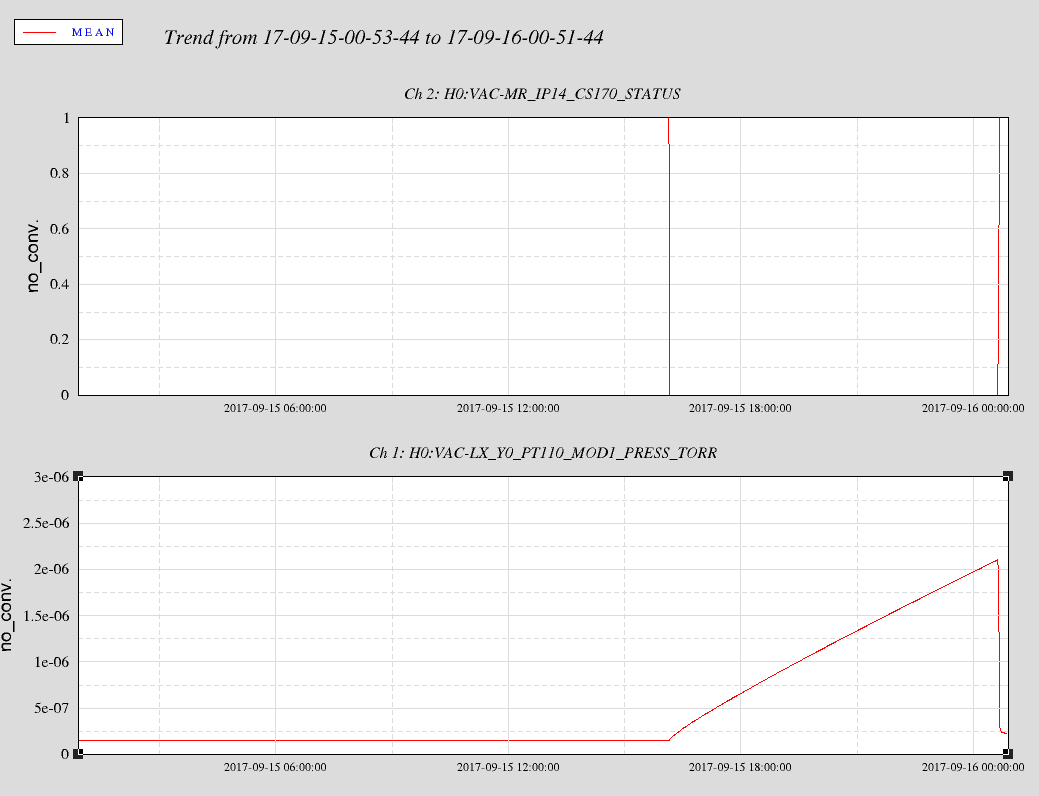
Diagonal vacuum volume now left unpumped until further notice. Also, the 10" turbo isolation valve closed and did not gall while partially open. However, it has to be replaced soon and can not be relied upon anymore. I'll de-energize the turbo levitation next week.
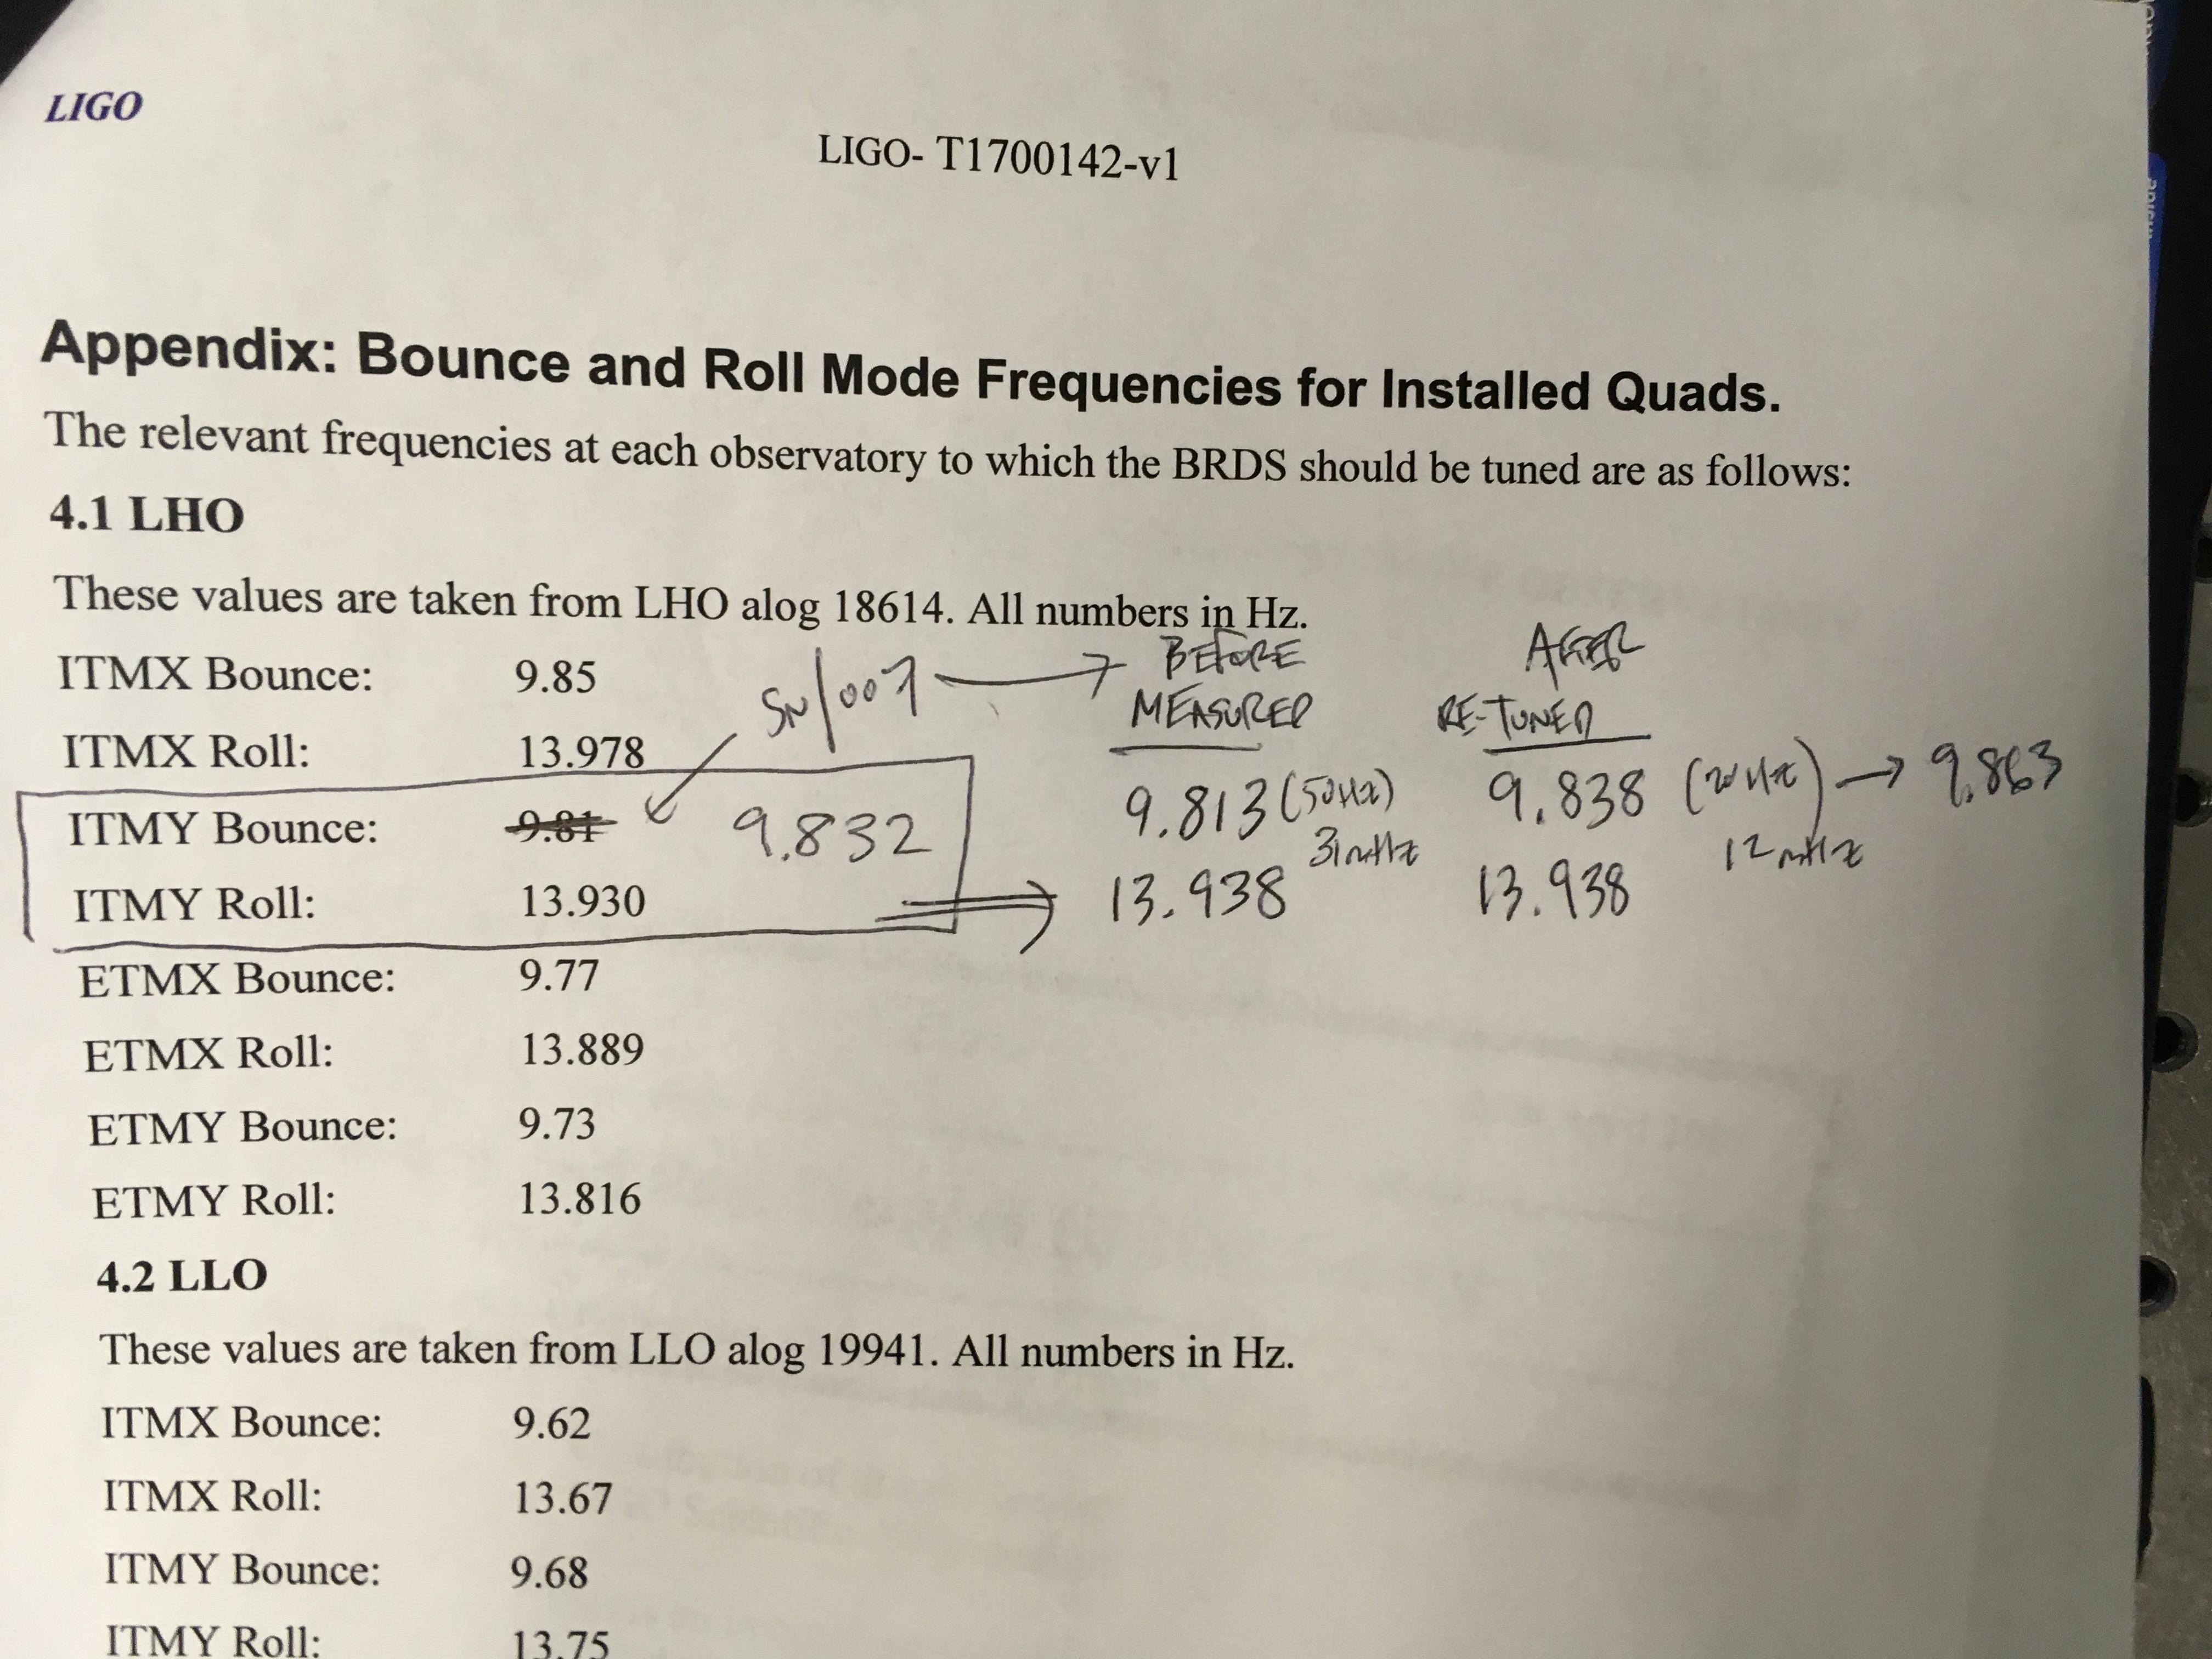
J. Kissel

I've tuned up the second QUAD Bounce/Roll Damper (BRD) for H1 ITMY. As suggested yesterday after tuning the first BRD (see LHO aLOG 38645), I used the more straight-forward measurement / readout setup of hooking the output of the laser vibrometer directly to an SR785 to gather an ASD of the signal to measure the tuned frequency (instead of interfacing through the B&K software).

Here're the results for both dampers destined for H1 ITMY:
BRD S/N  007
  Blade                     Bounce (Hz)      Roll (Hz)   Freq Resolution (mHz)
  ITMY Target                9.831            13.93          10 mHz
  As Received                9.813            13.938         50 mHz
  After Tuning               9.863            13.938         20 mHz
(Target - After) / Target     0.3%             0.05%

BRD S/N  017
  Blade                     Bounce (Hz)      Roll (Hz)   Freq Resolution (mHz)
  ITMY Target                9.831            13.93          10 mHz
  As Received                10.31            14.1           31 mHz
  After Tuning               9.906            13.875         31 mHz
(Target - After) / Target     0.7%             0.4%

These have been kitted together in one bag for install on ITMY in the next two weeks.

I have left the setup as is in the back-room of the optics lab, because I'll also use this setup for measuring / tuning the HAM-ISI blade-spring Tuned Mass Dampers (TMDs). There should be enough room for any OFI characterization to work in parallel on the same optics table.
TITLE: 09/15 Day Shift: 15:00-23:00 UTC (08:00-16:00 PST), all times posted in UTC
STATE of H1: Commissioning
INCOMING OPERATOR: None
SHIFT SUMMARY: PSL work and other vent prep work going on.
LOG:
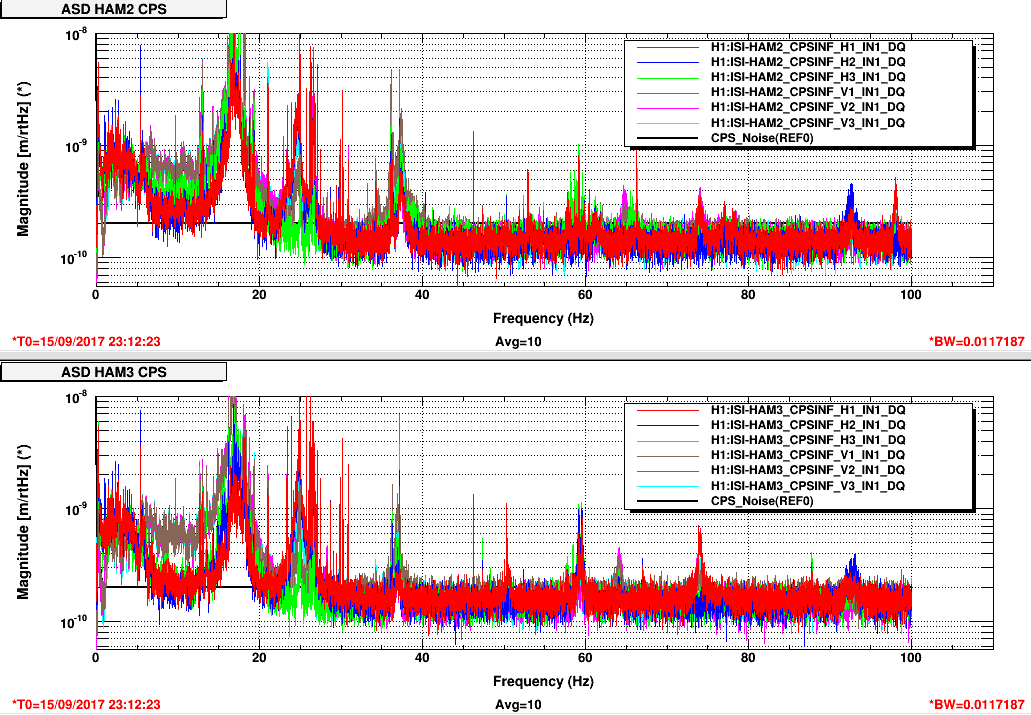
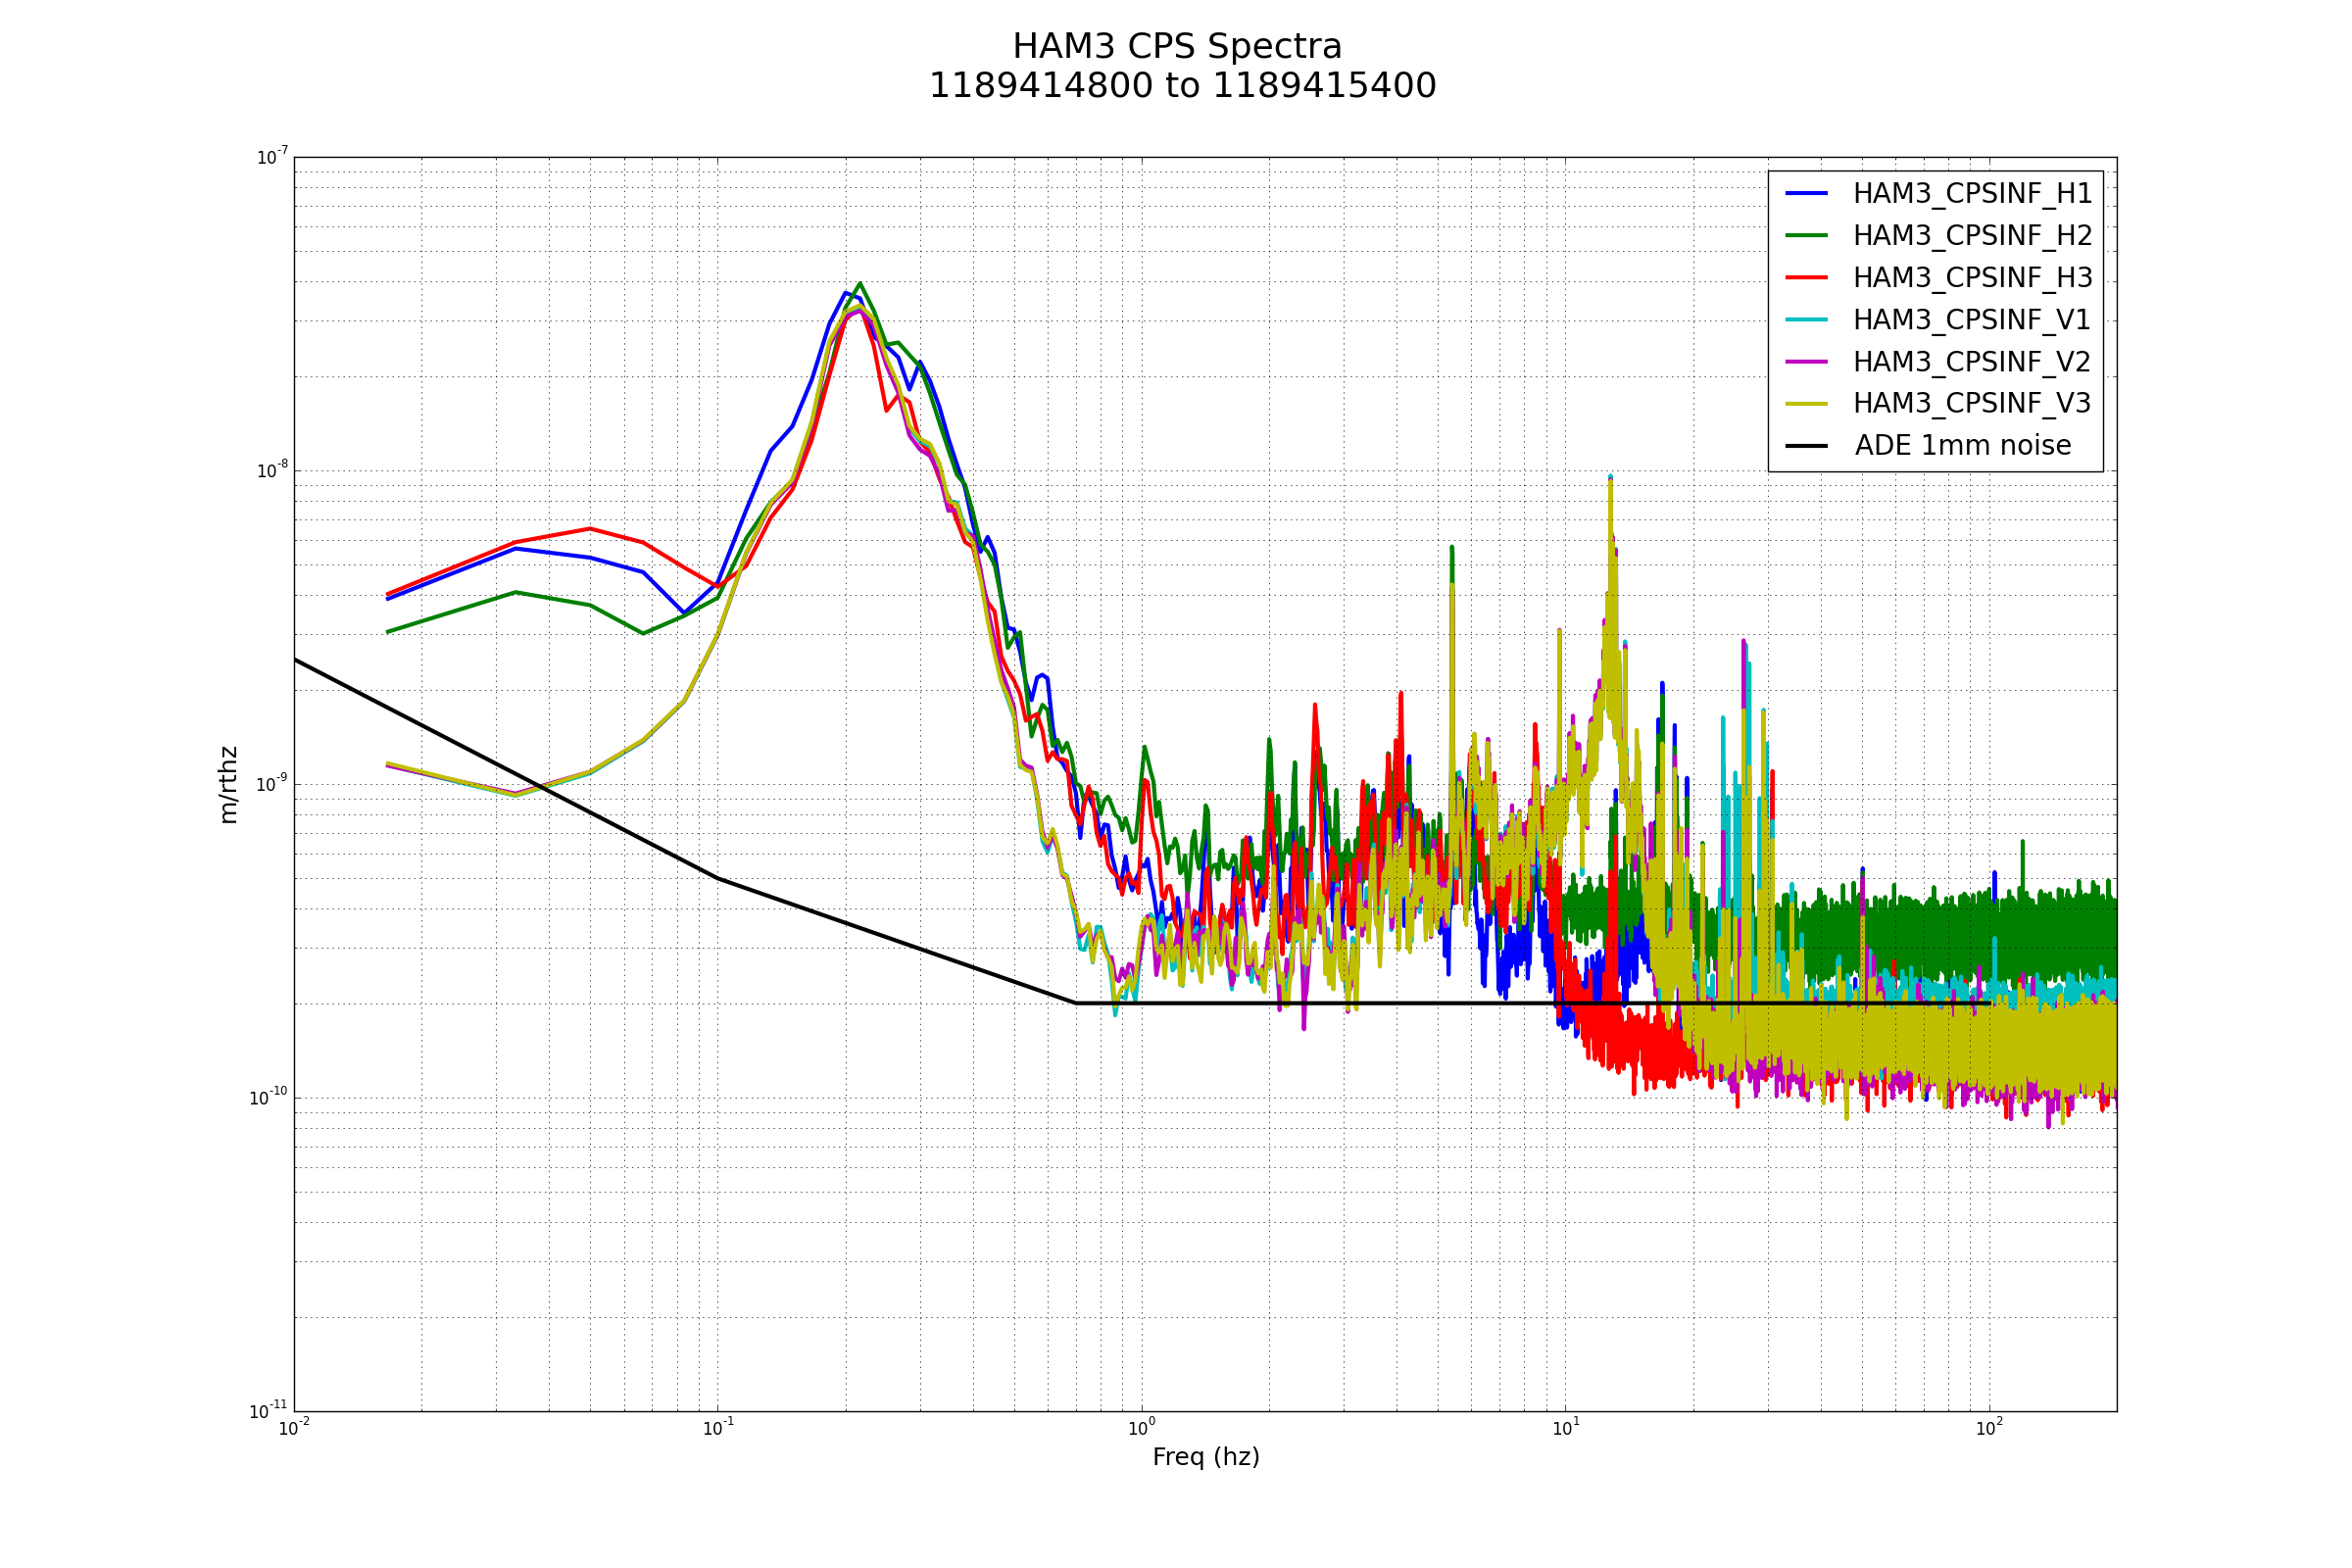
FRS 9012--Yesterday tried un & re seating the satellite card a few times and it did reduce the noise (see aLOG 38634) but only for a short time. This morning, the Corner2 CPS only section of the interface chassis was power cycled. So far this has reduced the noise again; we'll see for how long.
Several hours later, the noise level on the CPS HAM3 H2 is still low, like the others. So, so far, this chassis power cycle has fixed the noise issue. See attached compared to the 9th image attached to Ed's log, this.
All the HEPIs in the LVEA are now locked as close as possible to Target Location.
| Cham | DOF | X | Y | Z | RX | RY | RZ |
| HAM1 | -0.4 | -2.1 | 0.5 | 0.5 | -1.6 | -2.2 | |
| HAM2 | 2.6 | 2.1 | 0.5 | 0.5 | -1.3 | -1.3 | |
| HAM3 | -0.1 | -12.5 | 0.4 | -0.2 | 0.4 | -0.5 | |
| HAM4 | -6.1 | 0.9 | -0.4 | 2.3 | -0.04 | -0.6 | |
| HAM5 | 0.9 | -1.0 | -0.5 | 0.6 | 0.06 | 0.7 | |
| HAM6 | -6.8 | 0.7 | 3.5 | 1.1 | 1.5 | -0.2 | |
| ITMY | -0.2 | 15.4 | 10.3 | -6.8 | -6.6 | -0.5 | |
| BS | 4.0 | 1.4 | 9.6 | 1.5 | -3.4 | 1.3 | |
| ITMX | -2.8 | 1.4 | 19.6 | -10.9 | 8.0 | -1.9 | |
These values are available on the DC BIAS medm from each HEPI chamber overview.
TITLE: 09/15 Day Shift: 15:00-23:00 UTC (08:00-16:00 PST), all times posted in UTC
STATE of H1: Commissioning
OUTGOING OPERATOR: None
CURRENT ENVIRONMENT:
Wind: 7mph Gusts, 6mph 5min avg
Primary useism: 0.02 μm/s
Secondary useism: 0.14 μm/s
QUICK SUMMARY:
Jeff B is in PSL mitigating some more small leaks in the new water manifold.
15:27 Ken down to MX (outside)
15:34 Cheryl into optics lab
15:41 Fil out to MY
I'm going to go work in PSL. TJ and Cheryl will be covering ops.
Soft closed GV6 this morning and opened back up at 5:15 pm local. Burst of gas at PT-124 from gate annulus accumulation.
Opened valve back up to allow AIP to pump on gate annulus volume on GV5.
J. Kissel, T. Sadecki, S. Appert

The Bounce/Roll Mode Dampers (BRDs, D1500228) are to be pre-tuned to the measured highest vertical (a.k.a. "bounce") and roll resonances of the QUADs. CIT has graciously pre-tuned them for us following the procedure, T1700142, but unfortunately tuning is a graceful art of wiggling the masses around within the slop of the screws and it's *very* sensitive, and vulnerable to change with shipping.

As such, we wanted to
    - get some practice tuning them ourselves, because we'll have to do so for the three new test masses we're getting,
    - check that the resonance frequencies survived shipping to us, and
    - adjust the bounce frequency for ITMY, because they were tuned to a typo frequency.

After some fumbling for about an hour with the B&K pulse software, Stephen helped us just create a new template in the PULSE B&K system that did what we wanted.
However, since we only need to measure the frequency, and our method of storage of the answer is just writing it down, I'm going to switch to using an SR785 tomorrow. The B&K software is overly complex with far too many distracting / confusing bells and whistles to just take a spectrum. Further, we're going to need the B&K laptop for measuring HAM-ISI blade, new baffle, suspension cages resonances chamber side with the hammer and accelerometer configuration, and I don't want to lose that much time again to dragging around the system and reconfiguring it. I can tune both the BRDs and the ISI TMDs with the SR785 + Laser Vibrometer setup quietly in the optics lab, and leave the B&K + Accelerometer + Hammer set up out on the floor.

The tuning process itself took us about 3-4 hours for one. We half to tune 2 per test mass.
Thankfully the tuning is spaced out by quite a bit, and we can knock out ITMY's now.

Eventually our results will end up in E1700285, but for now,
BRD S/N  007
  Blade                     Bounce (Hz)      Roll (Hz)   Freq Resolution (mHz)
  ITMY Target                9.831            13.93          10 mHz
  As Received                9.813            13.938         50 mHz
  After Tuning               9.863            13.938         20 mHz
(Target - After) / Target     0.3%             0.05%

We acknowledge that the bounce frequency is not great, but we had already spent 2 hours on tuning it, then switched to the roll side, tuned that for an hour, and just *measured* the bounce again, and found it had changed. Likely from the many iterations of on-vs-off of the measurement stand and the adjustment jig while tuning the roll side was enough to disturb the bounce side.
Since the target matching is to 1% the bounce frequency looks fine.
Good work.
h1tw1 is reporting a failed power supply on its RAID, presumably the one connected to facility power. I can confirm the RAID is operational and raw minute trend files are being written, so the second PS is OK.
cell phone texter is waiting for FMCS channels to restart. This is imminent, so I'll keep it running for now.
FMCS access still not working for me. Not urgent.