Sheila, Daniel, TVo
Executive Summary
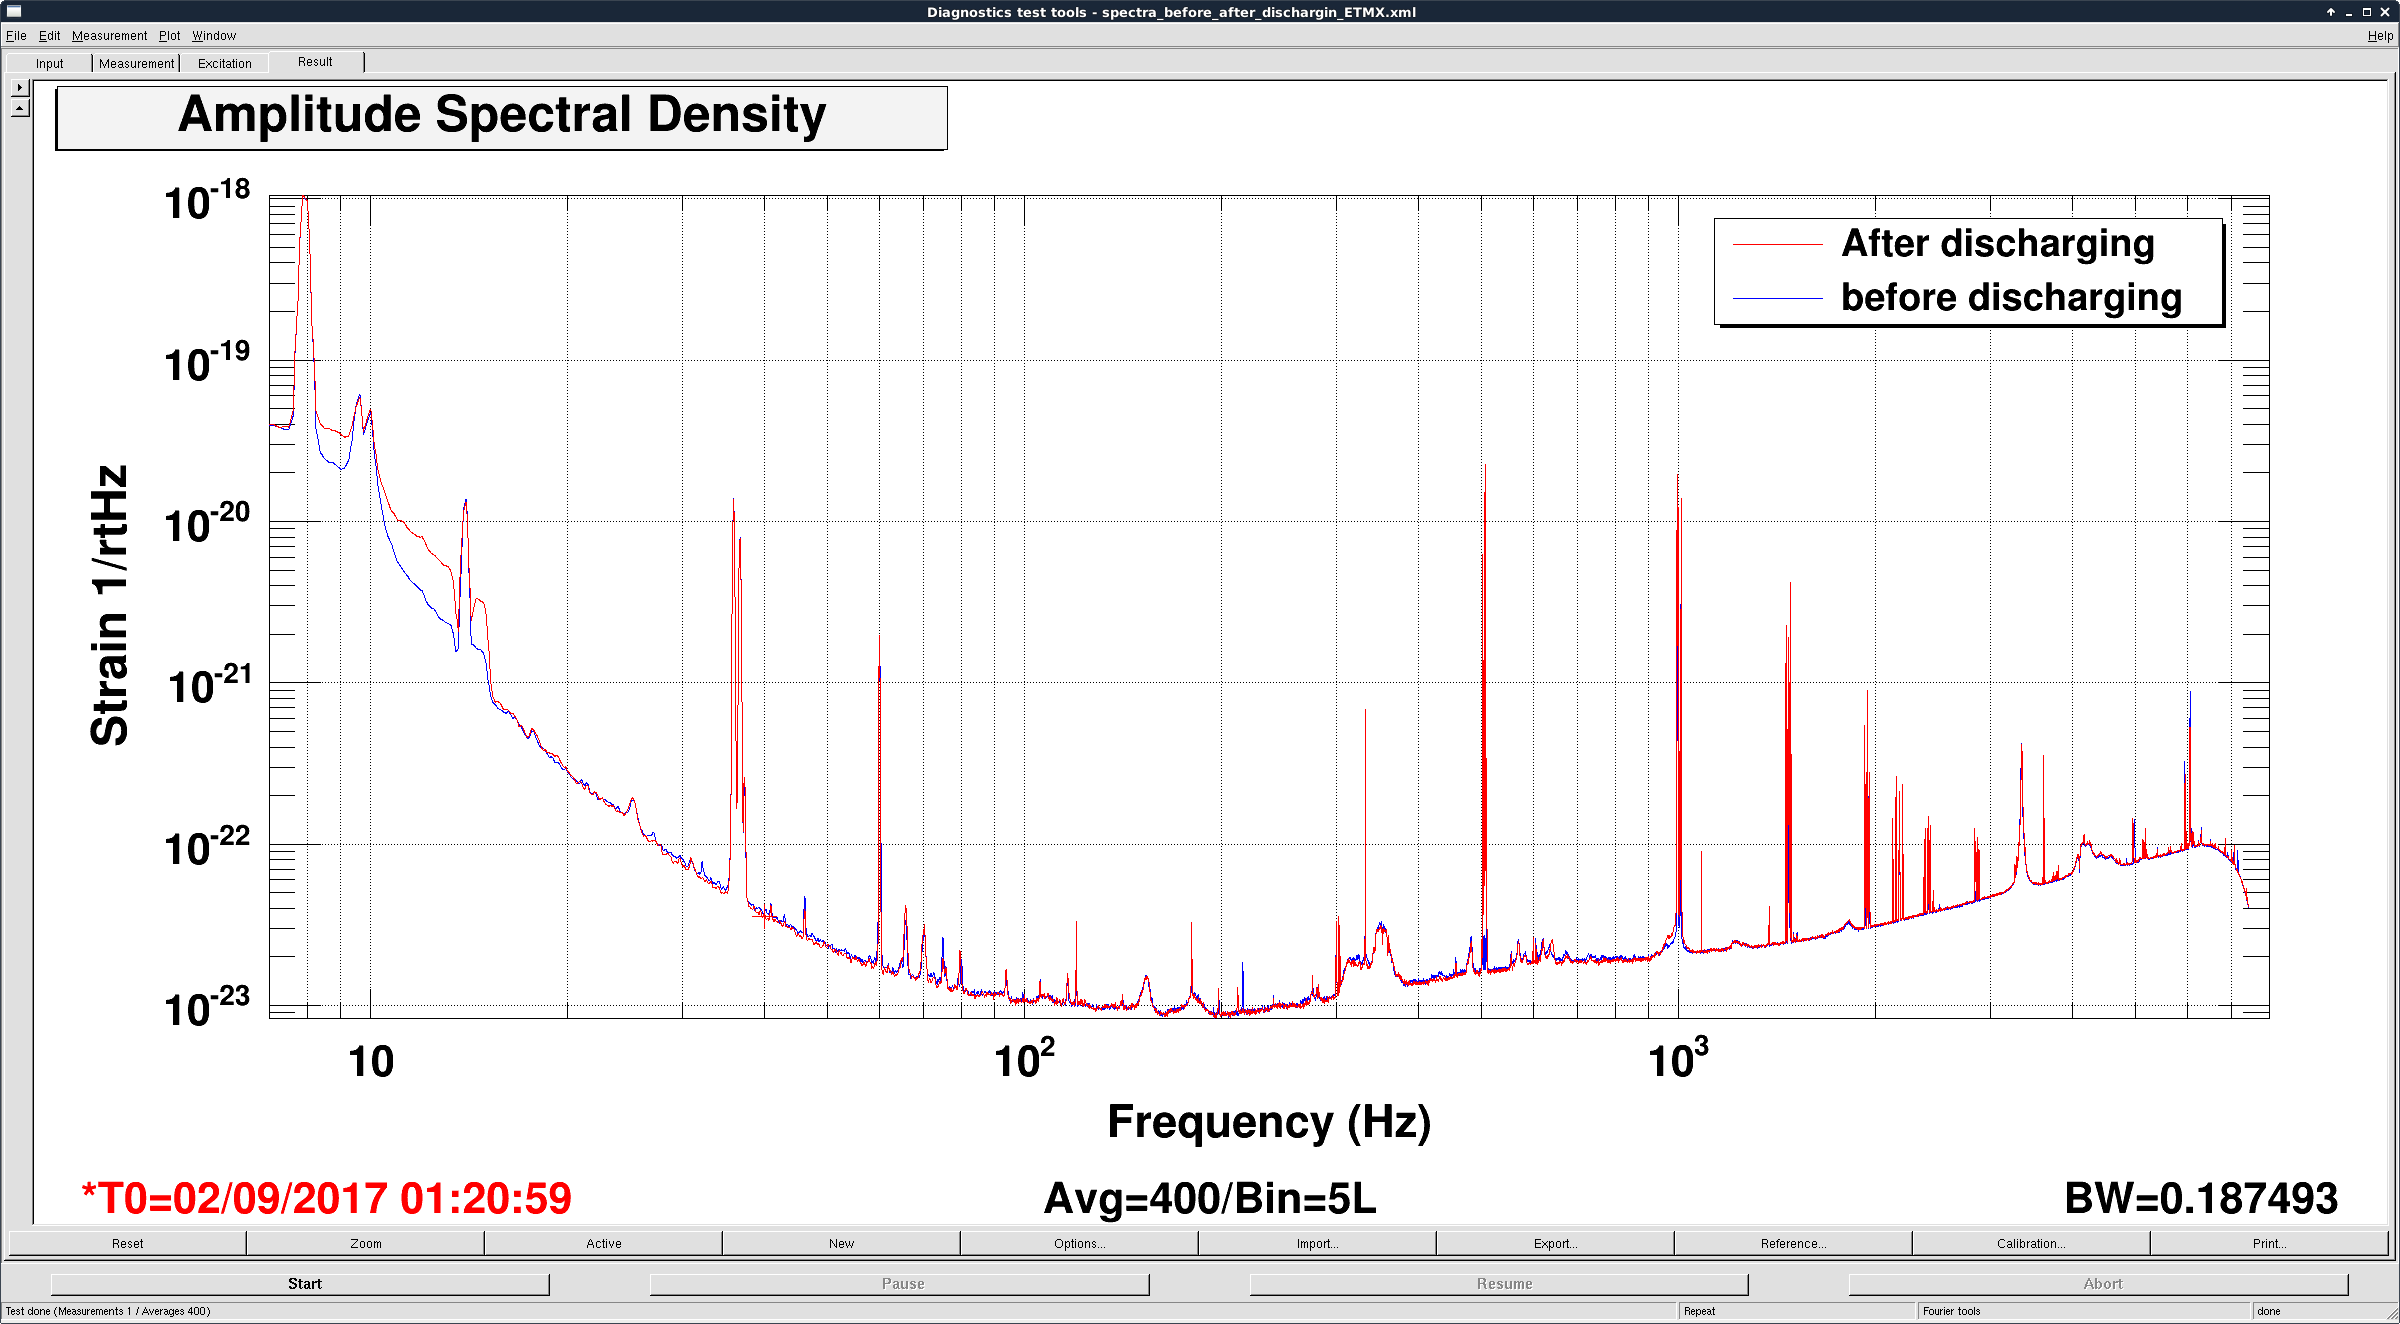
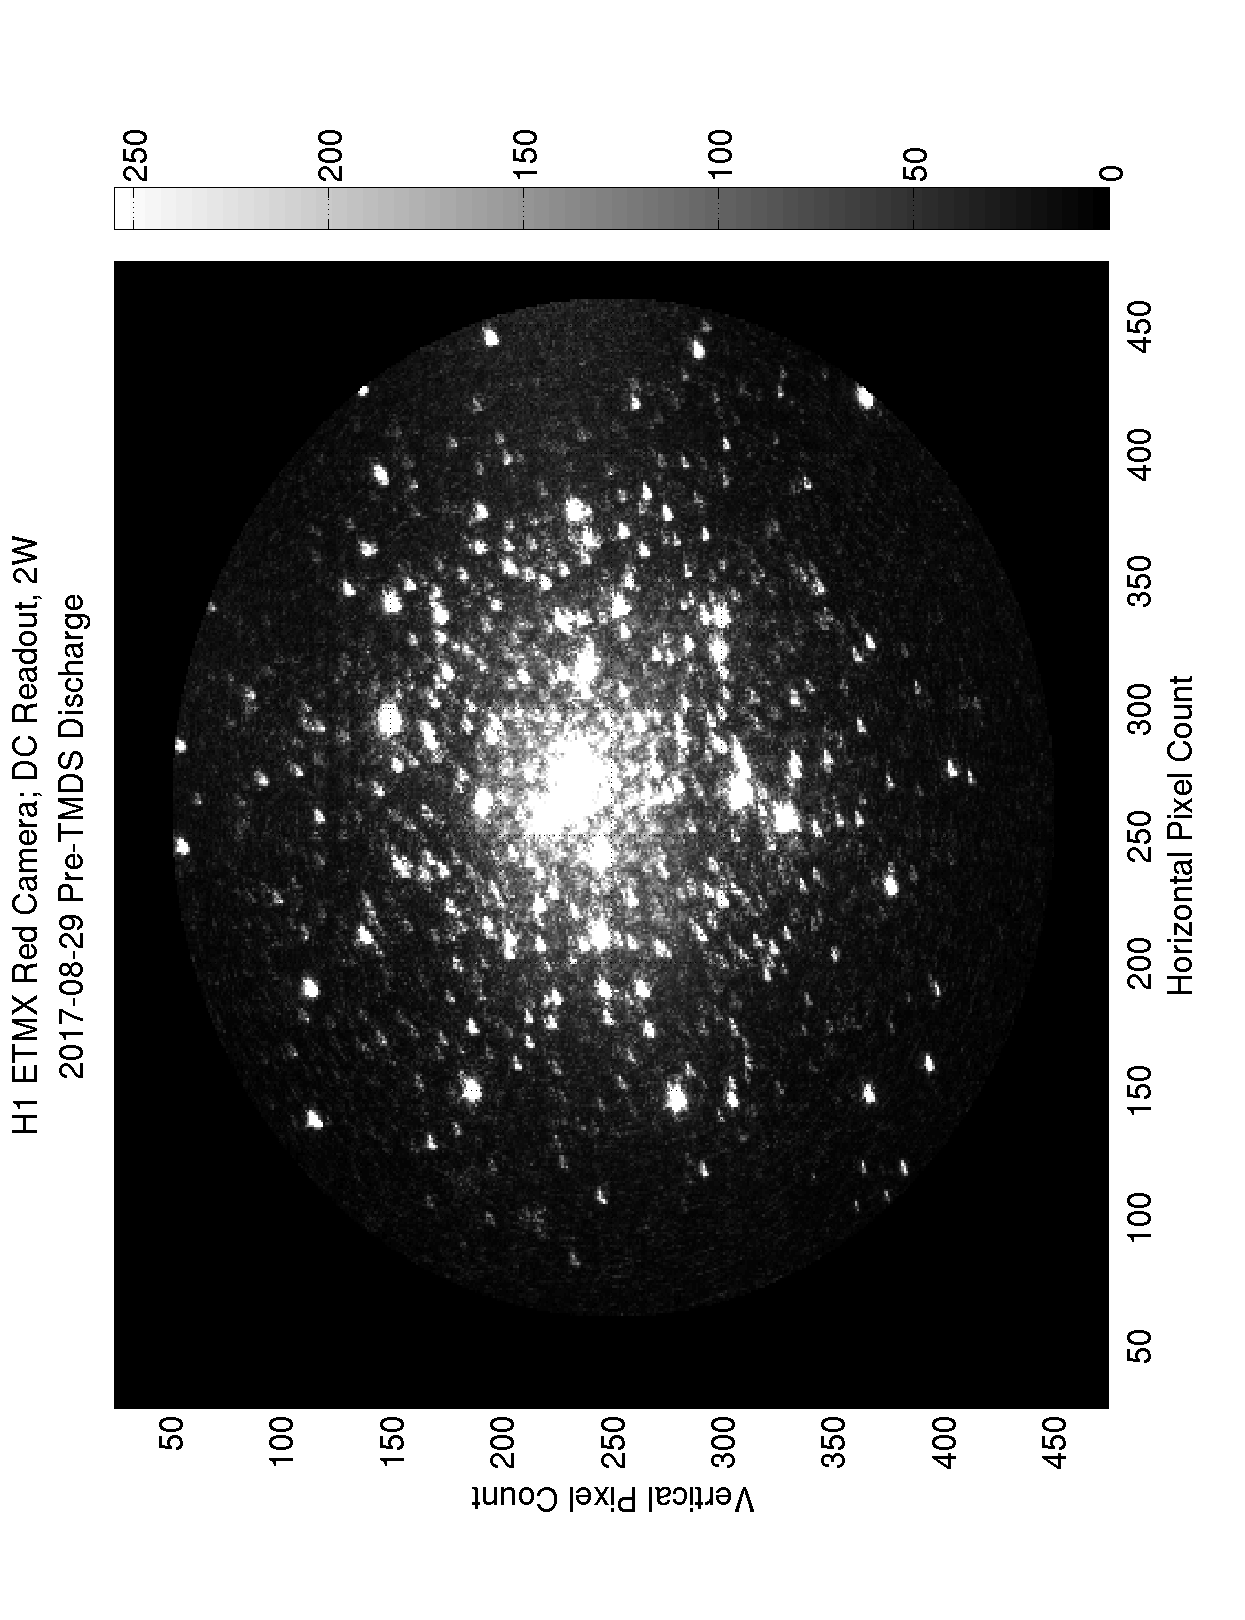
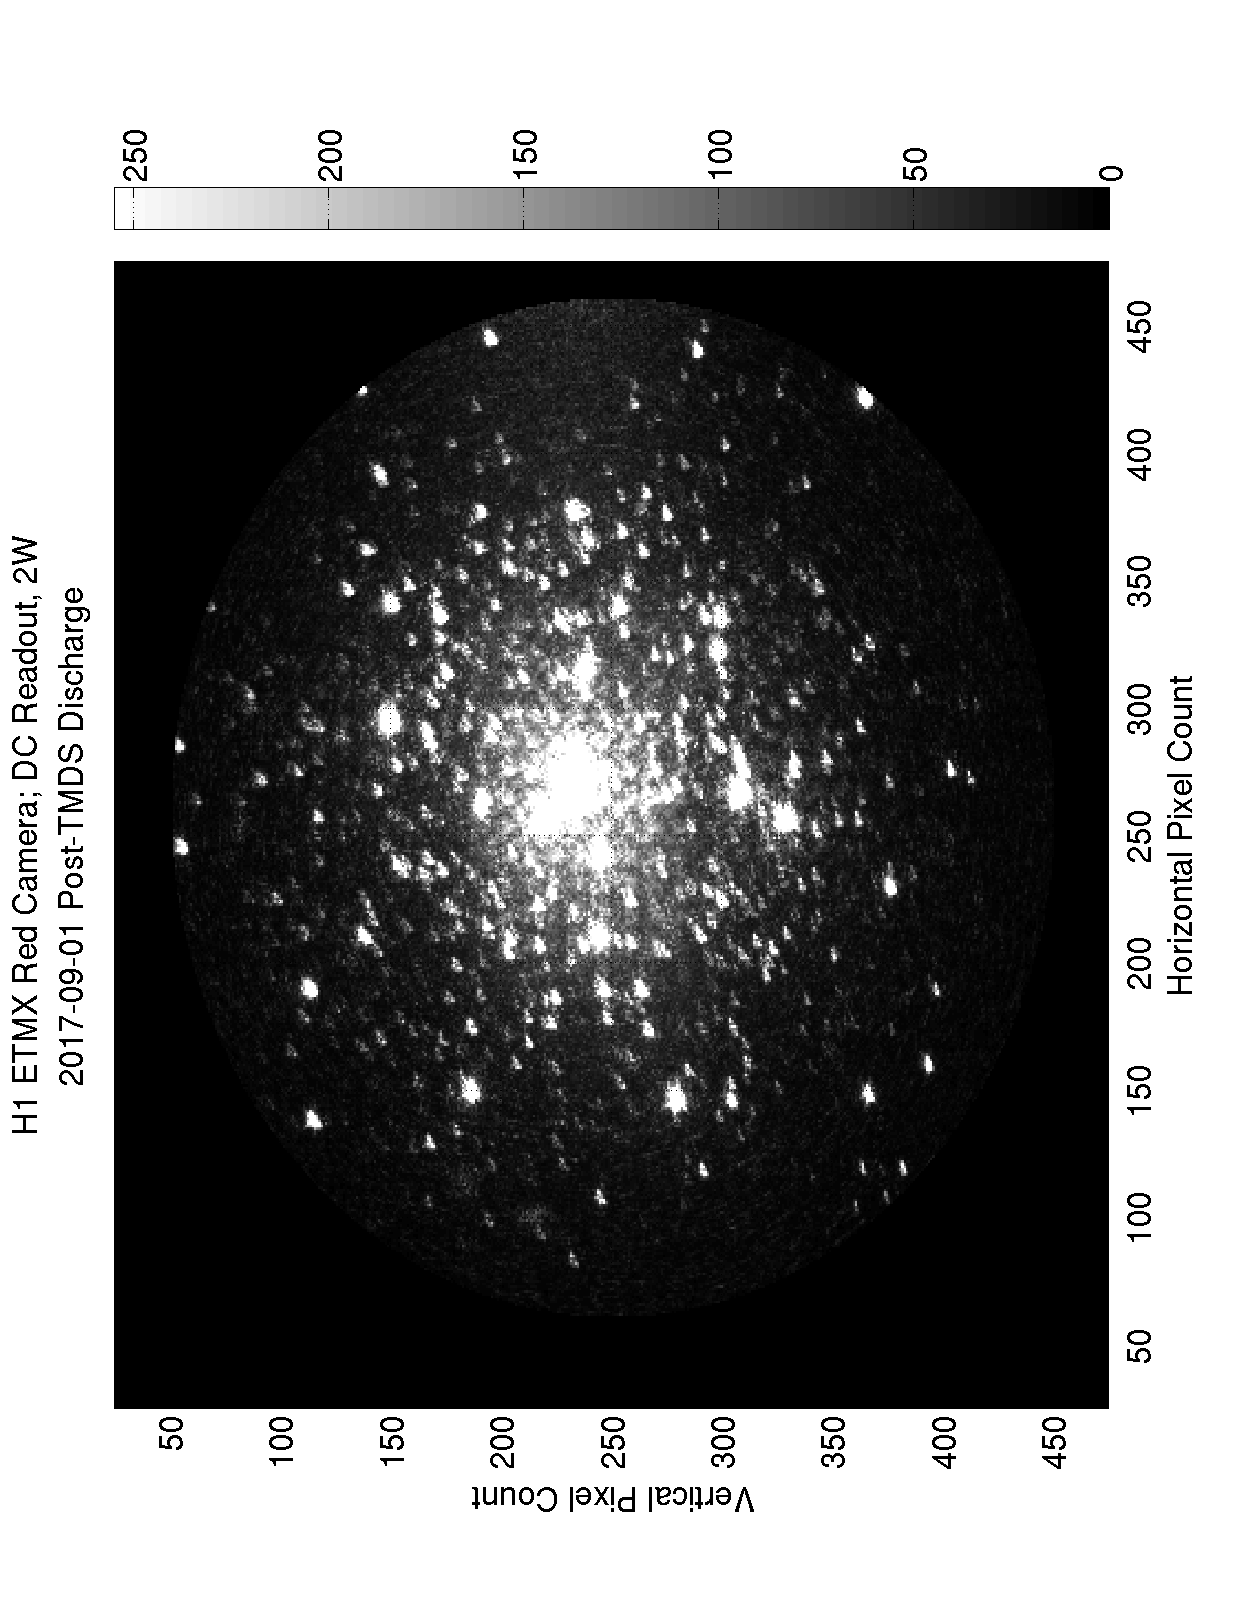
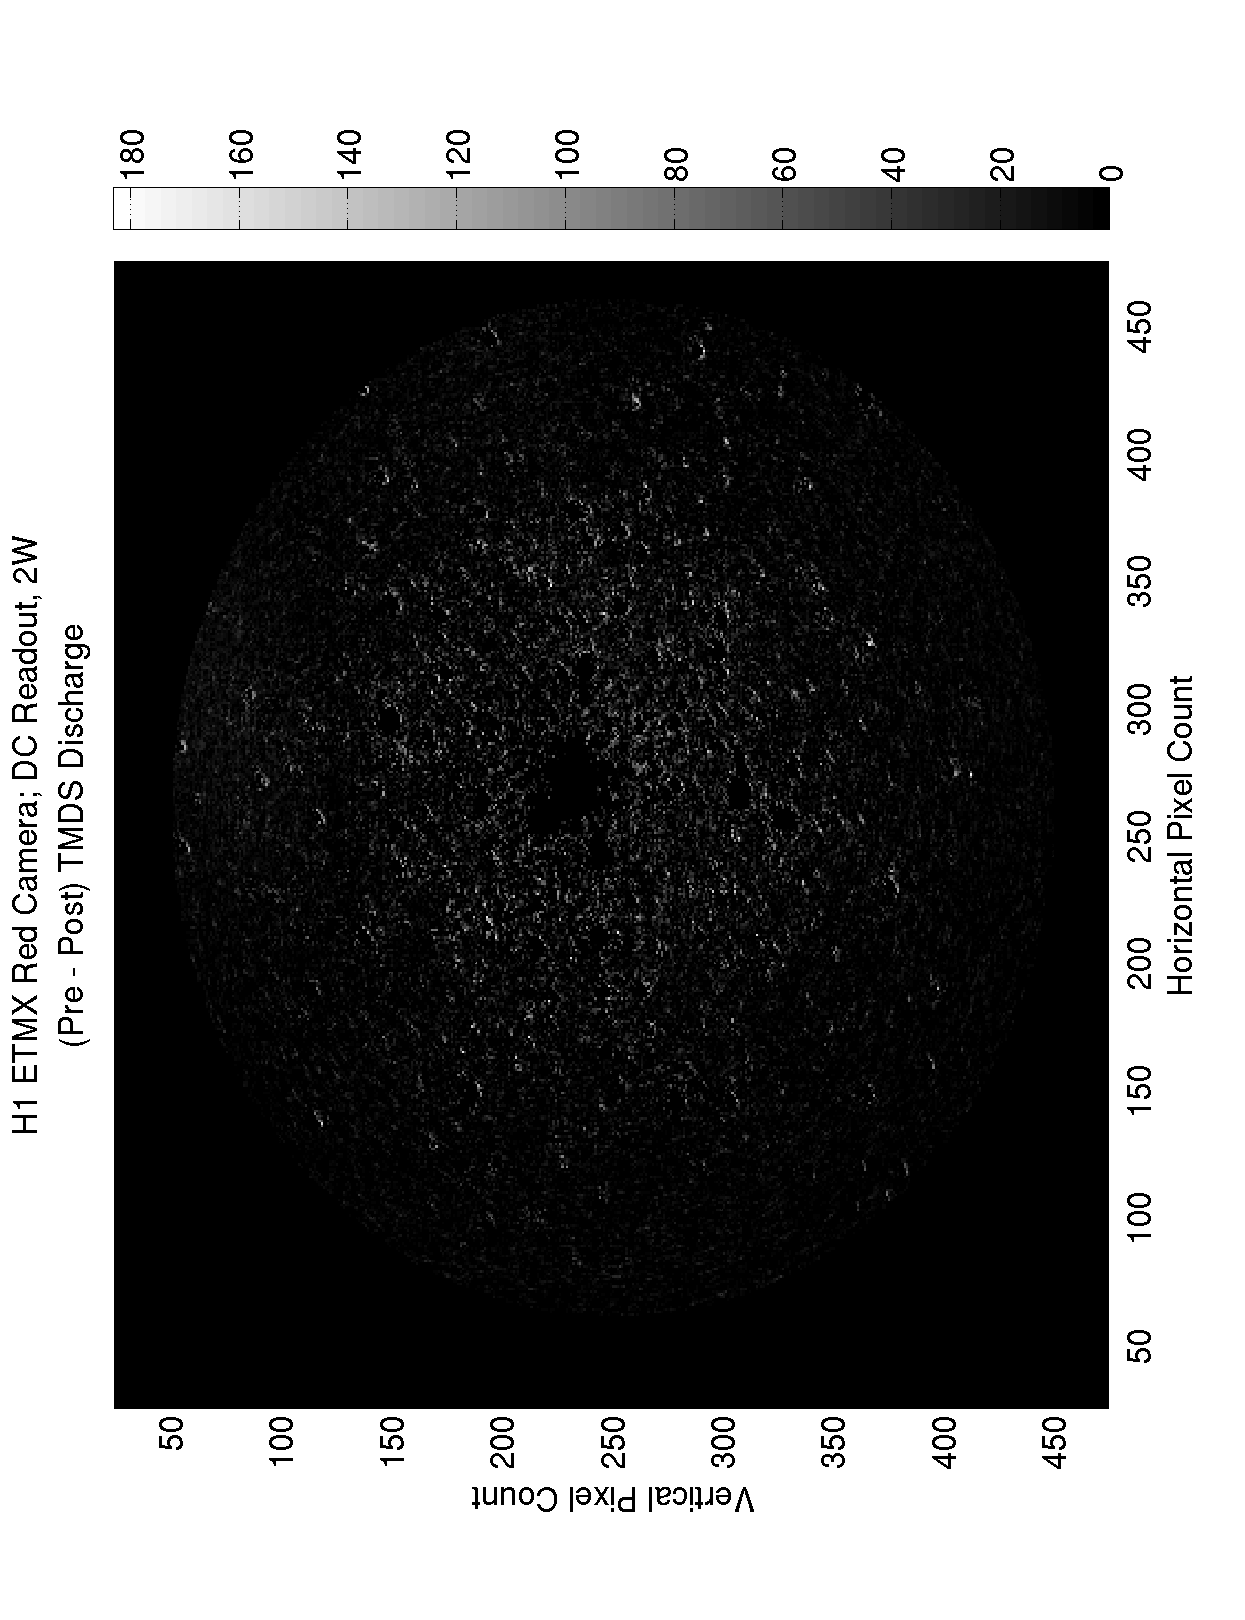
It doesn't look like the TMDS caused any extra absorption on ETMX.
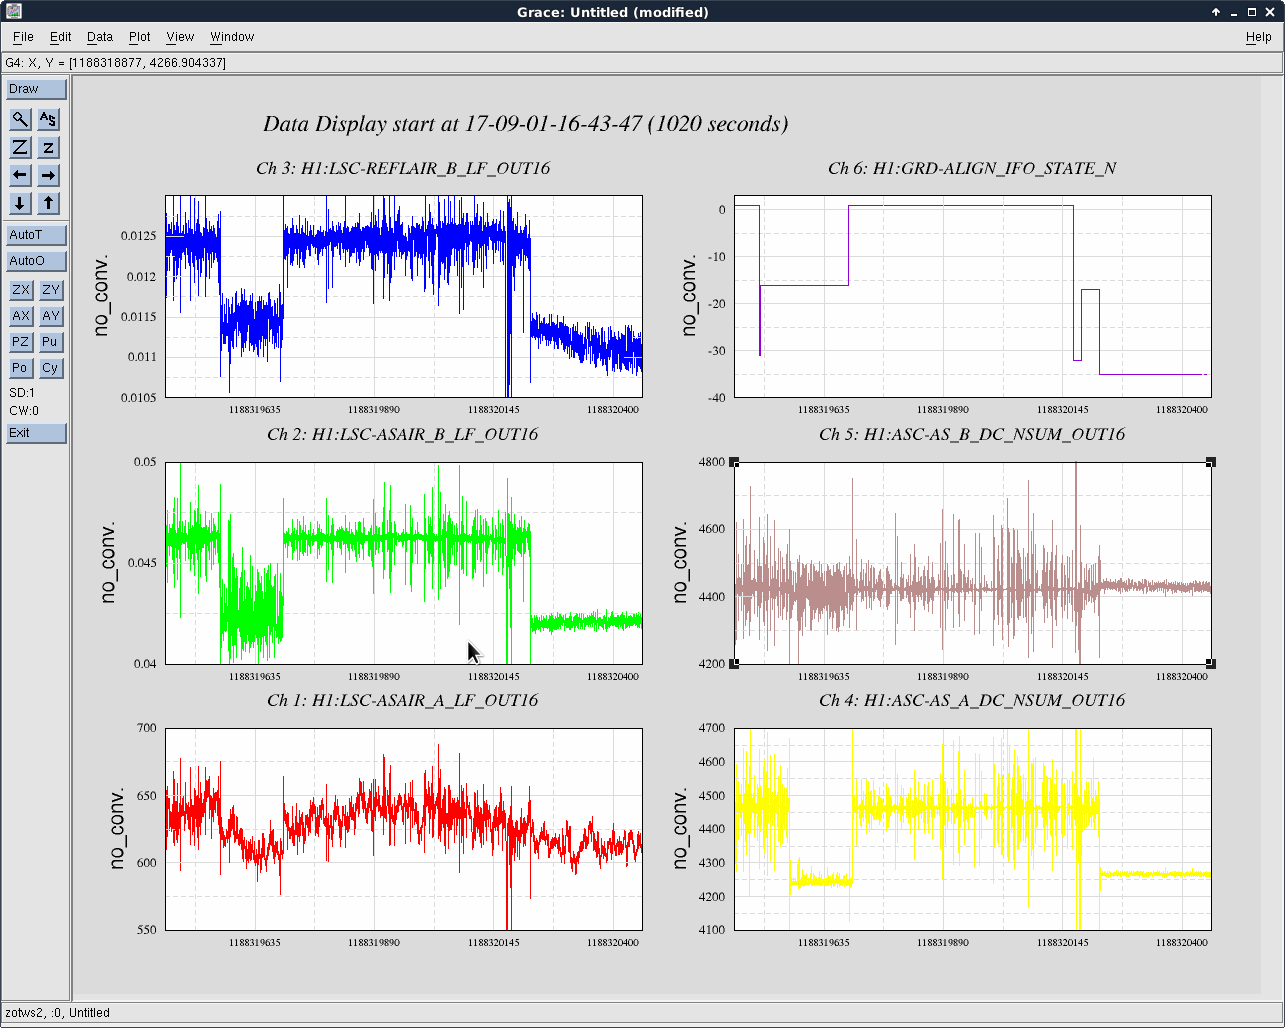
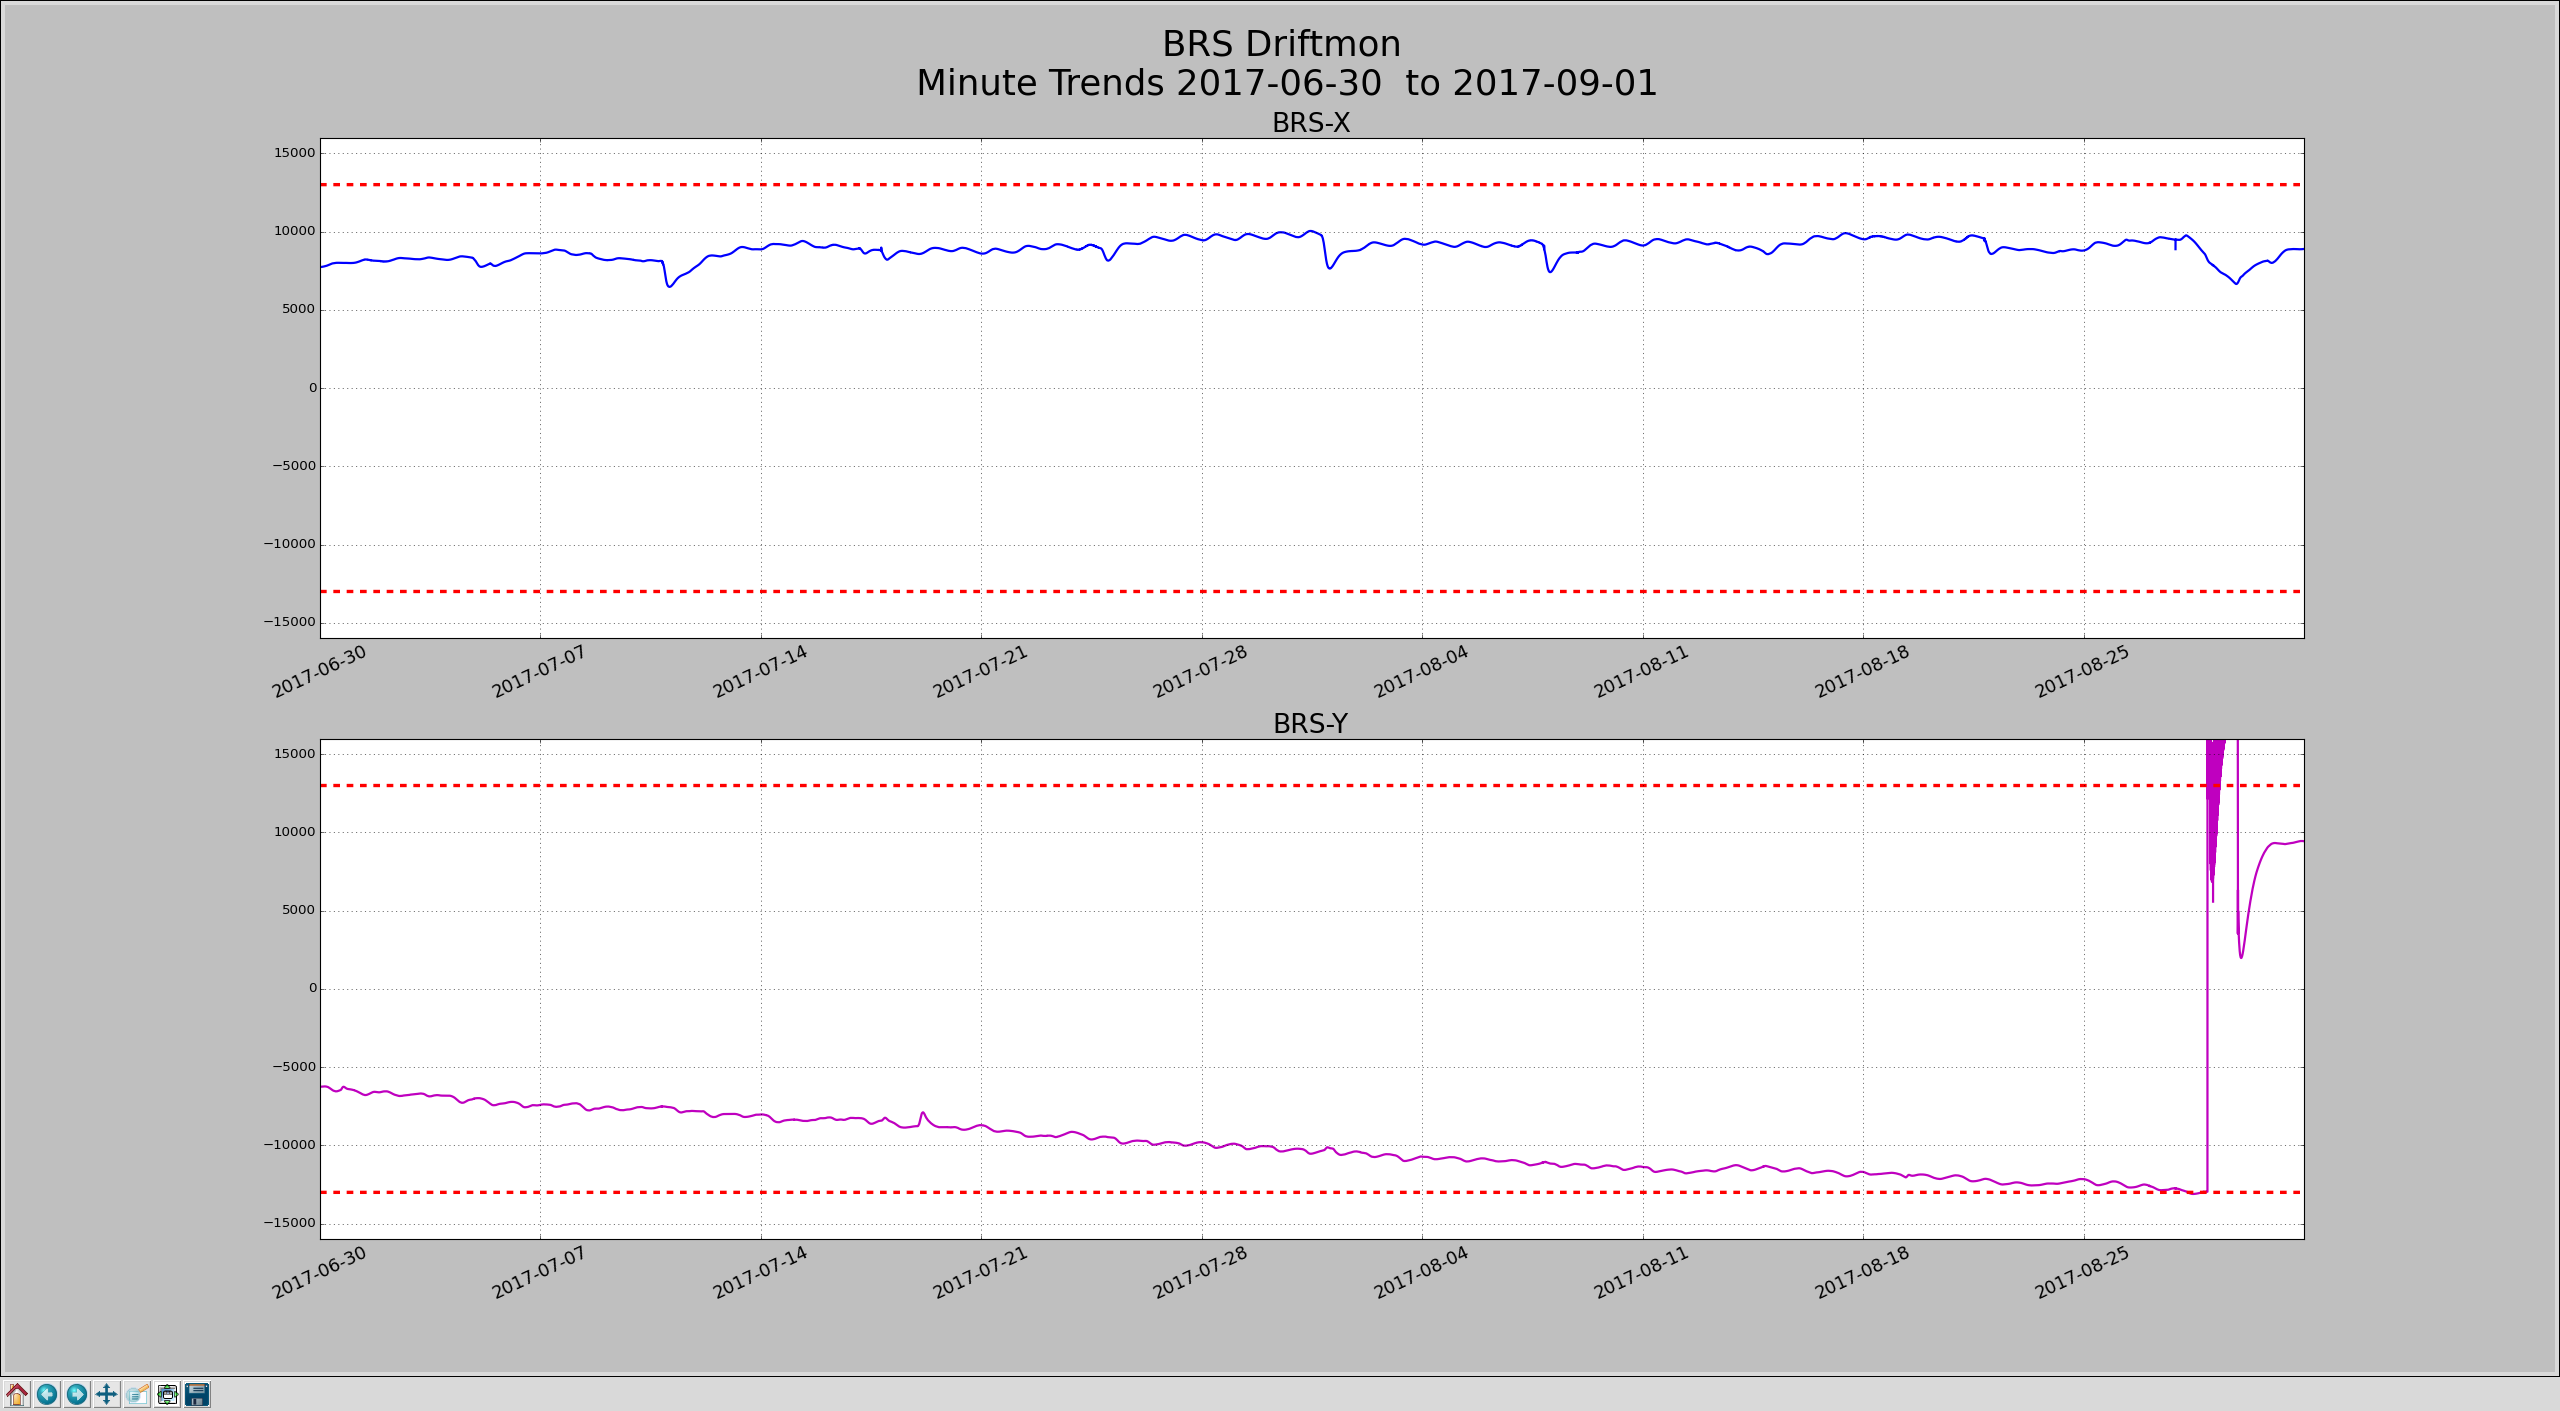
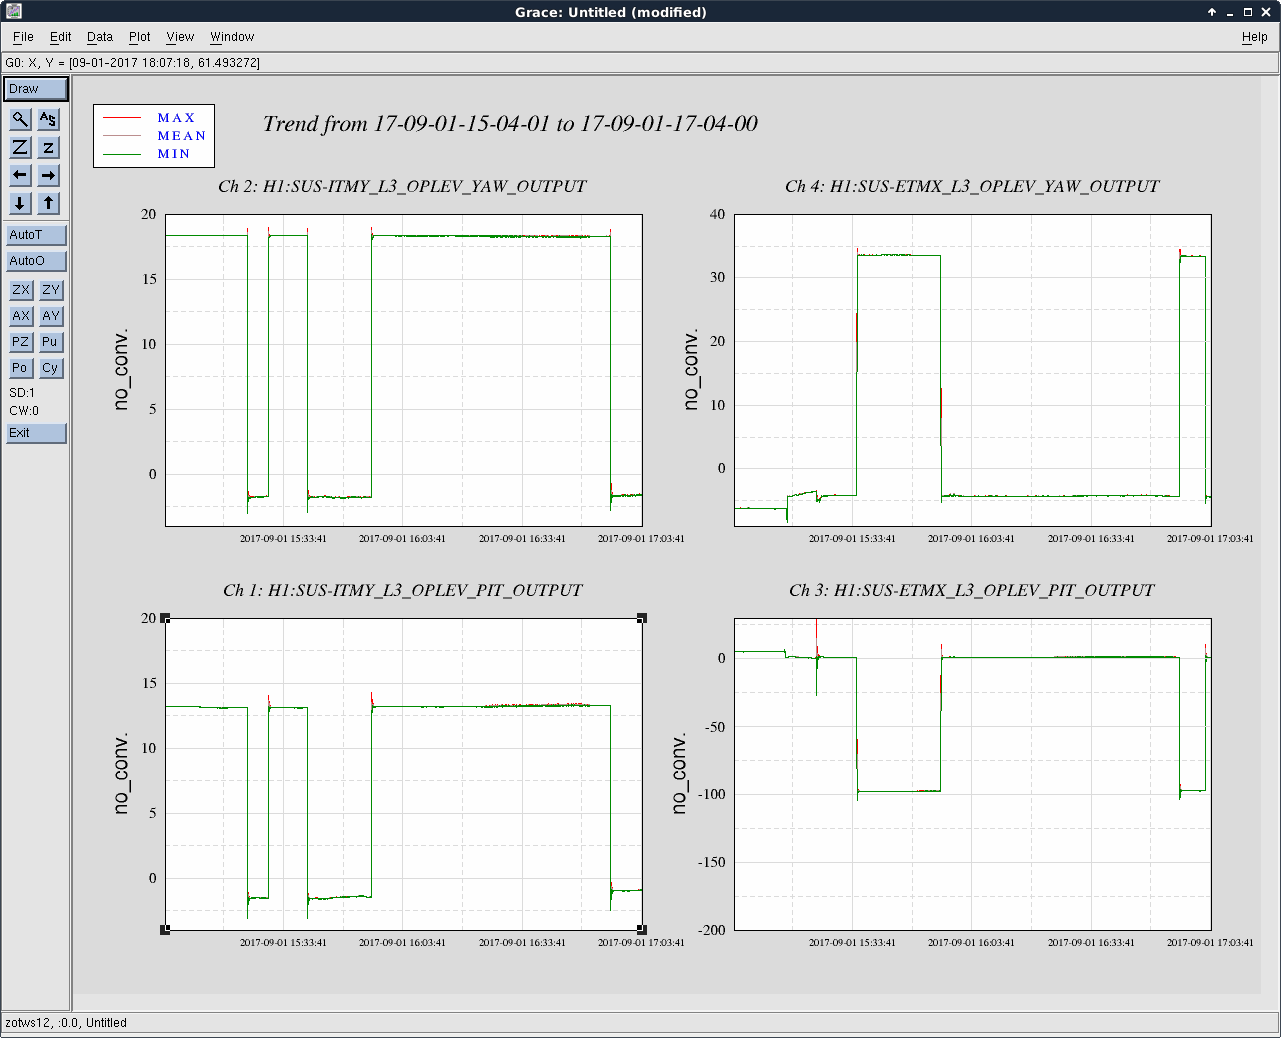
Following my aLOG-38476, where I alluded to the possibility of increased loss due to absorption as a reason we had trouble locking last night, we wanted to try to measure a loss in each arm and compare them to each other. This is done by looking at the reflected power and seeing the difference between locked and unlocked. In the attached time series, the first drop is the X-ARM locking, the second drop is the Y-ARM locking.
For this measurement, we configured the IFO as such:
- The arm cavity of interest was first locked on ALS to get aligned well (it would be mis-aligned during the actual measurement)
- The other arm cavity was misaligned
- Then we locked a single arm with Guardian (ALIGN_IFO)-
- We also turned on the DC Centering on the AS WFS in order to maximize their power.
- Then to get a decent dip in the reflected power off the arm cavity, we increased the input power from the PSL from 2 Watts to 25 Watts.
Below is the summary of results:
XARM
| Channel |
Locked Power(Cts) |
Unlocked Power(Cts) |
Visbility |
Abs PPM (Calc'd) |
| LSC-REFLAIR_B_LF |
0.0114 |
0.0124 |
92% |
343 |
| LSC-ASCAIR_B_LF |
0.0423 |
0.0462 |
91% |
357 |
| ASC-AS_A_DC_NSUM |
4241 |
4454 |
95% |
220 |
YARM
| Channel |
Locked Power(Cts) |
Unlocked Power(Cts) |
Visbility |
Abs PPM (Calc'd) |
| LSC-REFLAIR_B_LF |
0.0114 |
0.0124 |
92% |
479 |
| LSC-ASCAIR_B_LF |
0.0417 |
0.0461 |
91% |
409 |
| ASC-AS_A_DC_NSUM |
4265 |
4458 |
95% |
209 |
Some of the sensors in the AS port didn't give us good results when we locked and unlocked but it's not fully understood why. The total loss is a combination of mode-matching, alignment etc and these were not taken into account.


h1boot locked up around 04:40 PDT. Sheila is rebooting it.
h1boot is back, front ends look good. Sheila will try some testpoints and excitations.
here are h1boot's system messages for early this morning, last message before freeze up was an ntpd status change at approximately the time of the freeze. The next message is the reboot at 09:39:08
Sep 3 01:19:48 h1boot -- MARK --
Sep 3 01:39:48 h1boot -- MARK --
Sep 3 01:59:48 h1boot -- MARK --
Sep 3 02:19:48 h1boot -- MARK --
Sep 3 02:39:48 h1boot -- MARK --
Sep 3 02:59:48 h1boot -- MARK --
Sep 3 03:19:48 h1boot -- MARK --
Sep 3 03:39:48 h1boot -- MARK --
Sep 3 03:59:49 h1boot -- MARK --
Sep 3 04:19:49 h1boot -- MARK --
Sep 3 04:39:49 h1boot -- MARK --
Sep 3 04:41:40 h1boot ntpd[4865]: kernel time sync status change 6001
Sep 3 09:39:08 h1boot syslog-ng[4227]: Syslog connection established; fd='7', server='AF_INET(10.99.0.99:514)', local='AF_INET(0.0.0.0:0)'
Impact of h1boot freeze up:
The front end real-time processes were not affected by the freeze, neither was their data transfer to the DAQ. All EPICS IOCs on the front ends froze up, which mainly impacted the Guardian nodes which received stuck data. MEDMs were also frozen at their 04:41 PDT values, and conlog also did not receive any updates. I suspect testpoint and excitation operations would have been unavailable during the freeze.