patrick.thomas@LIGO.ORG - posted 23:49, Monday 10 July 2017 - last comment - 23:51, Monday 10 July 2017(37436)
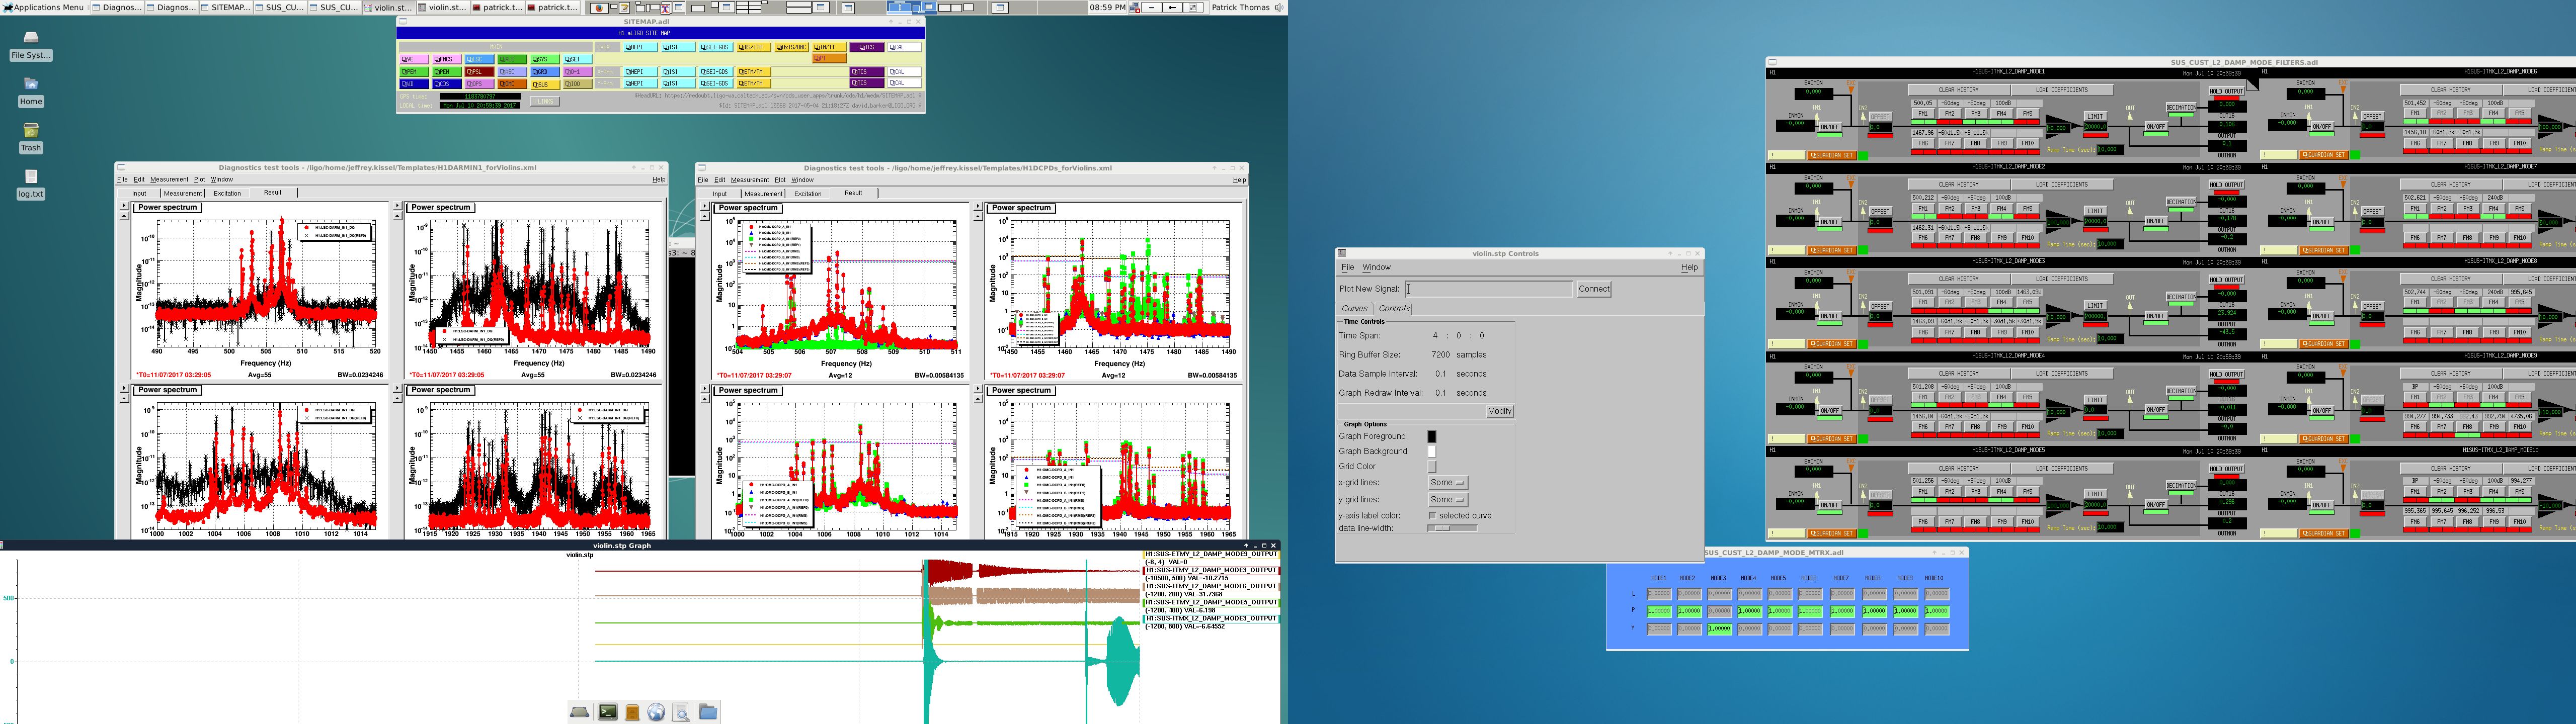
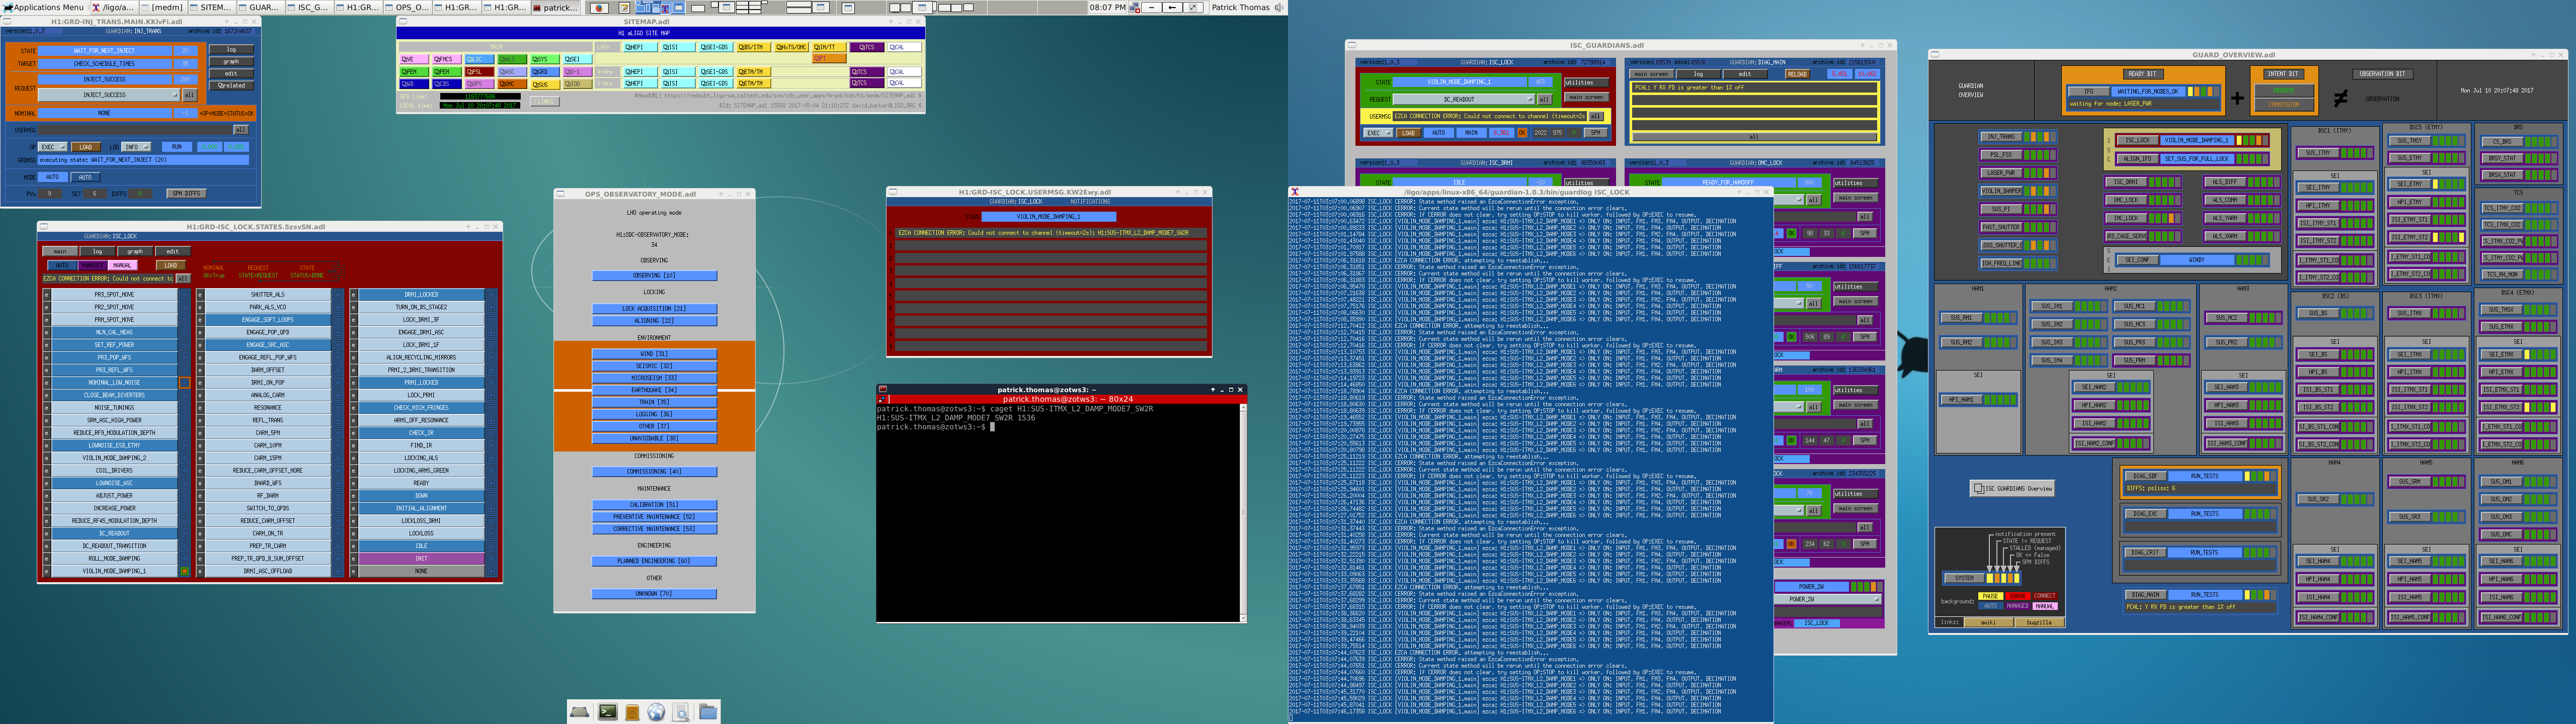
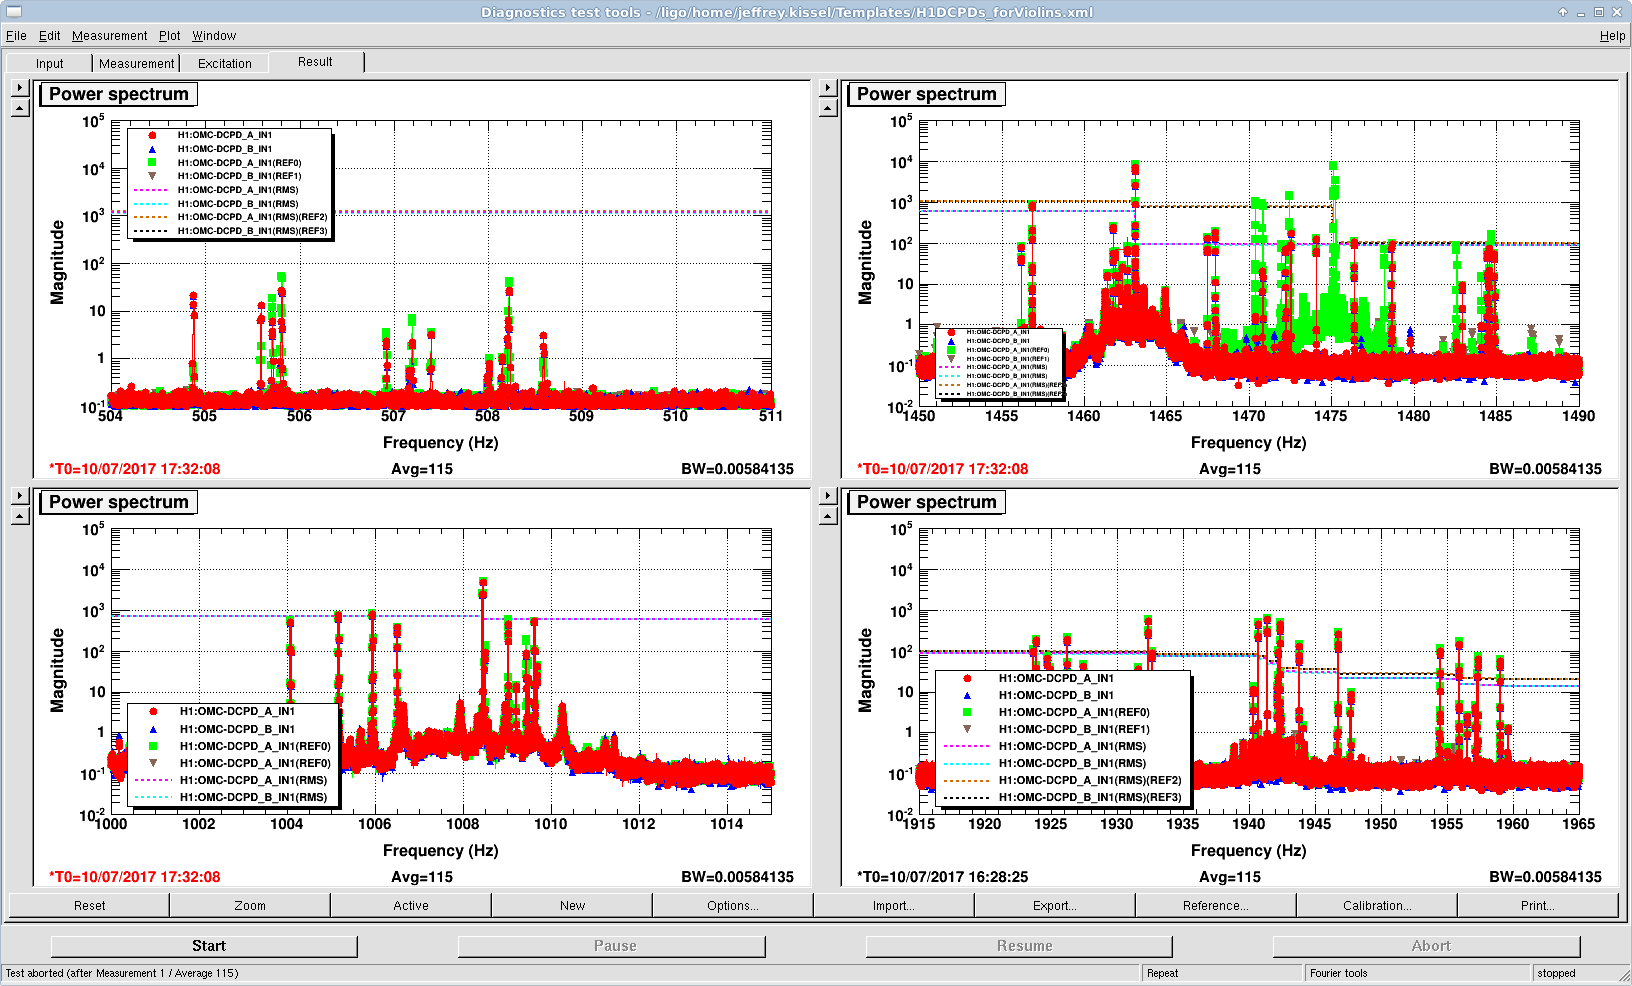
OMC DCPD saturation, OMC DCPD saturation, ...
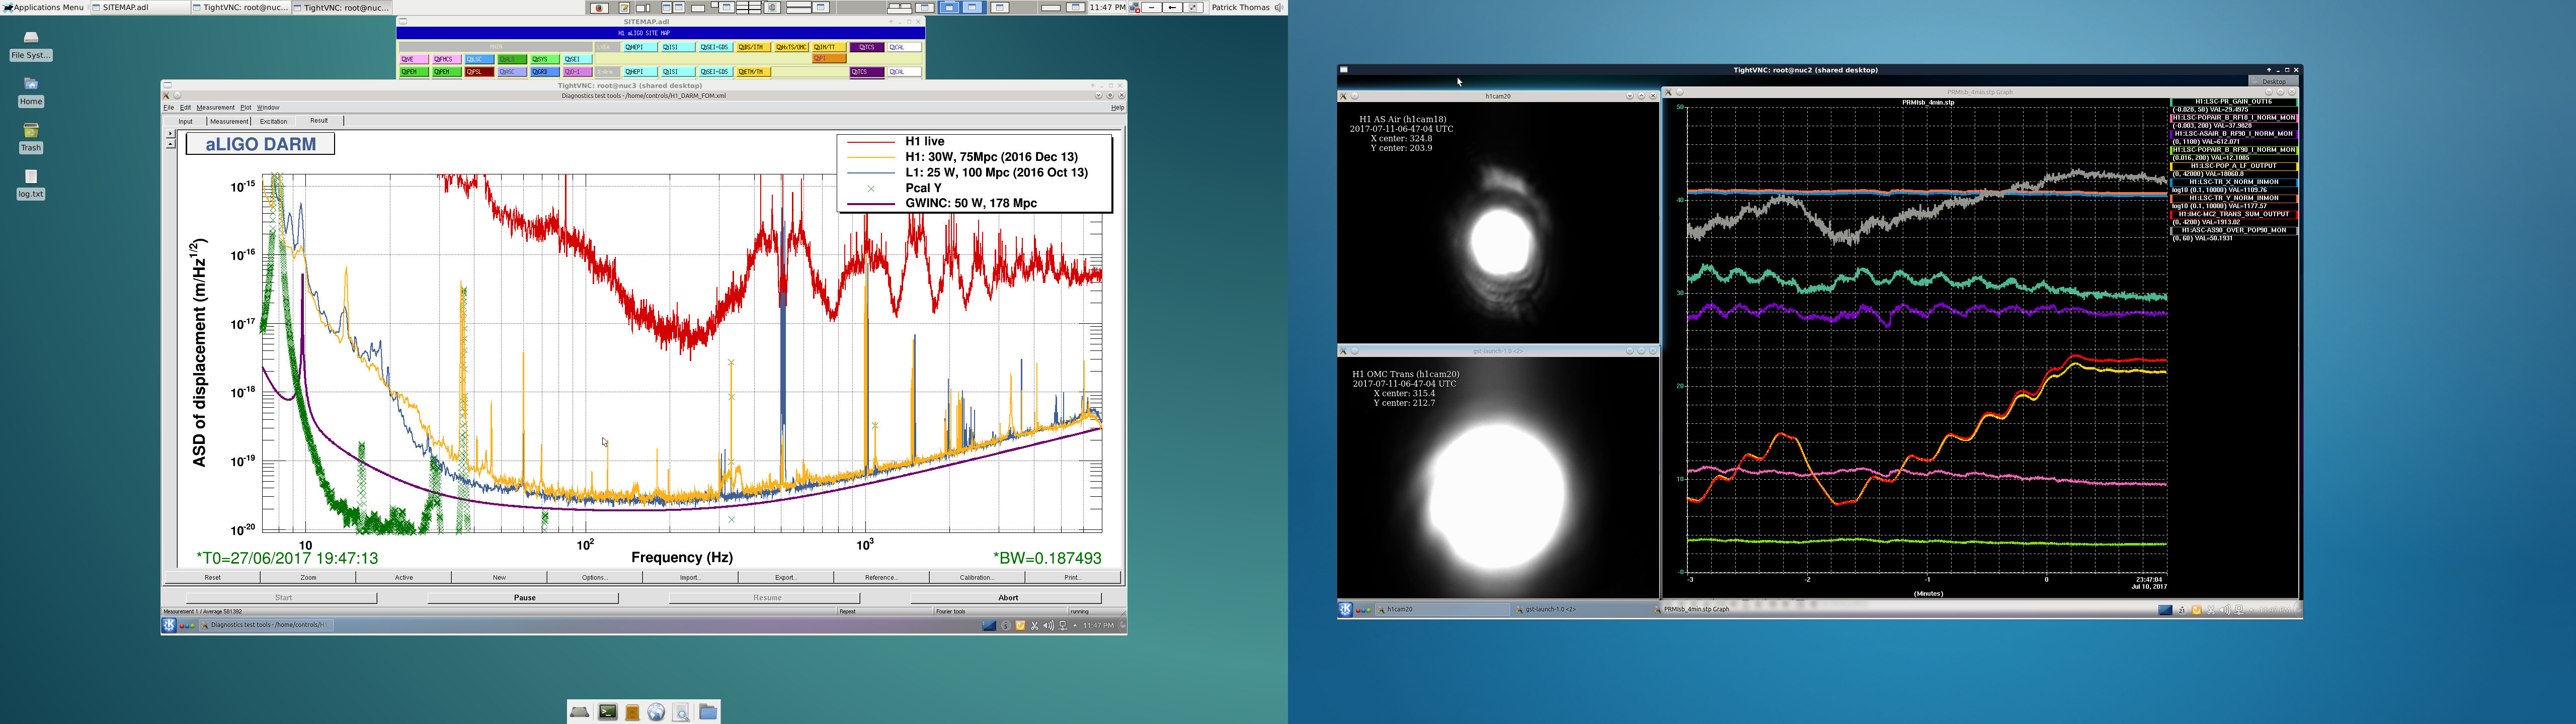
Finished and sitting at INCREASE_POWER. Second time in a row this happened. First time lost lock trying to go further.
Images attached to this report
Comments related to this report
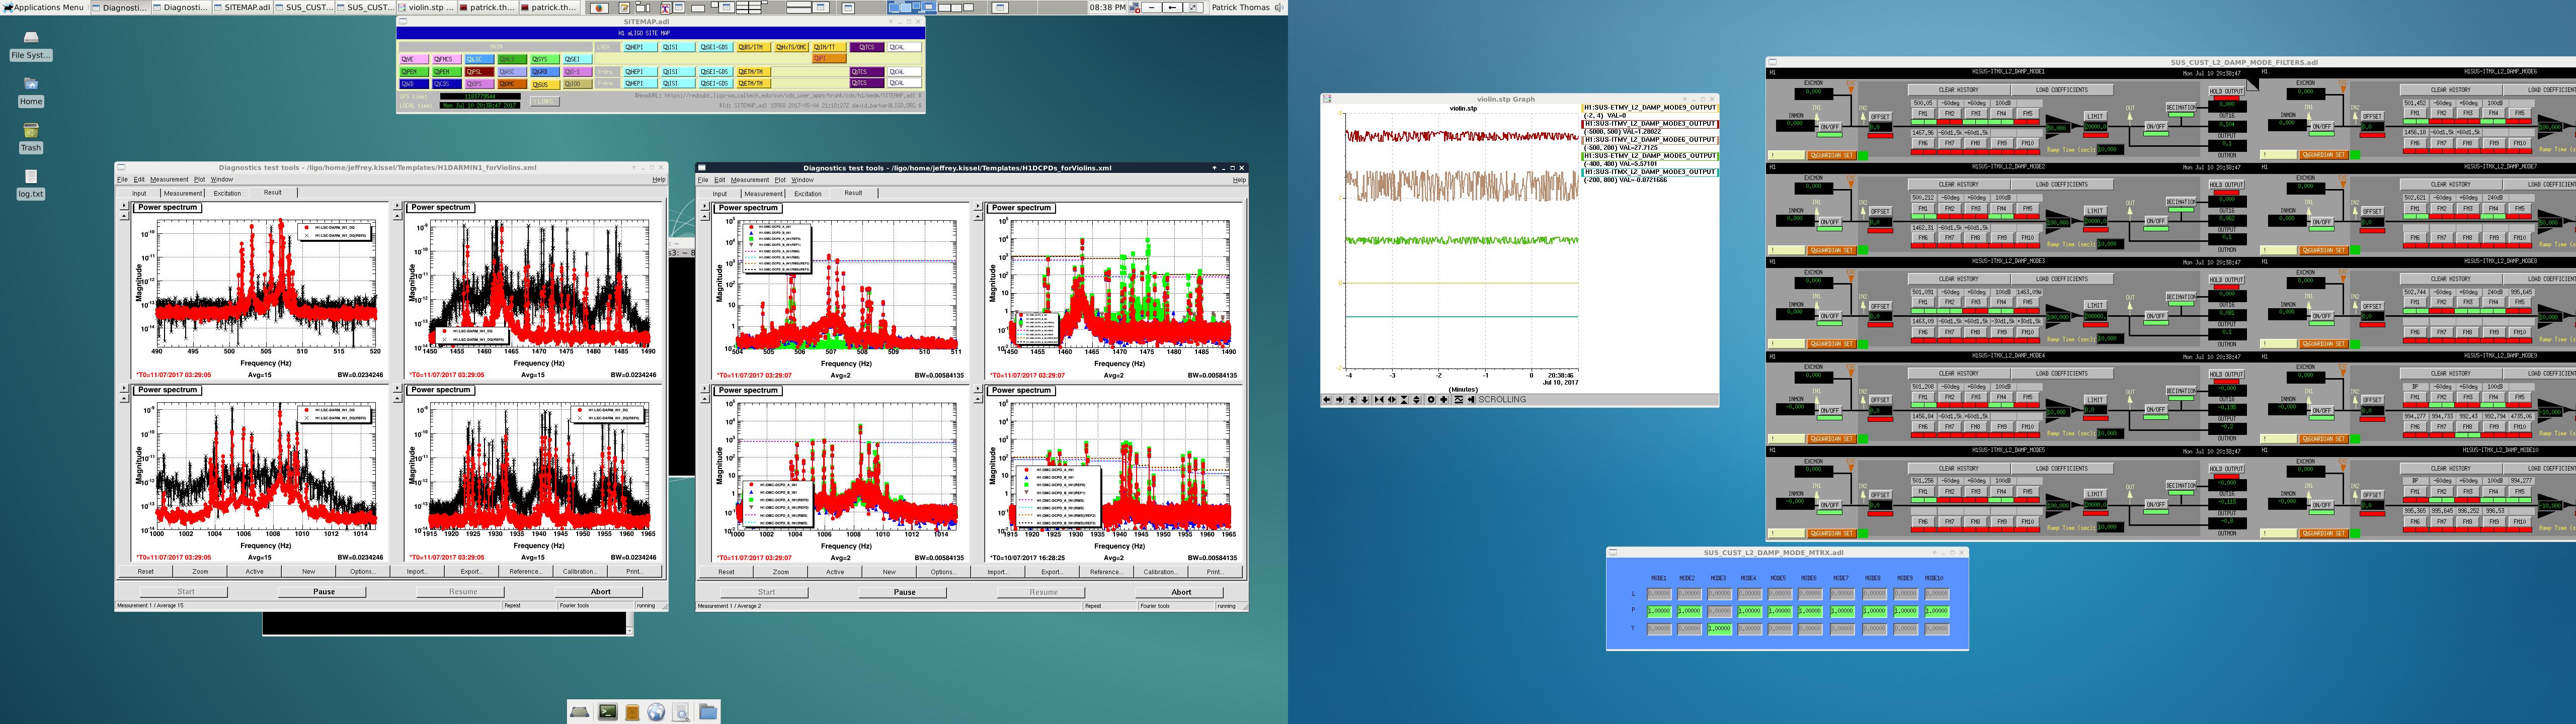
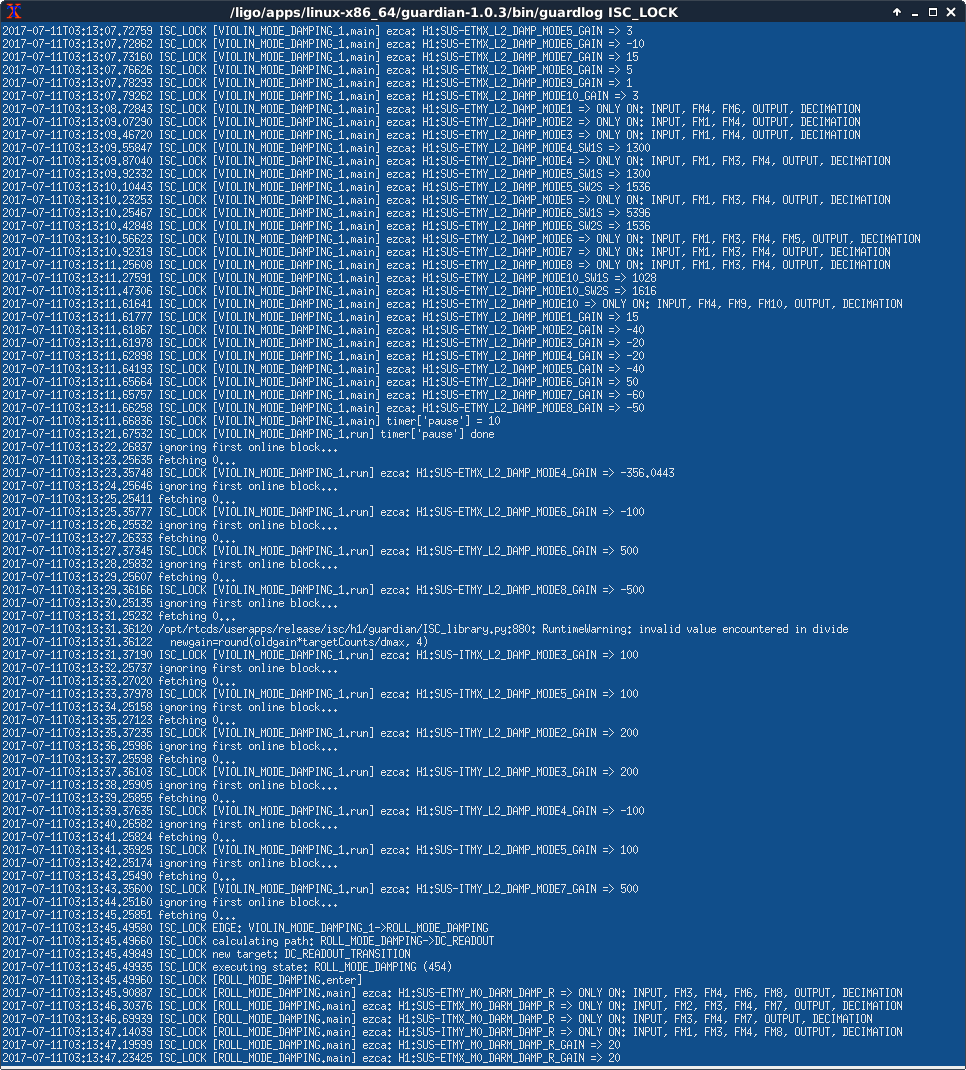
Tried setting ETMX violin mode 6 and mode 7 gain to 0. Did not help.
