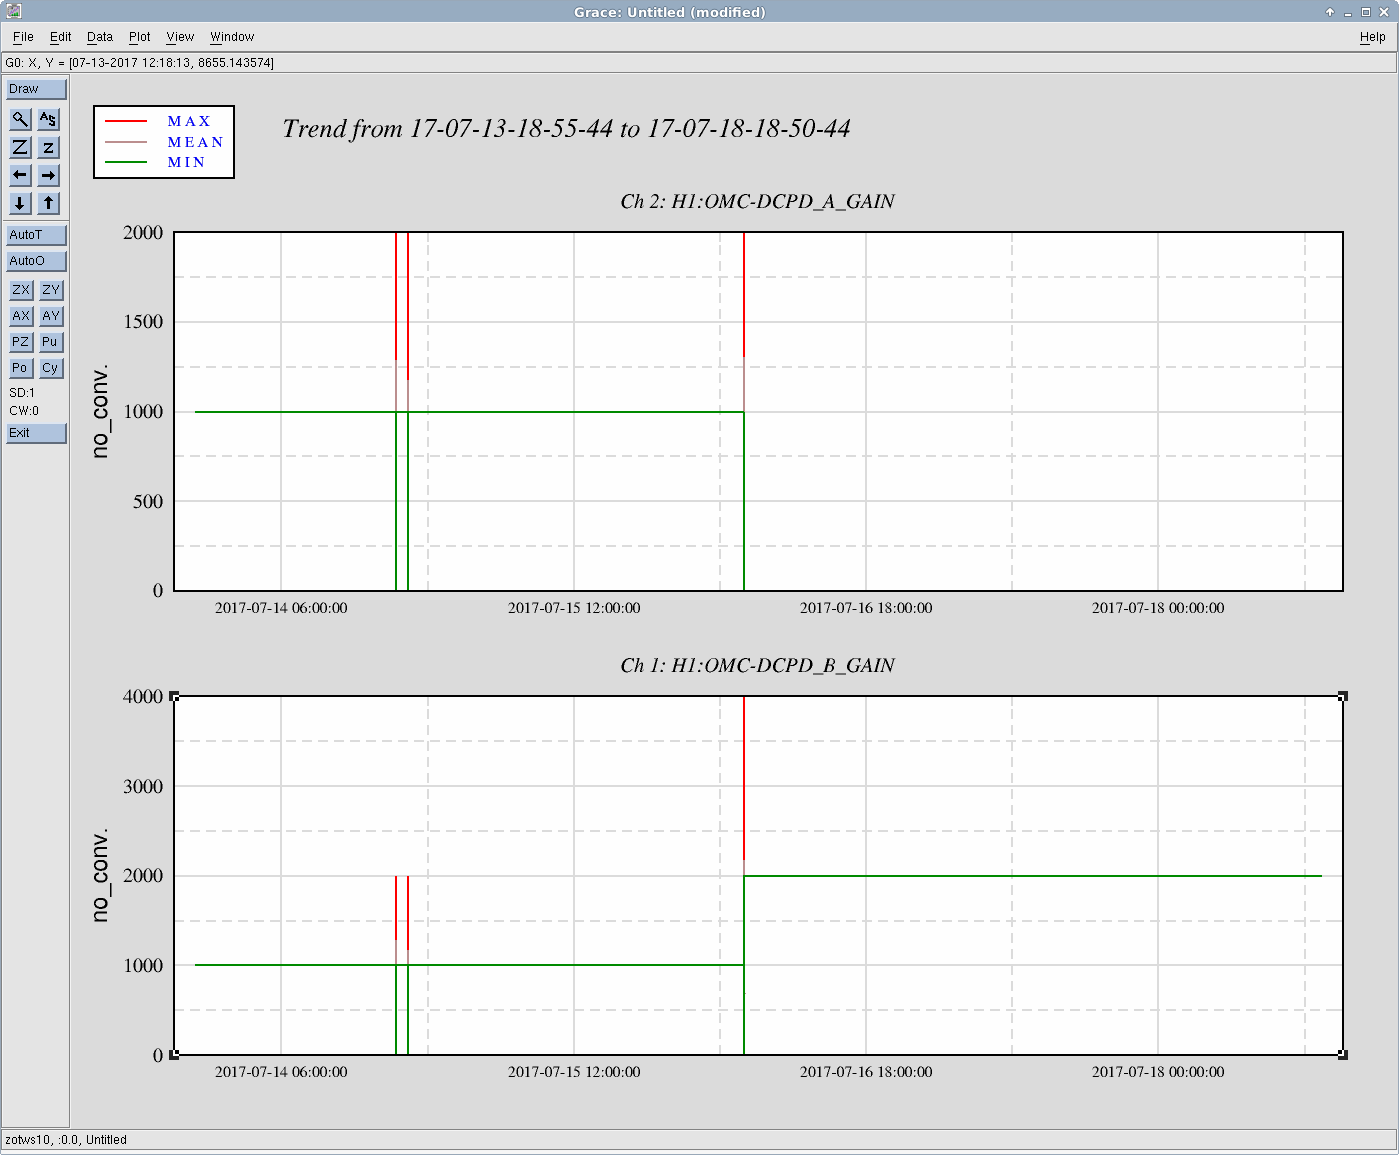
All end station chiller set points have been lowered from 43 to 40 degrees and Delta temp set points have been lowered from 10 to 7.
At the agreed time for the end of O2A, Fil and Peter helped by breaking the lock with an EY incursion (I forgot/didn't realize how close they were getting to the chamber...).
With the IFO now in down, I:
The LVEA is being transitioned to laser safe right now.
J. Kissel, E. Goetz We've turned off any and all user requested excitations for PCALX and PCALY, to save a little bit of life-time on the AOM and AOM driver over the break. SDF should easily capture these digital differences when we resume.
model restarts logged for Wed 21/Dec/2016 No restarts reported
model restarts logged for Tue 20/Dec/2016
2016_12_20 11:02 h1tw0
Tuesday maintenance, restarted h1tw0 with rebuilt SSD-RAID
model restarts logged for Mon 19/Dec/2016 - Sun 18/Dec/2016 No restarts reported
model restarts logged for Sat 17/Dec/2016
2016_12_17 09:57 h1ioppsl0
2016_12_17 09:57 h1psliss
2016_12_17 09:58 h1ioppsl0
2016_12_17 09:58 h1psliss
2016_12_17 09:59 h1psldbb
2016_12_17 09:59 h1pslfss
2016_12_17 09:59 h1pslpmc
2016_12_17 14:25 h1ioppsl0
2016_12_17 14:25 h1psliss
2016_12_17 14:26 h1ioppsl0
2016_12_17 14:26 h1psliss
2016_12_17 14:27 h1psldbb
2016_12_17 14:27 h1pslfss
2016_12_17 14:27 h1pslpmc
Restarts of h1psl0 models due to IO Chassis glitching caused by Beckhoff chassis hardware issues.
I noticed a couple of minutes ago that IMC-F and a few other arm length channels briefly had a very low frequency oscillation with a period of about 2 minutes. This is the period of the BRSs so, I did a quick check and found that BRS-X was damping at the time. Attached trend shows a BRSX velocity montior, IMC-F_OUT and a couple damping status bits from BRS-X. You can see from the BRS velocity that it was a little rung up, the damper engaged as designed and quickly brought it back down, but when the damper engaged this coupled into some of the IFO length signals. A couple things to prevent this would be more low frequency roll off in the sensor correction filter, or revisiting the thresholds on the damper. This is all at 8mhz though, so maybe it's not such a big deal.
DQshifter: Beverly
LHO fellows: Evan, Young-Min
Full results may be found here.
I am beginning about 45 minutes of HVAC on/off, approved by Keita. As in O1 and previously, we will not be dropping from observation mode because we normally dont drop observation mode when chillers and turbines are changed.
The tests began at 21:24:00 and ended at 22:16:00. More soon.
I showed Jenne settings I've used to damp violin mode 1 on itmx and mode 7 on etmy that have consistantly damped the mode faster than the settings that were in guardian.
I updated ISC_GEN_STATES.py and checked it into svn.
A note about svn: While checking in ISC_GEN_STATES.py, through a typing error, I inadvertantly checking in ISC_LOCK.py. The ISC_LOCK.py backup file is dated Dec 7th. I also checked in my DIAG_MAIN.py change I made on Dec 20th, alog 32781.
CP3 log file DOES NOT exist! CP4 log file DOES NOT exist!
Tested that if the autofill report files do not exists for the current day (which is the case today, previous test had 21Dec hardcoded) then the alog correctly reports this.
Starting CP3 fill. LLCV enabled. LLCV set to manual control. LLCV set to 50% open. Fill completed in 1476 seconds. TC B did not register fill. LLCV set back to 19.0% open. Starting CP4 fill. LLCV enabled. LLCV set to manual control. LLCV set to 70% open. Fill completed in 36 seconds. TC B did not register fill. LLCV set back to 34.0% open.
Further testing of roboalog entries reporting on CP3,CP4 autofill. This alog has an image attached, the strip tool of the autofill.
WP6412 VAC alarms, add CP1-8 discharge line pressures to cell phone texter
Dave:
The Discharge Line Pressure signals will send cell phone alarms if they remain above 2.0PSI for 5 minutes or longer. The associated Beckhoff ERROR channels will alarm if they record an error. Alarm system was restarted to install the new configuration at 11:04
Modified the LHO MEDM Screens web page to promote the TCS X and Y screens to the main page and remove them from the PSL Detailed Screens page. Clicking on the smaller images in the LHO MEDM Screens web page will open full size more readable versions of the screens.
[Borja]
This entry is to reproduce the analysis I did at L1 as described here and the associated comments.
The main idea is that currently during locklosses many control signals to the suspensions (QUAD and tripple suspension) become too large, which may have an effect on their stability and the time taken to relock. Also the control signals, in many cases, take many seconds to be turned off by GUARDIAN. An approach to deal with this could be to set limits to the range of values that these control signals are allowed, for this I have compiled a range of values these channel had during many lock segments in the range of 1.5 months.
The control channels analysed are given on the attached file 'H1_SUS_channels_for_analysis' (total of 192 channels). From these 157 channels did not have a range of zero for all lock segments.
The lock segments analysed are all those from Oct 22 2016 02:32:49 UTC to Dec 09 2016 19:23:51 UTC with DQ flag L1:DMT-GRD_ISC_LOCK_NOMINAL:1 which informs 'Guardian indicates IFO is in nominal lock state'. A total of 285 segments were retrieved but from those I only looked at lock segments lasting more than 15 secs which reduced the number of Segments to 280. From these there were abot 35 which gave errors when querying the data.
The huge ammount of results are given as figures with subplots each grouping multiple channels associated to a same suspension. The horizontal axis is always 'Number of Segment', the vertical axis it will depend on the analysis done; range during lockloss, time taken to zero de channel after lockloss and Value of the channel during lock (max, min and median).
Each figure is given as a Matlab figure file because of the possibility to turn on and off individual lines on each highly populated subplot and because of the orders of magnitude difference in the range of values that different channels for the same suspension can have (a .png version of the figures is also attached for convenience but notice that to get the full information you will have to look at the .fig file). I have also attached the matlab scripts used to generate each set of results.
Results:
1) Range values around a lockloss: for every lockloss of the analysed lock segments I requested 10 seconds before and after the relock, then the variation range is calculated for each of the analysed channel list (difference between the maximum and minimum values of the 20 seconds of data centered on the lockloss). Script named: matlab_code_range_lockloss.m, Figures named: Fig#_Lockloss_Range_10secs_beforeandafter.fig
It is not rare to see ranges during lockloss between several million to several billion counts!
I have also attached the actual DATA obtained where you can identify the time interval of the Segment number for the plots as well as the plotted ranges and channel names (DATA-Lockloss_Range_10secs_beforeandafter.m).
2) Number of seconds to turn off the channels after lockloss: Again for every lockloss on the analysed segments and channels I query up to 80 seconds after lockloss and see how many seconds it takes for the channel to be turned off. In many cases the answer is 80 seconds which means that it does not turn off during the queried time. Values of zero or negative seconds can be ignore. Figures named: Fig#_TimeToZero_after_lockloss_80secsMax.fig
Each channel plot is accompanied with a dashed line of the same colour which represents the median (not the mean) of the respective channel plot for all the segments. Therefore showing what is the most common time to zero per channel. I have also attached a summary of the median information on a single plot where the horizontal axis is in this case the channel number as per the variable SUS_channel included on the DATA-TimeToZero_after_lockloss_80secsMax.mat file (again ignore negative values). It is clear from this plot that most channels are not turned off within 80 secs after lockloss.
I have attached the Matlab script used to generate these results (matlab_code_TimeToZero_after_lockloss.m).
3) Values of the control channels during lock segments: In this case for each subplot there is a maximum of 5 channels related to the same suspension. For each channel I show the Maximum, Minimum and Median values that the respective channel has for each lock segment. I also attach the matlab cript used to generate this results (matlab_code_lock_segment.m) and a matlab file (DATA-During_lock_data_from_20161022_till_20161210.mat) with the relevant variables containing matrices; Maximum, Minimum and Median of the data. These matrices have dimensions: 'Number of Segments' x 'Number of Channels', these dimension correspond to the also included variables 'Segments' and 'SUS_channels'. Figures named: Fig#_Values_during_lock.fig
Notice that at the time of this analysis a bigger number of segments (about 180 of the 280 segments analysed) did not return data, this happened using both servers: nds.ligo.caltech.edu and nds.ligo-wa.caltech.edu. I do attach the results here but notice that the long zero stretch at the middle is due to this lack of information. To increase the number of segments with data, I also queried a more recent interval between Dec 01 2016 03:29:55 UTC till Dec 20 2016 23:32:39 UTC. This corresponds to a further 99 segments (filename: Segments_Lownoise_LOCK_NOMINAL_from_20161130_till_20161221_H1.txt). For this case the figures are named: Fig#_Values_during_lock_2ndInterval.fig, and the DATA file name is: DATA-During_lock_data_from_20161130_till_20161221.mat
Around 9 am I was told that the laser had tripped. This is the first trip in some time. Attached is a screen dump of what the Beckhoff status screen indicated. Since it indicates a head 1-4 flow problem, most likely the flow rate in head 3 dipped below the minimum flow rate. The laser came back without much ado.
5.2M Nikol'skoye, Russia
Was it reported by Terramon, USGS, SEISMON? Yes, Yes, No
Magnitude (according to Terramon, USGS, SEISMO): 5.2, 5.2, NA
Location 79km W of Nikol'skoye, Russia; LAT: 55.3, LON: 164.7
Starting time of event (ie. when BLRMS started to increase on DMT on the wall): 16:30 UTC
Lock status? Still locked
EQ reported by Terramon BEFORE it actually arrived? I noticed the EQ band BLRMS coming up before checking Terramon.
We just lost lock, but I think it's pretty clearly not from the earthquake. The PSL is down, Peter is taking a look at it.
Carlos, Jim B, Dave, Nutsinee
Follow up of WP6382
I took advantage of the earlier down time to test the HWS stream images script and swapping CLink around. The original set up after Carlos installed the second PCI-e card was HWSY CLink was plugged into the new card and HWSX CLink remained the same (plugged to old card). HWSX streamed live images without problem while HWSY can't get any sensible image at all (see attachment). So I tried a few more configurations:
We have come to the conclusion that the spare card might be busted. The next thing to try is to order a new card and try again. This way we will know for sure that the card actually works. We don't know where the spare card came from and whether or not it has been tested.
Only HWSX code is left running for now.
The cards were all ordered at the same time for aLIGO but were not individually tested.
It's probably the capture card but It might also be the actual PCI slot on the bus. Have you tried swapping the two cards around?
Such that MC2 is also aligned, I have un-managed the SUS_MC2 guardian, and set it to Aligned. In order to re-lock the IMC, we will need to run Init on the IMC_LOCK guardian to reacquire management of the MC2 guardian.