edmond.merilh@LIGO.ORG - posted 17:37, Friday 04 August 2017 - last comment - 17:38, Friday 04 August 2017(38006)
H1 back into Observing
00:32UTC
After relocking and a2l, Sheila cleared an ETMX bias diff and cleared for Observing.
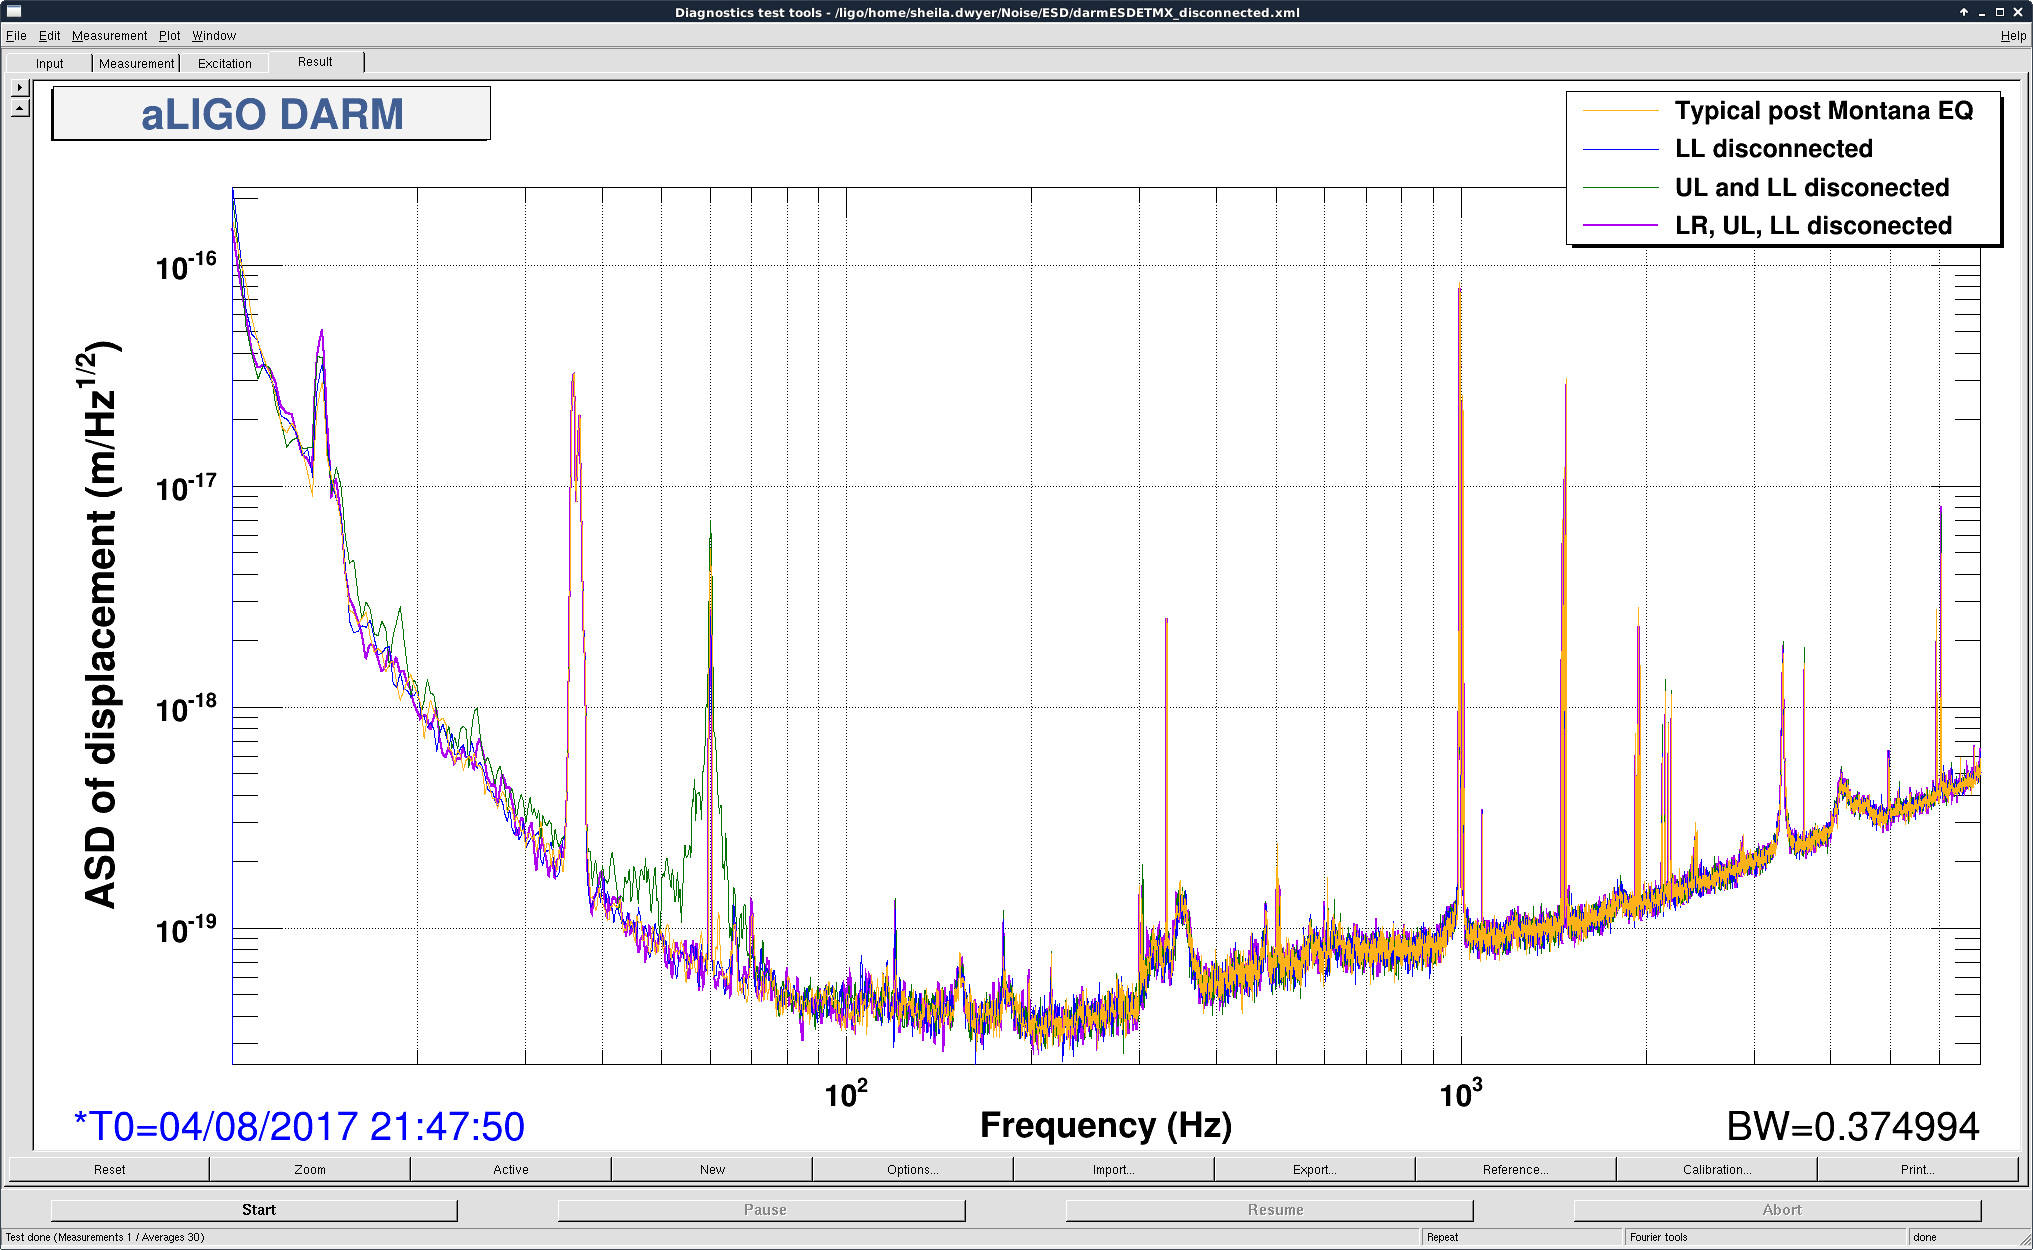
I suppose mentioning the previous lockloss would be in order. This occurred at 23:35UTC. It was a Sheila induced lockloss as she was manipulating ETMX ESD.