Pep Covas, DetChar, Anamaria Effler, Rick Savage, Robert Schofield
Summary: Ravens peck at the ice on the cryopump GN2 vent lines around the site, and the signal from simulated pecking at EY suggests that this pecking is the source of certain common DARM glitches identified by DetChar. Evidence from PEM coupling functions, beam tube shaking, P-Cal periscope resonance measurements, and beam-spot perspecive photos, support a hypothesis that the raven pecks vibrate the GN2 vent tube, which is connected to and vibrates the vacuum enclosure and P-Cal periscope, thereby varying the optical path length of light that is scattered from the test mass and reflected back from the P-Cal viewport glass such that it recombines in varying phase with the main beam. The back-reflection of light from the viewport glass is made likely by the position and orientation of the P-Cal periscope mirrors, including the P-Cal beam relay mirrors. So we may still have some noise even if we remove the camera mirrors and baffle the periscope. We request more PEM injection time to study this possibility and for newly identified scattering at EY. The scattering problem might be solved (and we might be able to keep camera mirrors) if we can adjust the mirrors so that the image of the test mass beam spot is not perpendicular to the viewport glass.
DetChar has reported many first round Hvetos for Y-end microphones, such as the ones visible at about 94 Hz in Figure 1. Jordan played the microphone signal for me and I recognized the sound as similar to what I had heard when I found ravens on the outside cryopump/LN2 lines at EY. Last Friday we got some PEM injection time and Pep and I went out to study this coupling to DARM.
We took a closer look at the cryopump lines that I had seen the ravens on, and found many peck marks, consistent with the size of a ravens’s beak, in the ice that accumulates on the cryopump nitrogen gas vent line (see Figure 2). Figure 2 also shows a raven caught in the act of pecking ice, not at EY, but at the corner station. I guess we can’t blame them for desiring shave ice on a hot desert afternoon. Figure 2 also shows Pep chipping at the EY ice to see if such imitation pecking could account for the glitches in DARM.
Figure 3 is a comparison of spectrograms of an EY microphone and DARM for the imitation pecks and the time of the cluster of glitches just before 20:00 UTC in the Hveto plot of Figure 1. The signals on the microphone and the effect in DARM were similar for our chipping and the event from Hveto.
Light insulation on the vent line could allow the nitrogen to warm up slowly without ice accumulation, or, alternatively, a loose sheet metal shell could prevent pecking without icing up. And there is ice at a different location below the LN2 dewar for desperate ravens.
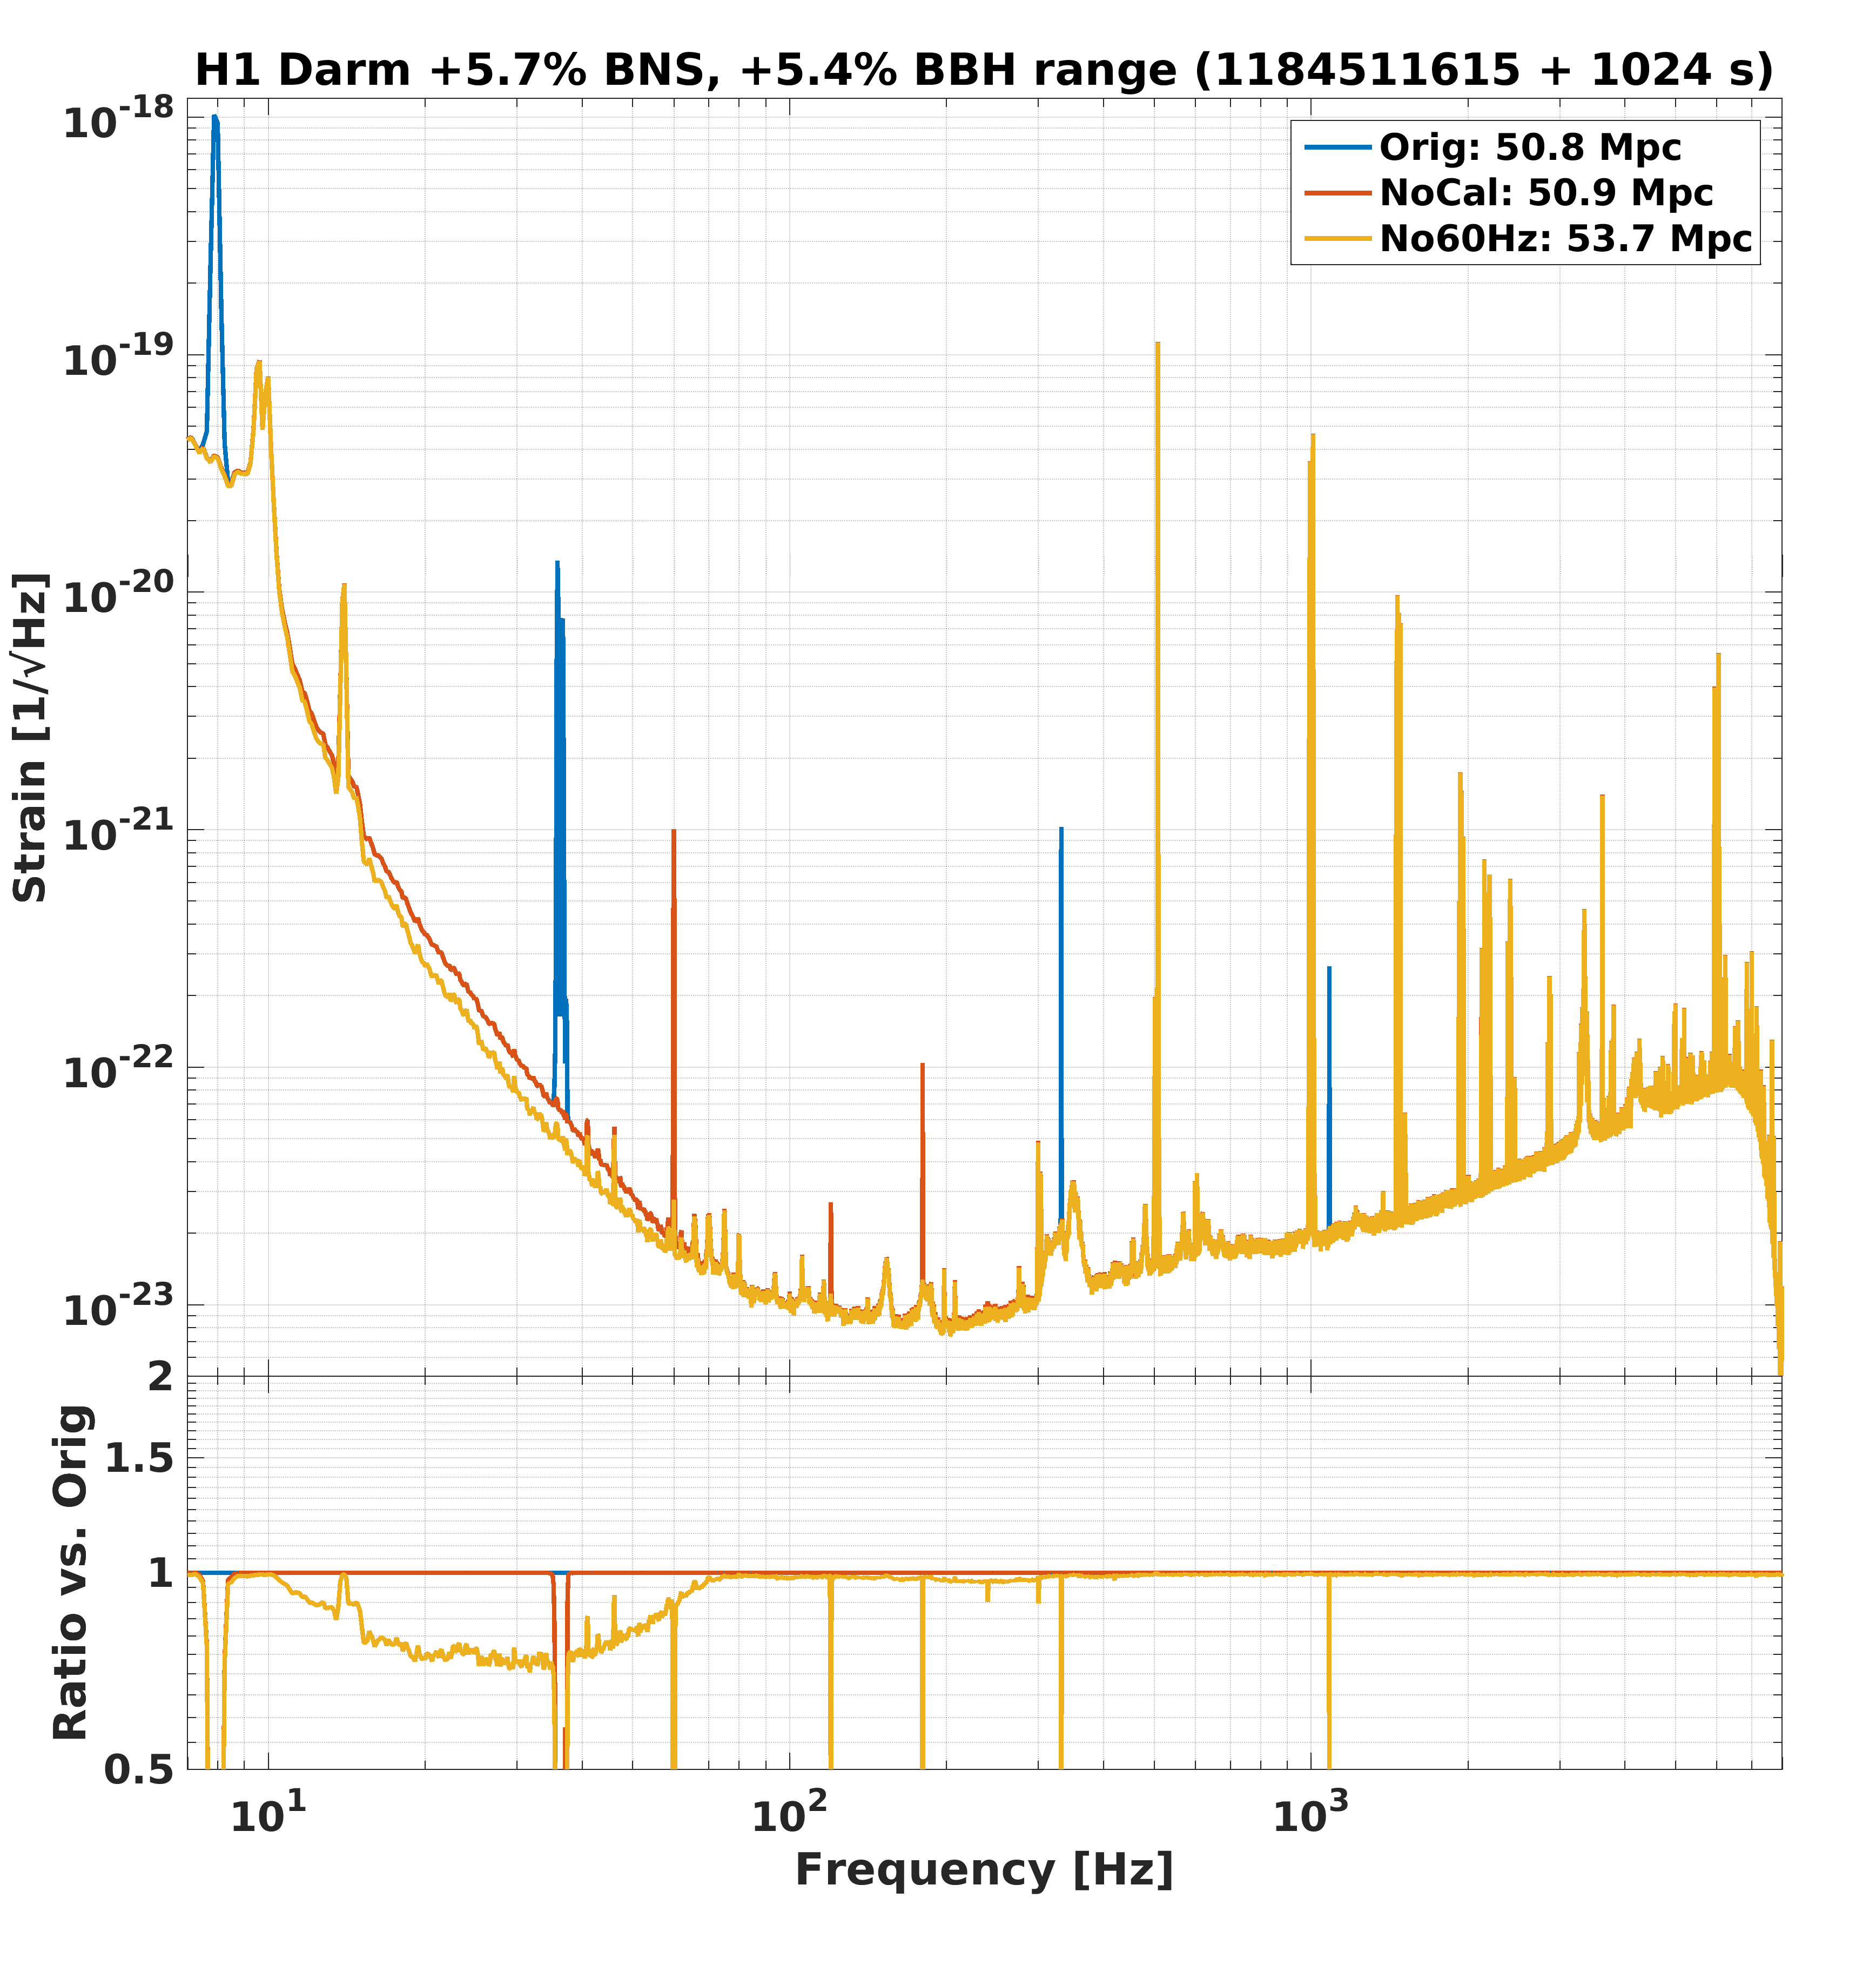
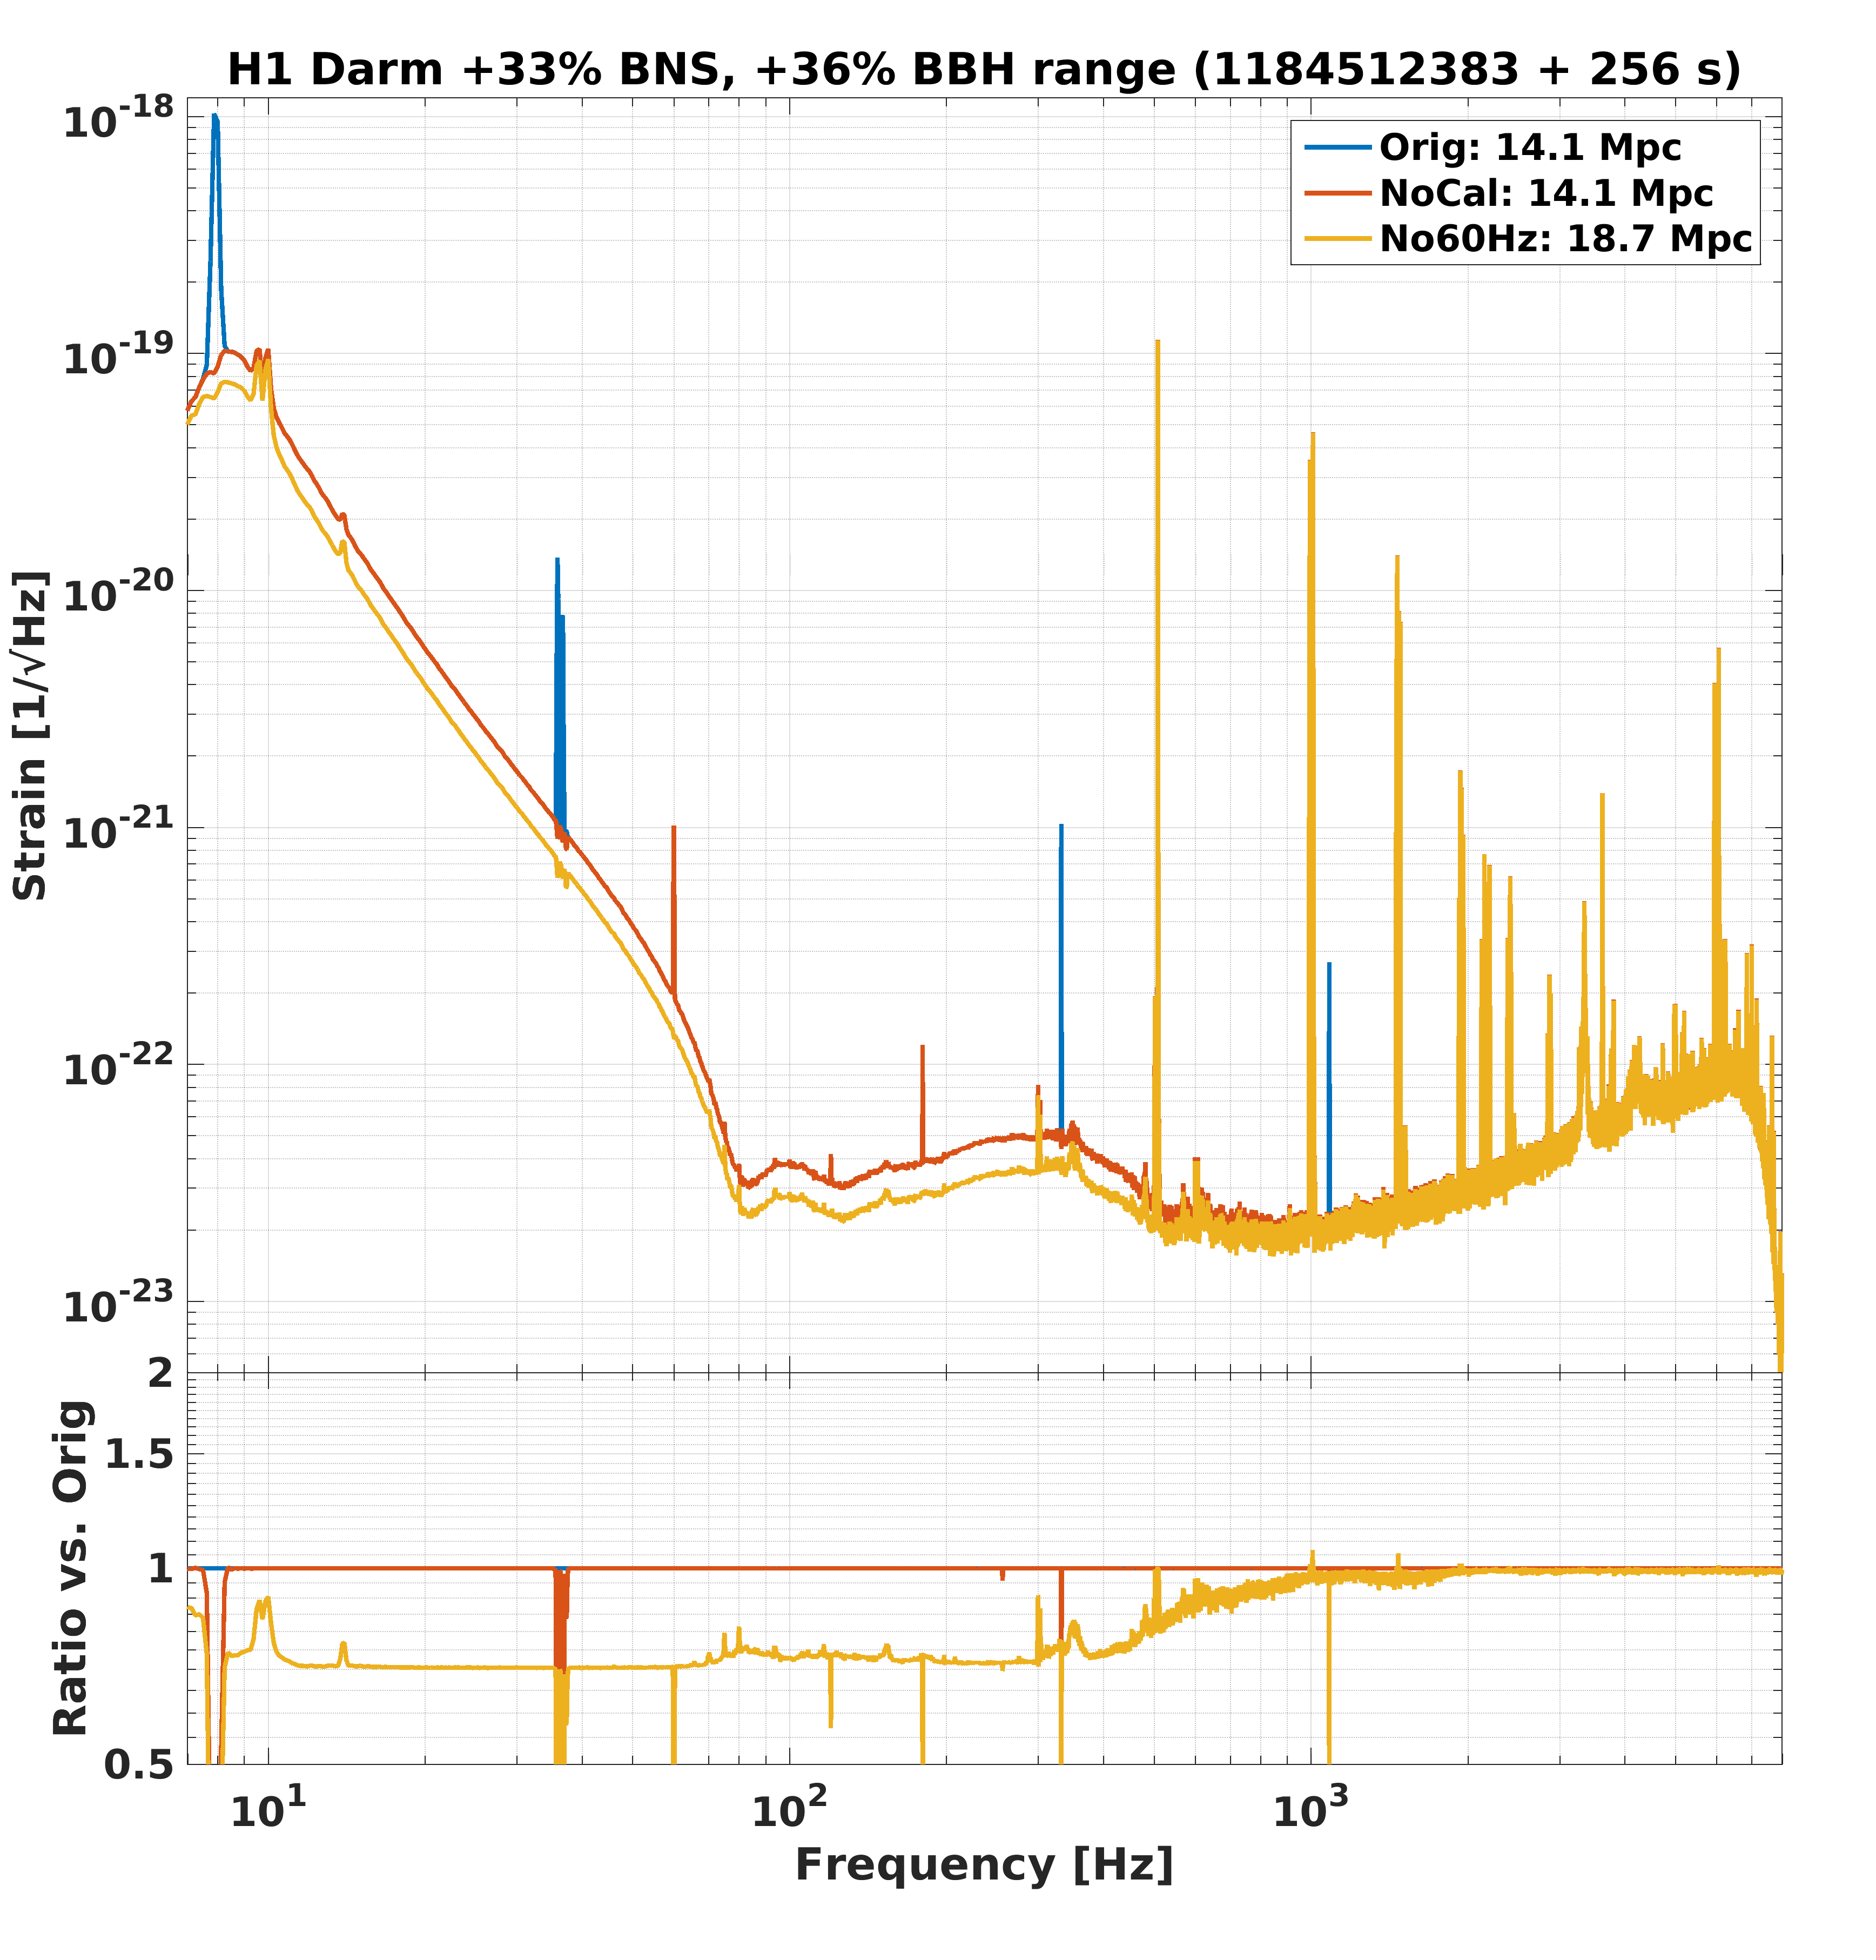
We repeated one of the standard acoustic injections to compare acoustic coupling to the pre-run PEM injections and to see if measured coupling functions could account for the raven coupling. Figure 4 shows that coupling for acoustic injections has increased since the November measurement, especially at the ~94 Hz peak.
The new coupling function for the –Y mic (6.2e-17m of DARM per Pa of sound pressure at about 94 Hz) underestimates the effect of the bird pecks in DARM, by nearly a factor of ten, while the new coupling function from the BSC10 ACCX (about 2e-8 m/m), for the same acoustic injection, gives a much closer estimate of 1.4 times the actual peak height in DARM (data shown in Figure 5). Thus, the VEA sound level from the pecking doesn’t seem loud enough to account for the effect in DARM, and the coupling route is likely through the direct mechanical connection of the pecked GN2 vent tube to the vacuum enclosure.
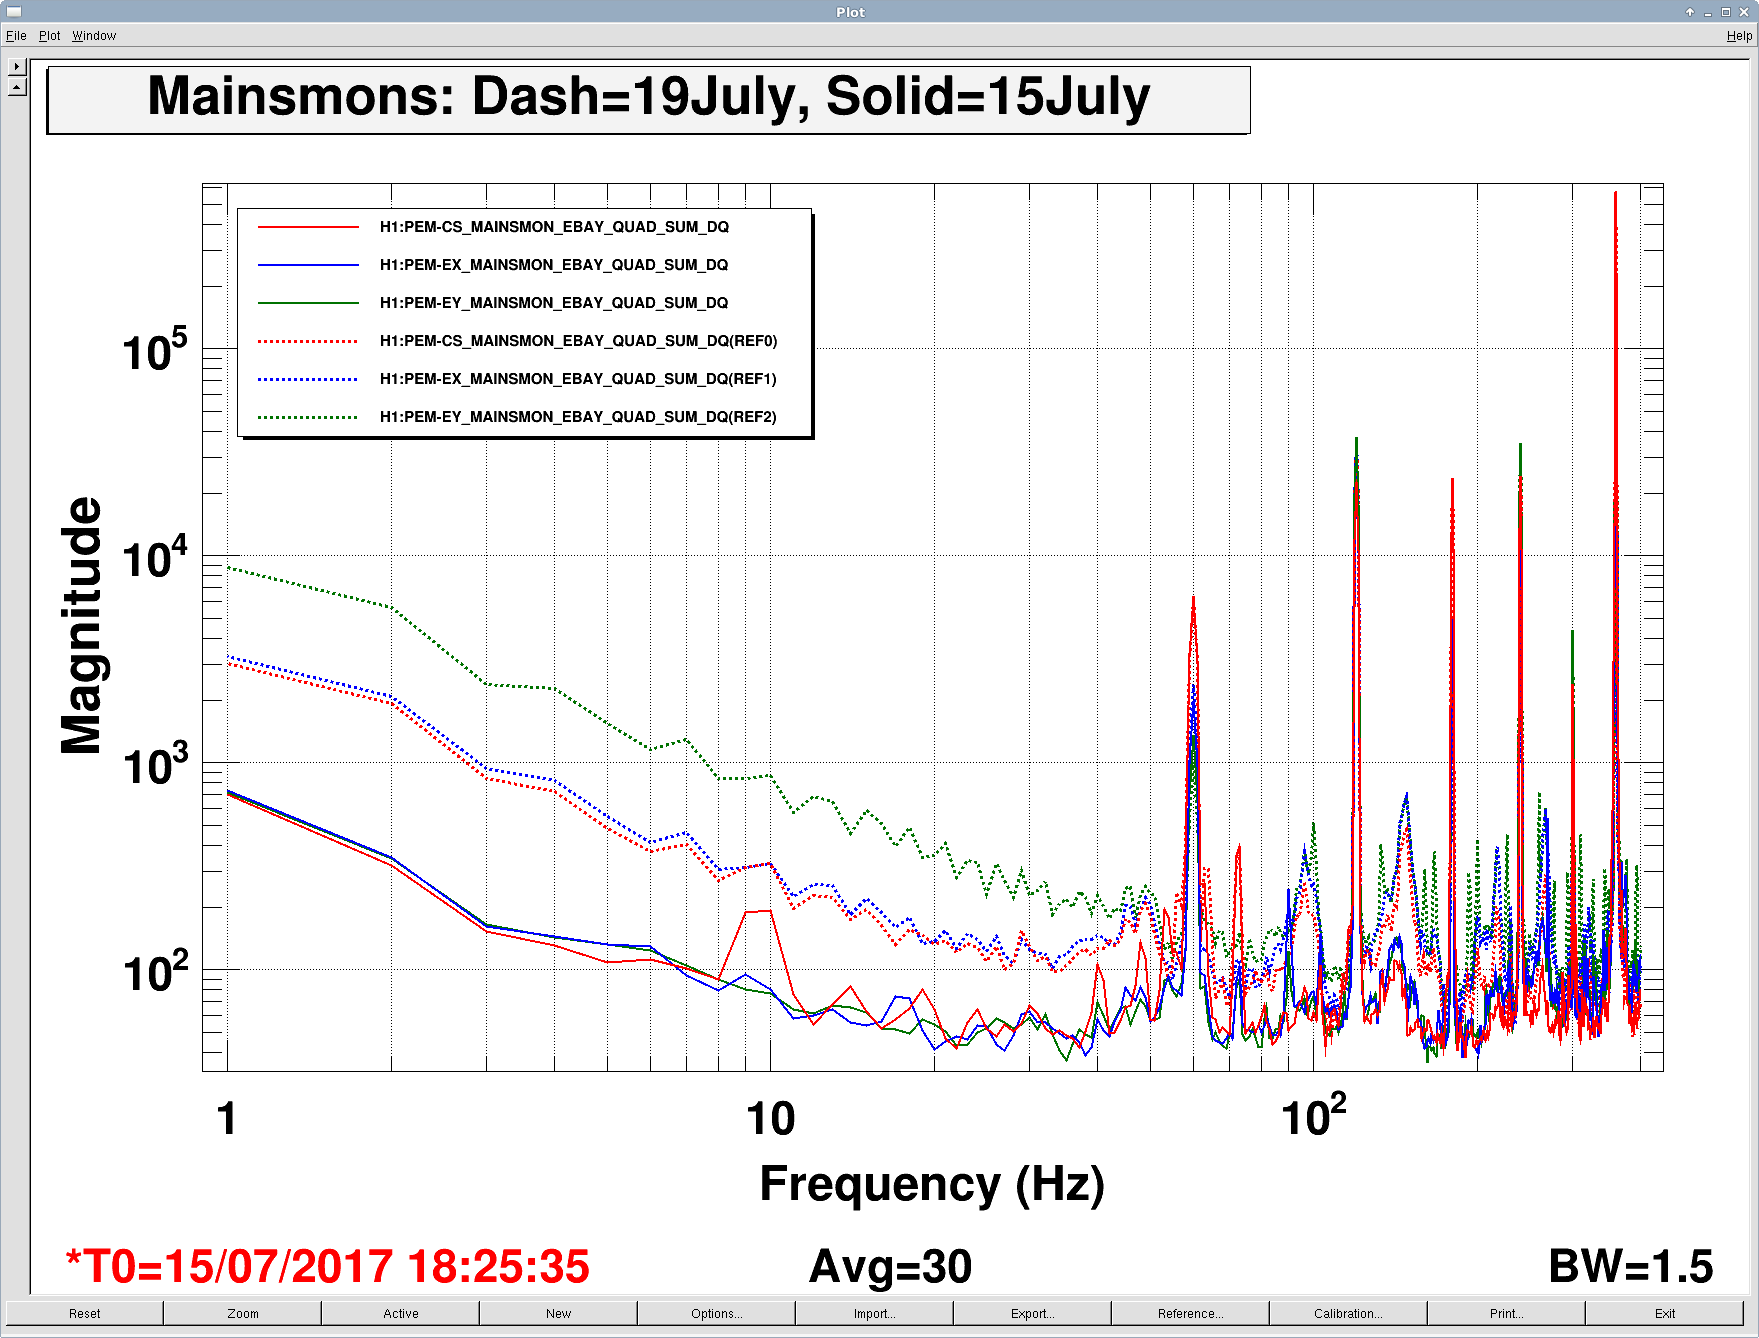
We ran the shaker that was set up on the beam tube to excite the P-cal periscope and found a stronger response at ~94 Hz than we had in the past. A look at the resonances measured for the P-Cal periscope at LLO show a strong 93 Hz resonance that was damped with a SUS damping cube (https://alog.ligo-la.caltech.edu/aLOG/uploads/33697_20170512084726_2017-05-11_Phase3a_L1_BSC5_PCAL_Periscope_Vert.pdf ). Because the 94 Hz feature excited by the birds in DARM is excited by somewhat localized shaking in the region of the periscope, a known scattering site, and because of the similar resonance measured for the LLO periscope, it is likely that the peck coupling is produced by scattering associated with the periscope.
A detailed understanding of the scattering may help us ensure that it is corrected for O3. The inability to mitigate the scattering (including the ~94 Hz peak) with black glass in the viewports (https://alog.ligo-wa.caltech.edu/aLOG/index.php?callRep=31261) suggests that the problem is not scattering from outside the ports, but from the periscope structure or the viewport glass. The viewport glass can reflect the light scattered from the test mass directly back to the test mass if the camera and P-Cal beam relay mirrors place the image of the beam spot directly in front of the viewports so that the scattered light path is perpendicular to the viewport. One of my photos from the point of view of the test mass beam spot showed such a retroreflection (https://alog.ligo-wa.caltech.edu/aLOG/uploads/8281_20131027132038_Figure1-ViewFromETMXBeamspot.jpg). Based on the linked and other beam spot perspective photos, I think that the view port glass may be the dominant problem. The relay mirrors place the beam spot image nearly perpendicular to the glass in all 3 paths, including the P-Cal beam, so removing 2 paths, the camera relay mirrors, may not be enough to completely mitigate the retroreflections (not to mention that we would like to keep the camera mirrors). It might be possible to angle the mirrors slightly so that the scattered light hits the viewport at a larger angle. If not, we may need to move the mirrors or add more.
We need more PEM injection time to shake the P-Cal beam viewports in order to see if they are reflecting scattered light. Also, Pep and I found that exciting the cryopump produced scattering shelves for some resonance that is at a lower frequency than the P-call baffle resonances and we need time to study this.


)
As I was leaving, noticed some star gazers parked in front of the LSB. They were leavin' as I was leaving.