cheryl.vorvick@LIGO.ORG - posted 12:04, Tuesday 20 June 2017 (37022)
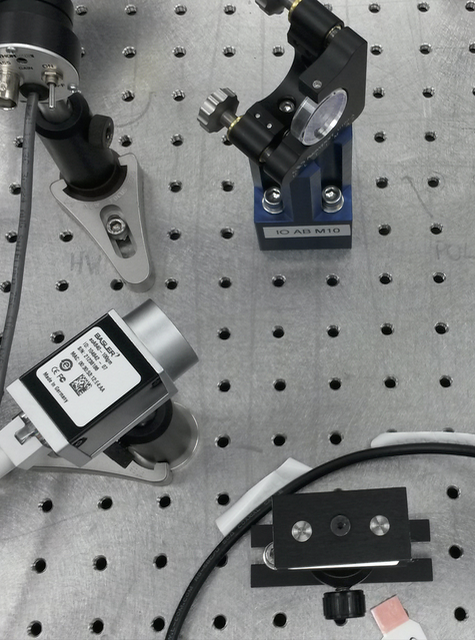
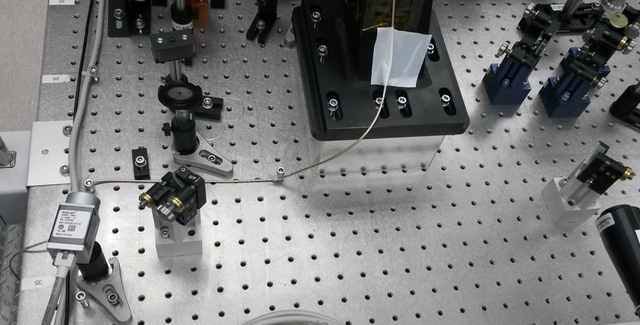
GigE cameras installed on PSL, plugged in, but no beams on them
- cables pulled in to the PSL
- IO_GigE1 placed near it's final location, 18.5 inches from lens IO_AB_L2
- IO_GigE2 placed at the edge of the table in such a way that it's cable is coming onto the table in the right location
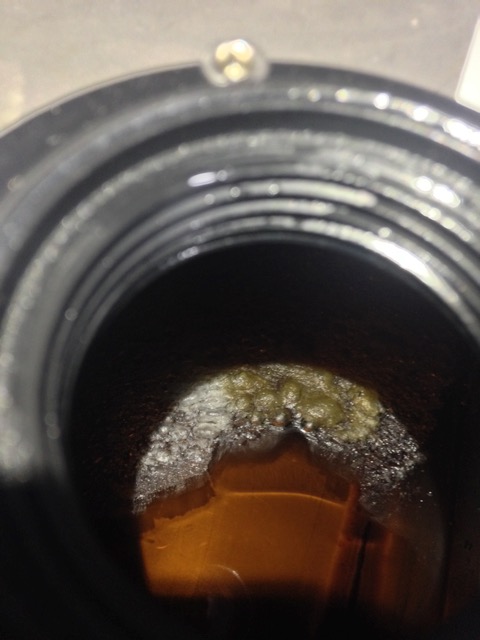
- both IO beams exceed the power density for the GigEs at 30W, so will require additional attenuation before cameras are installed
- IO_GigE1 is S/N: 21238186
- IO_GigE2 is S/N: 21238190
- IO_GigE1 beam position: ~1.5mm diameter beam, current beam power at 30W is 1mW
- IO_GigE2 beam position: ~1.5mm diameter beam, current beam power at 30W is 20.8mW
- Sheila, Cheryl
Images attached to this report