patrick.thomas@LIGO.ORG - posted 04:02, Wednesday 14 June 2017 (36874)
Ops Owl Mid Shift Summary
Earthquake has substantially subsided. Finished initial alignment. Attempting to relock.
Earthquake has substantially subsided. Finished initial alignment. Attempting to relock.
I'm confused. I was almost certain I had updated the FMCS medm screens actually linked from the sitemap. However running svn update in /opt/rtcds/userapps/release/fmcs/h0/medm gave:
The conflict is because I had just started to edit this screen.
The screens linked from the sitemap now reflect the changes I had made. I'm not sure where I checked in the changes from if it was not /opt/rtcds/userapps/release/fmcs/h0/medm. I have a copy of these screens in my home directory but they do not seem to be an svn working copy. Did someone revert /opt/rtcds/userapps/release/fmcs/h0/medm to an earlier revision?
TITLE: 06/14 Owl Shift: 07:00-15:00 UTC (00:00-08:00 PST), all times posted in UTC
STATE of H1: Earthquake
OUTGOING OPERATOR: TJ
CURRENT ENVIRONMENT:
Wind: 9mph Gusts, 7mph 5min avg
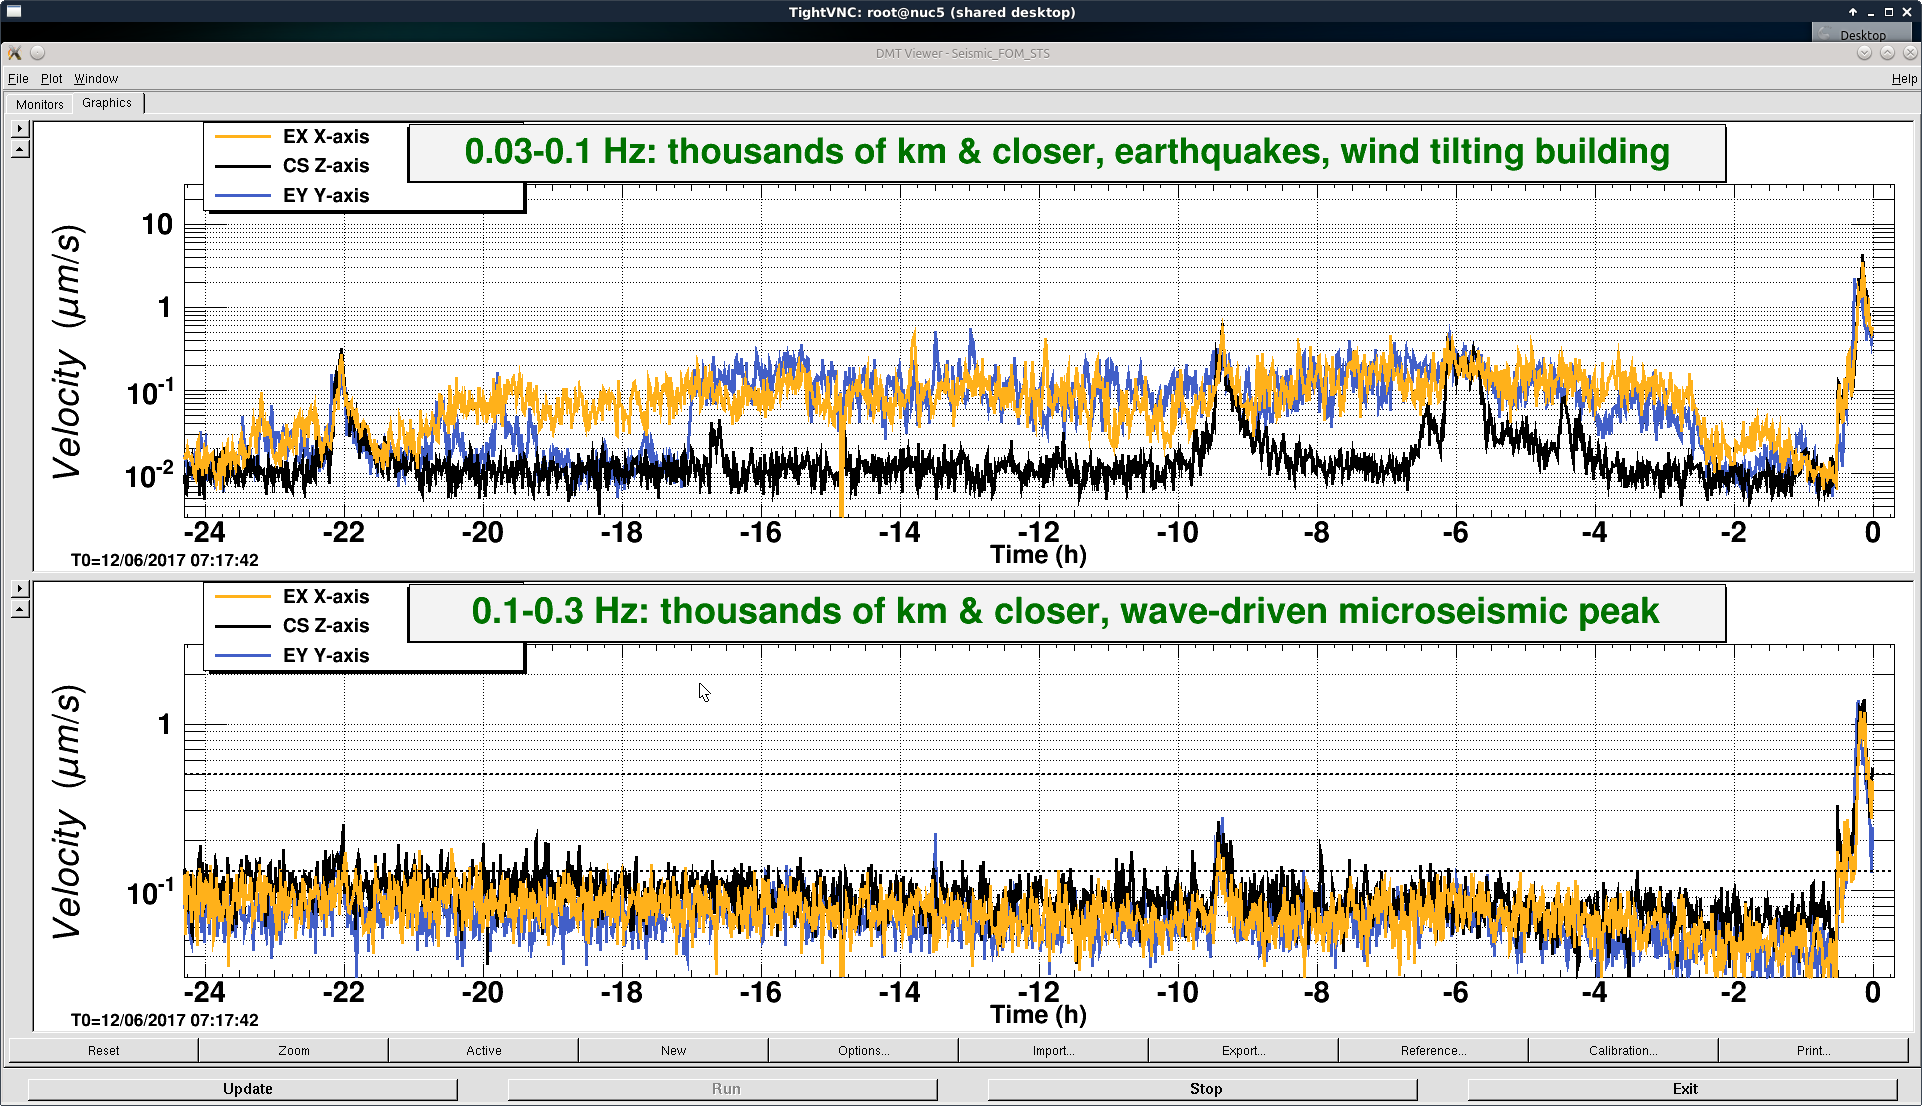
Primary useism: 0.26 μm/s
Secondary useism: 0.17 μm/s
QUICK SUMMARY:
Just lost lock coincident with earthquake.
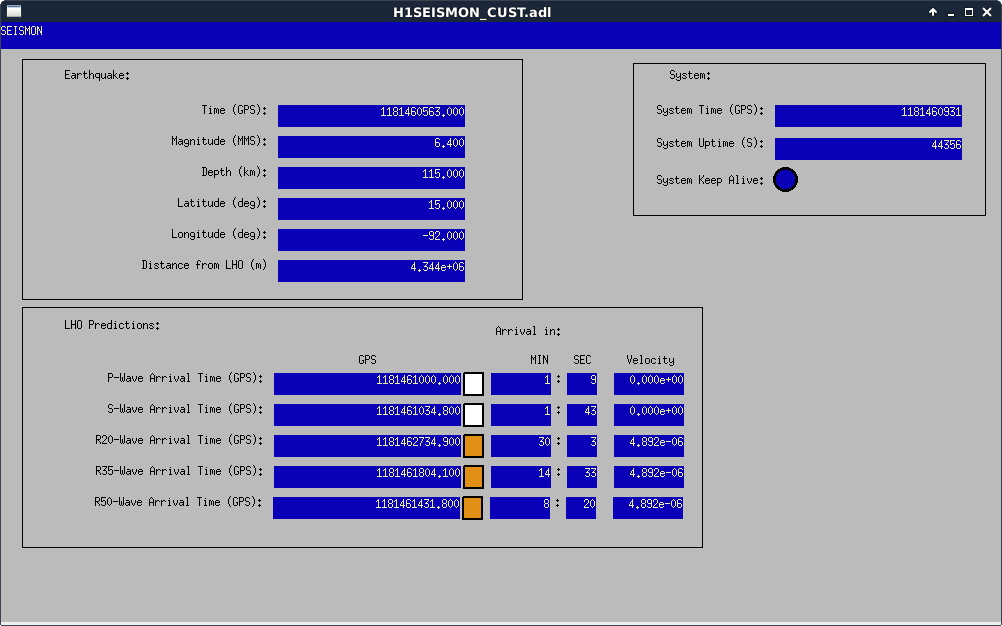
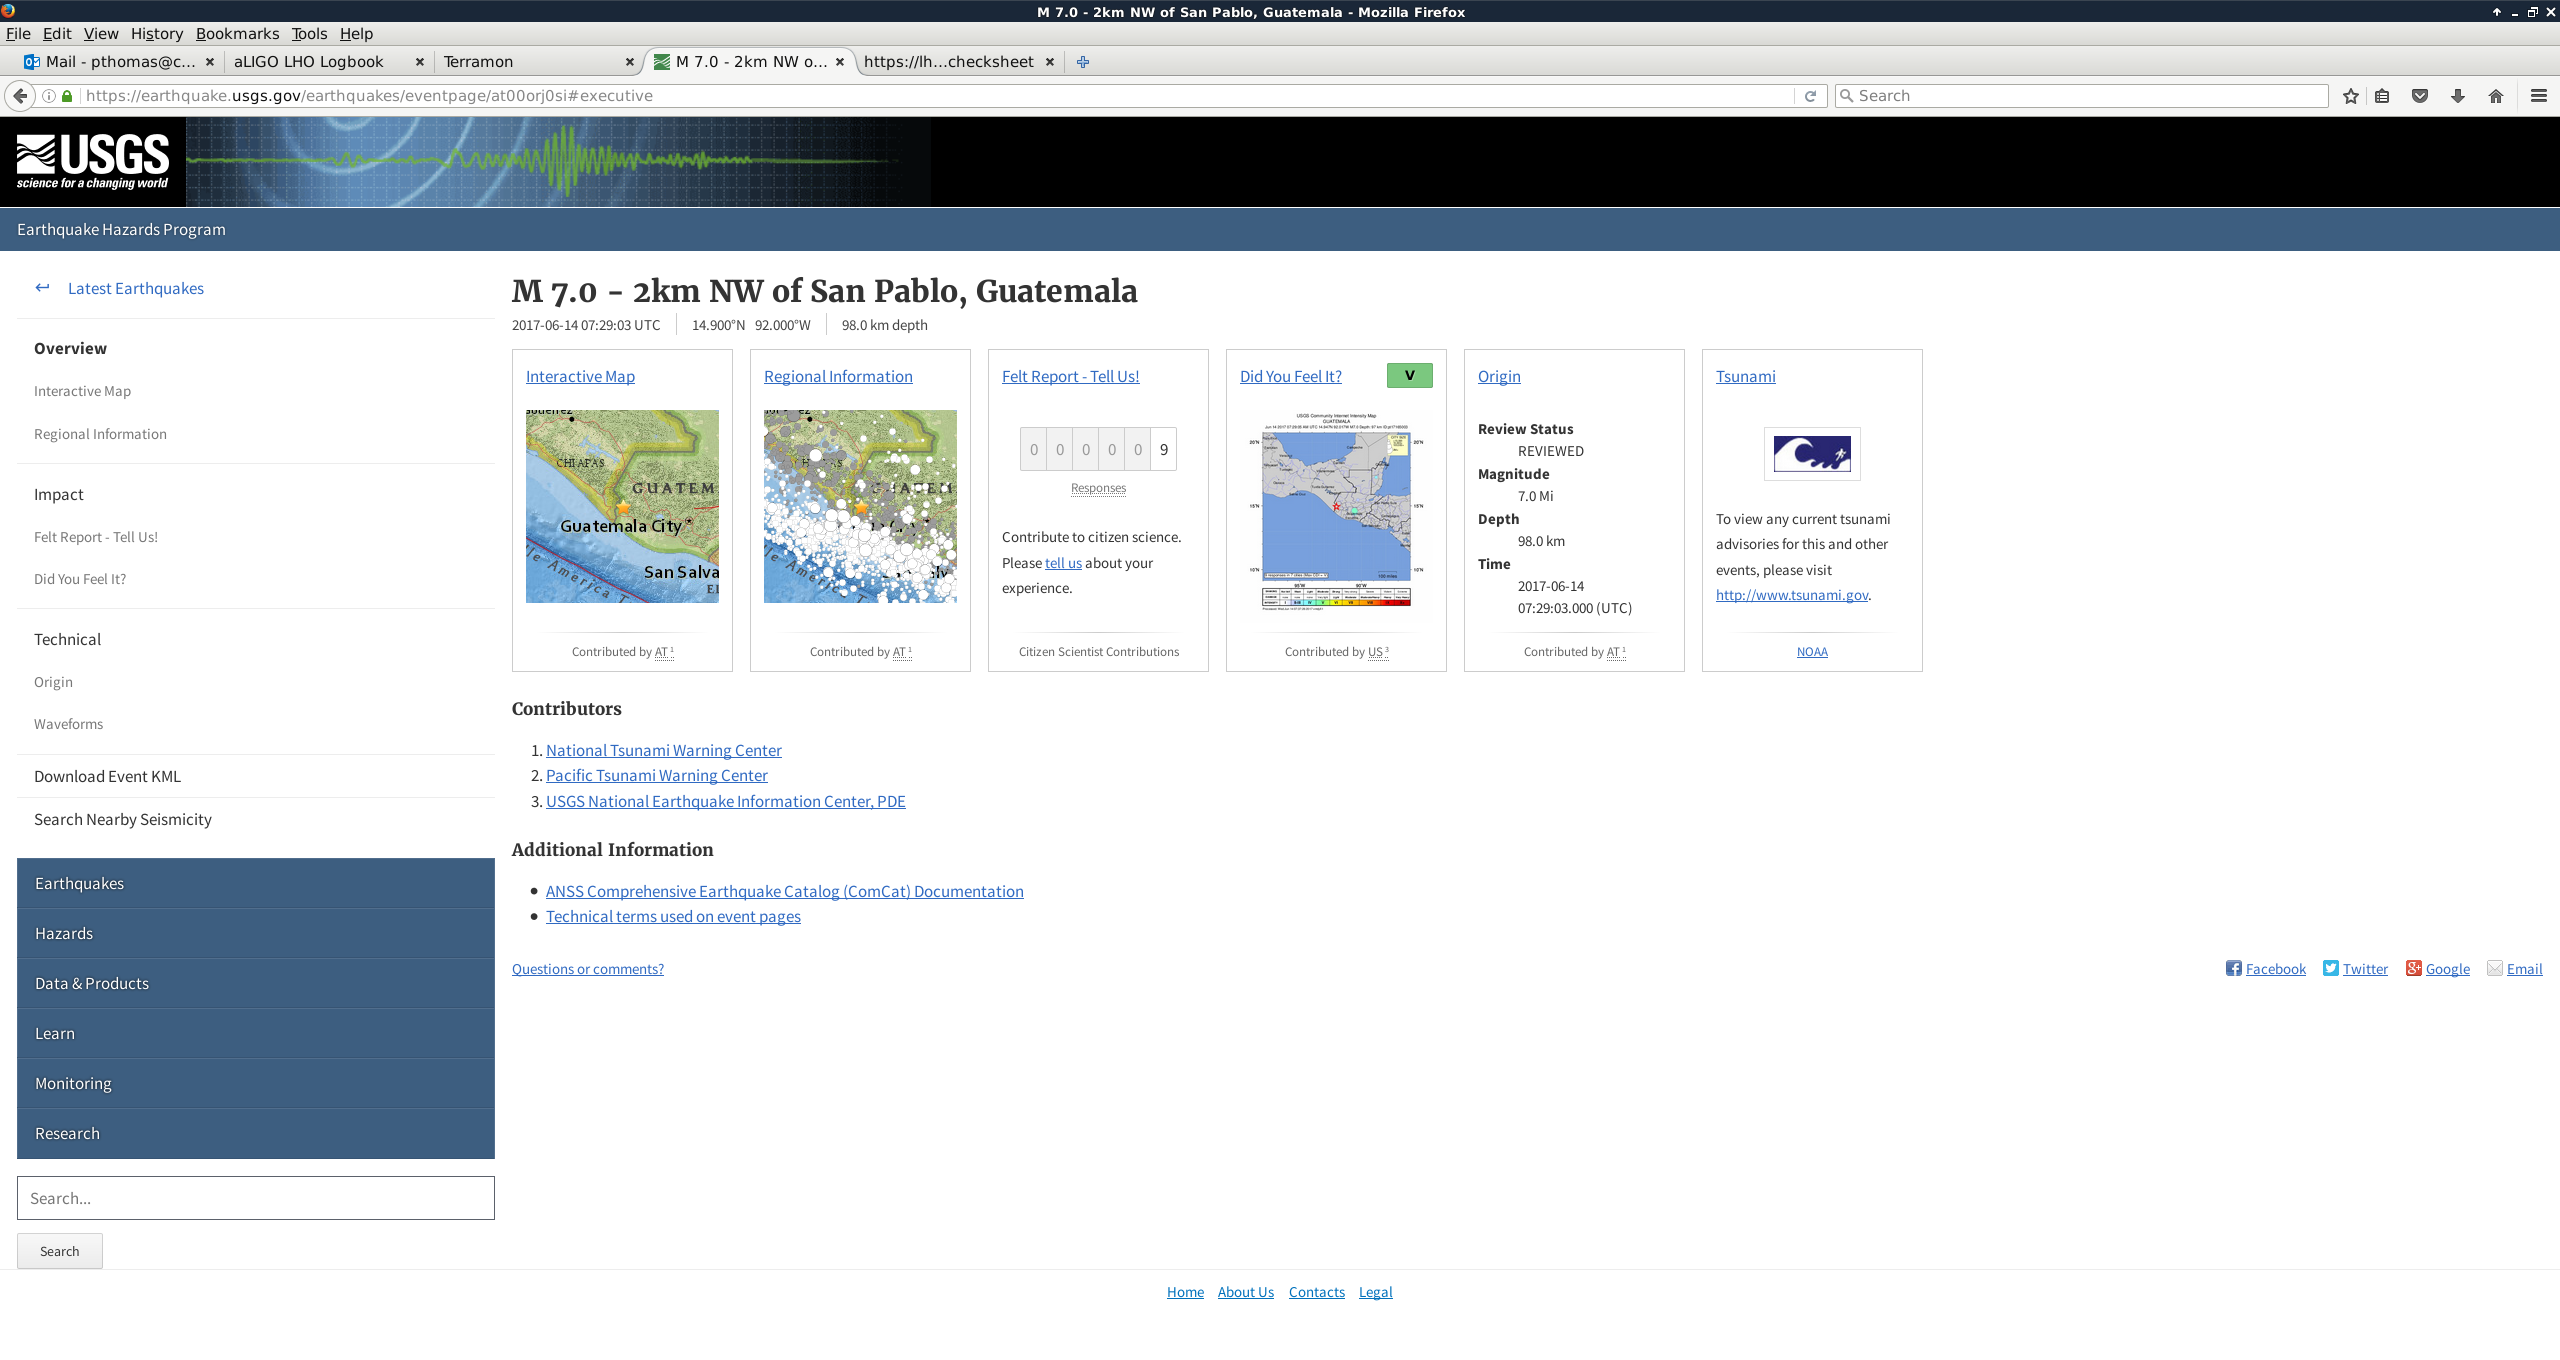
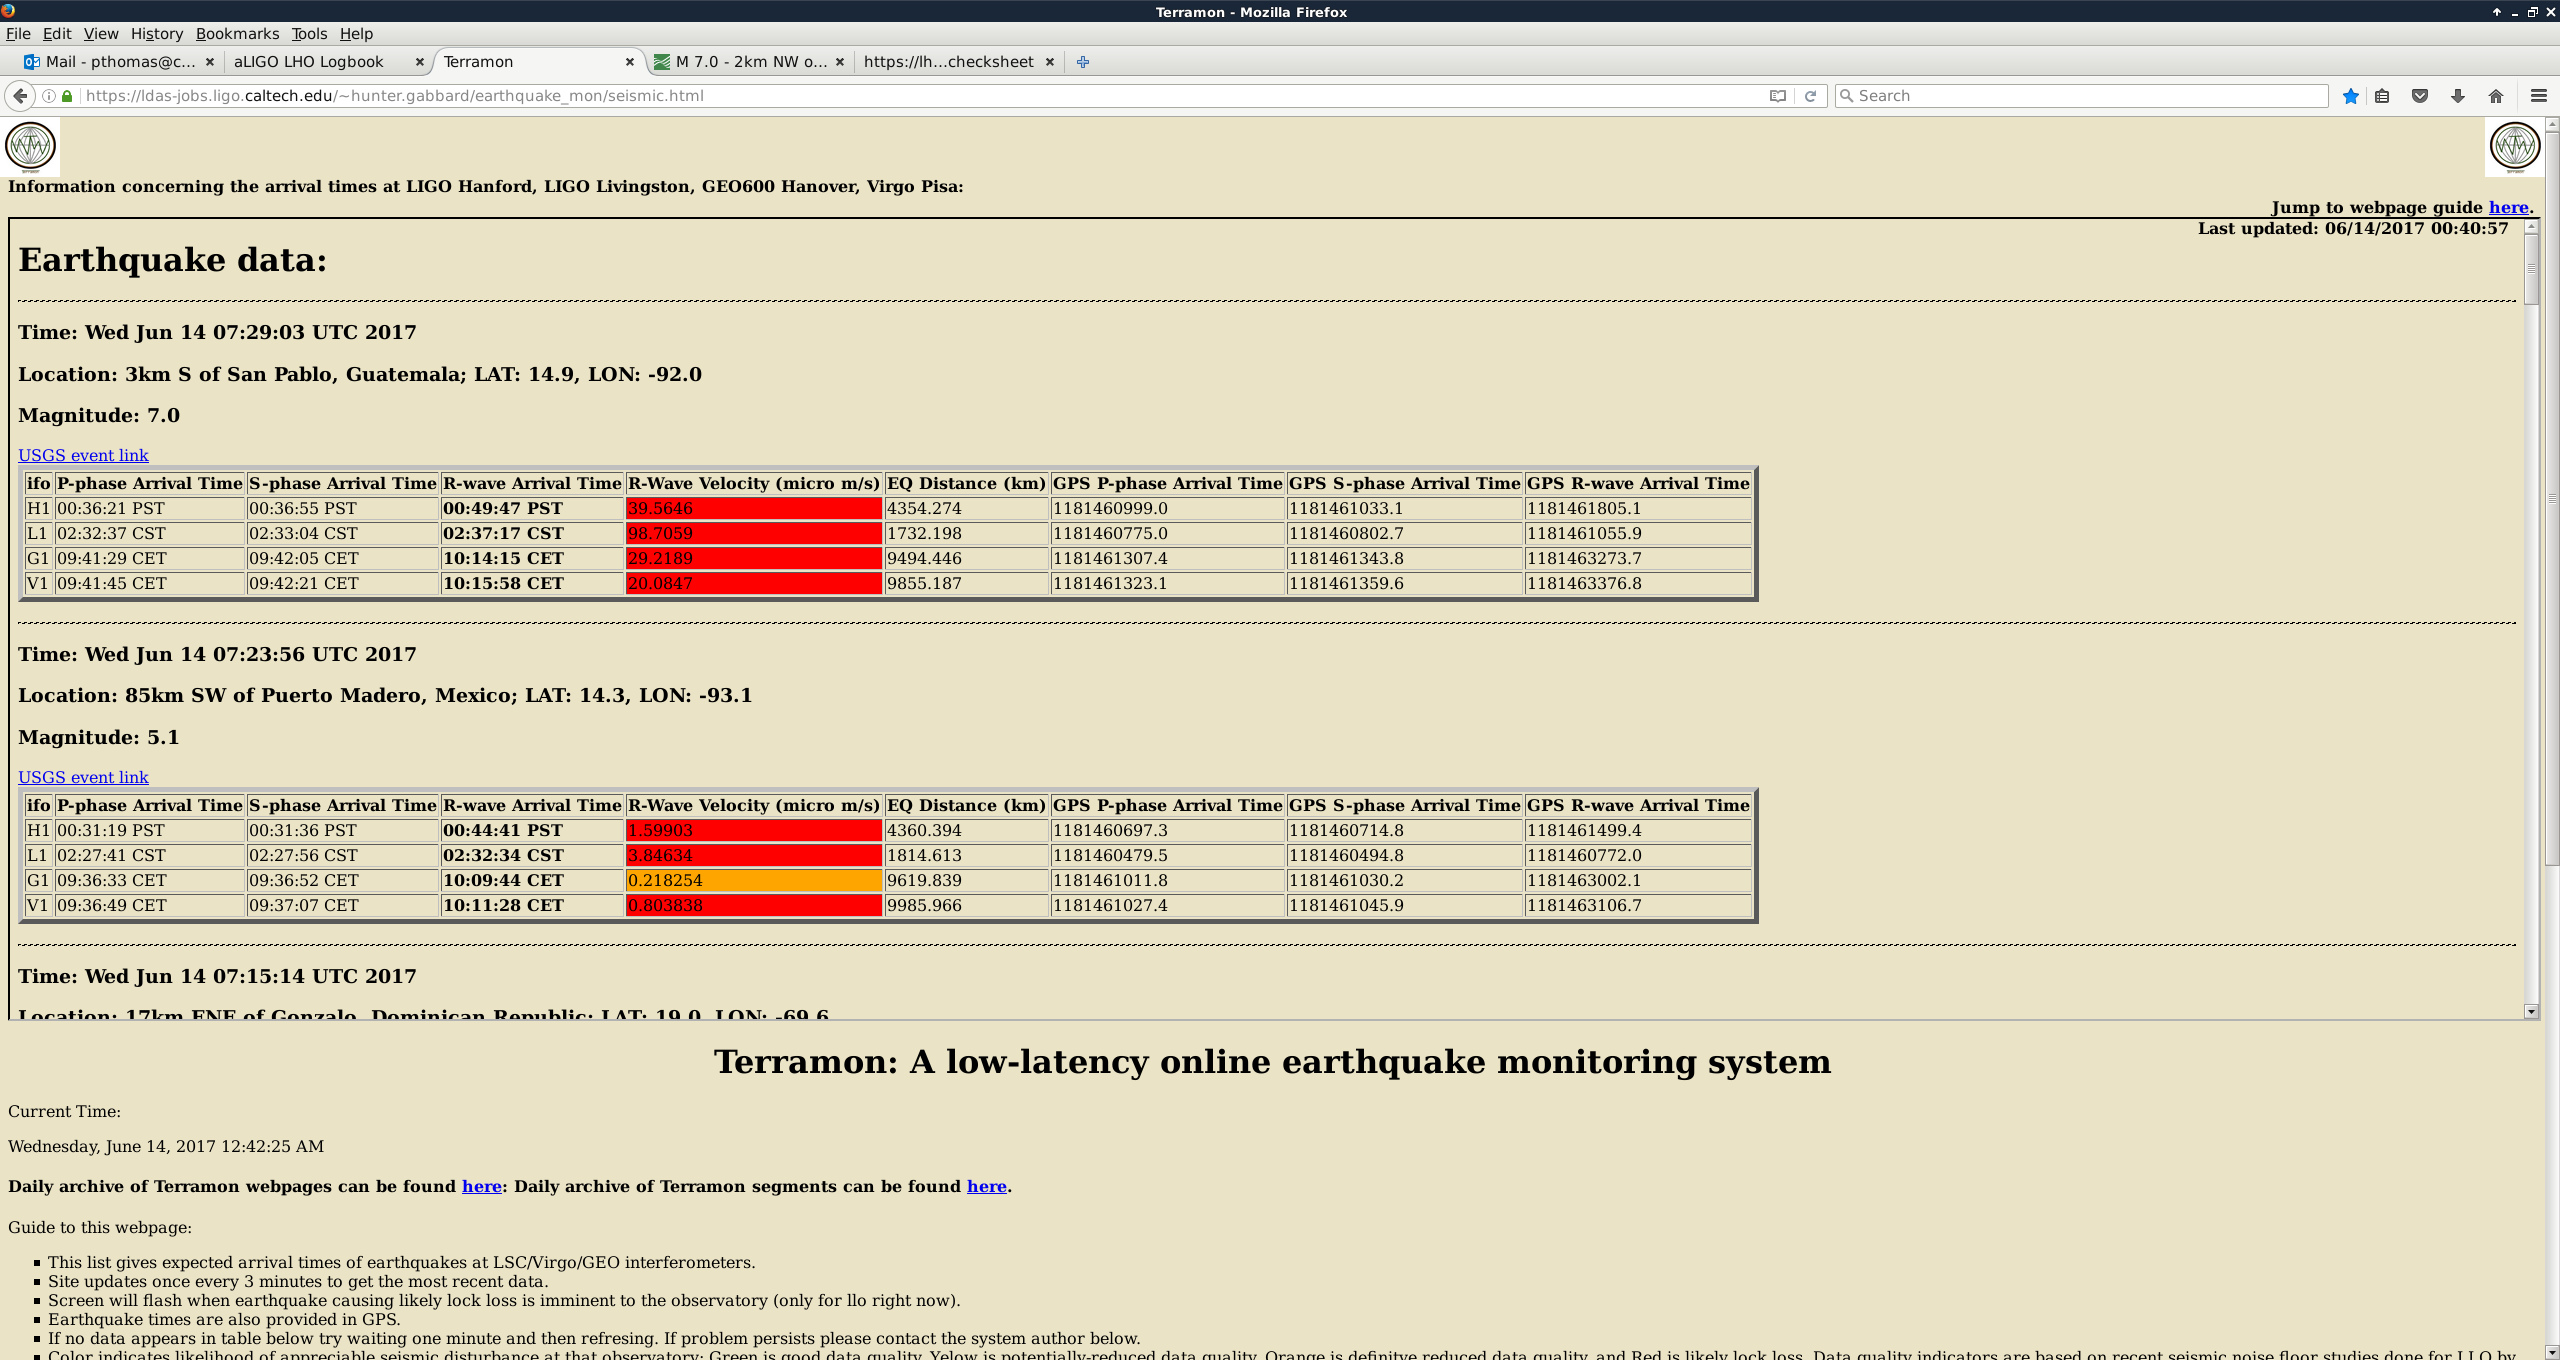
Lock loss at 7:06 UTC.

tconvert on GPS time for Seismon gives Jun 14 2017 06:38:54 UTC for time of earthquake and Jun 14 2017 07:15:03 UTC for arrival of R-20 Wave.

Seismon and USGS/Terramon do not exactly agree.
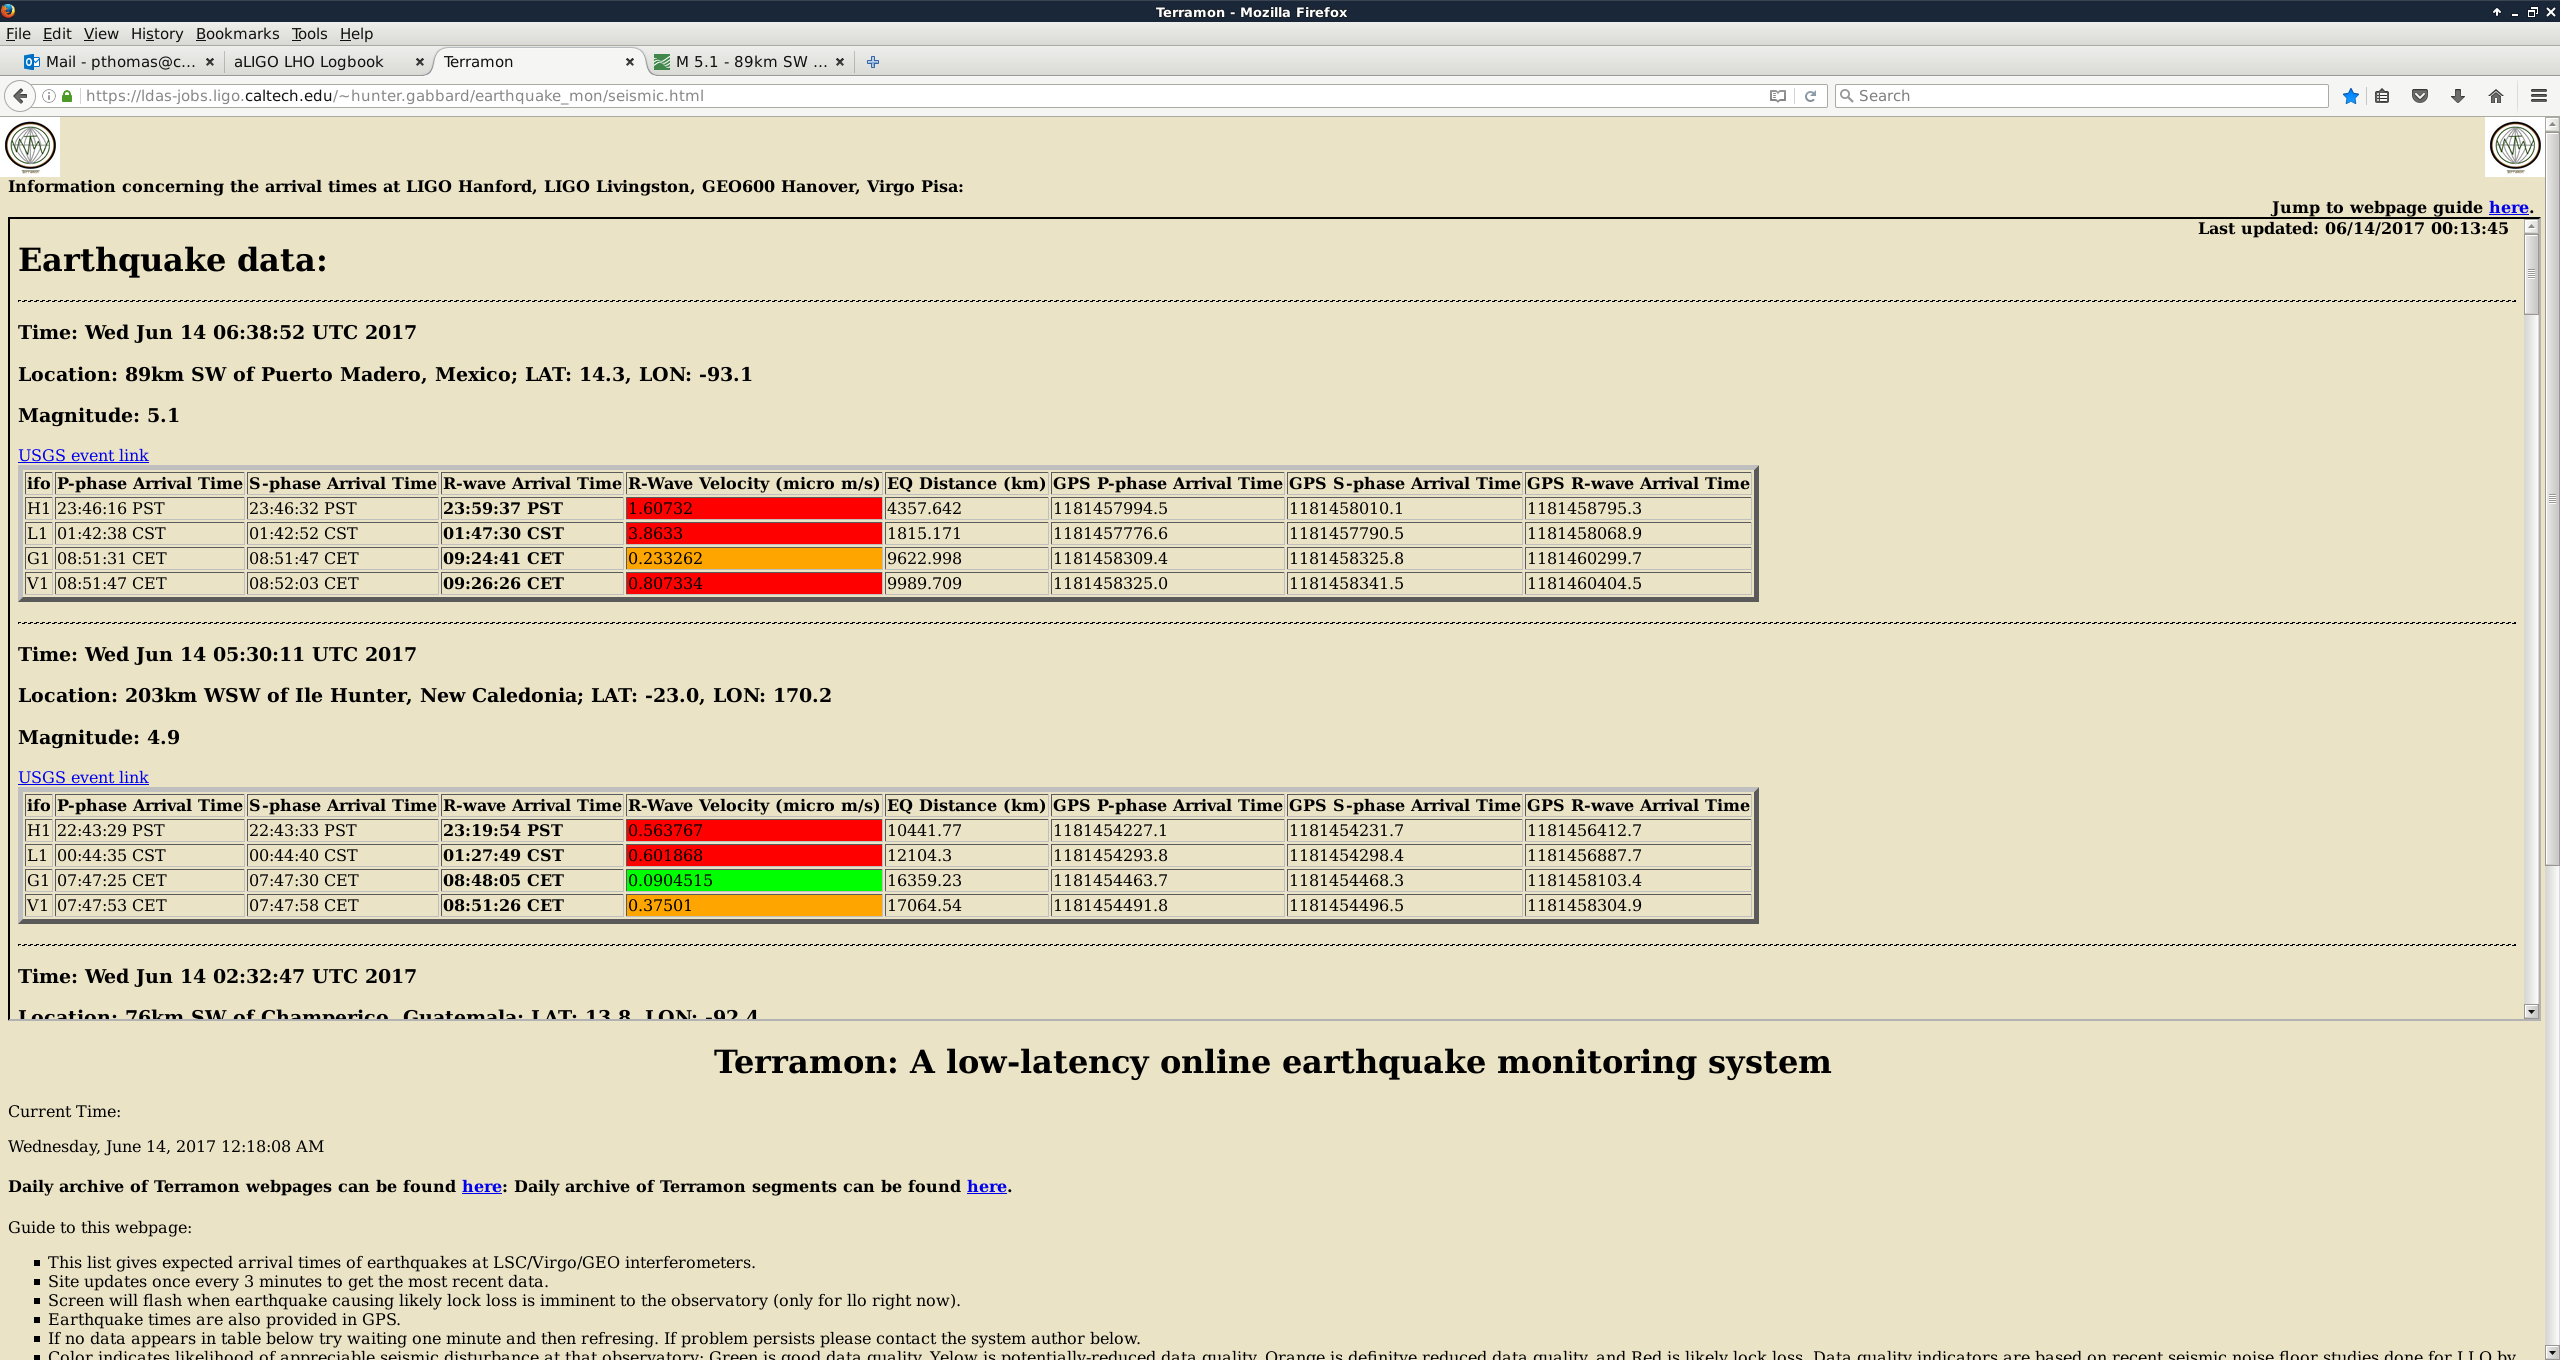
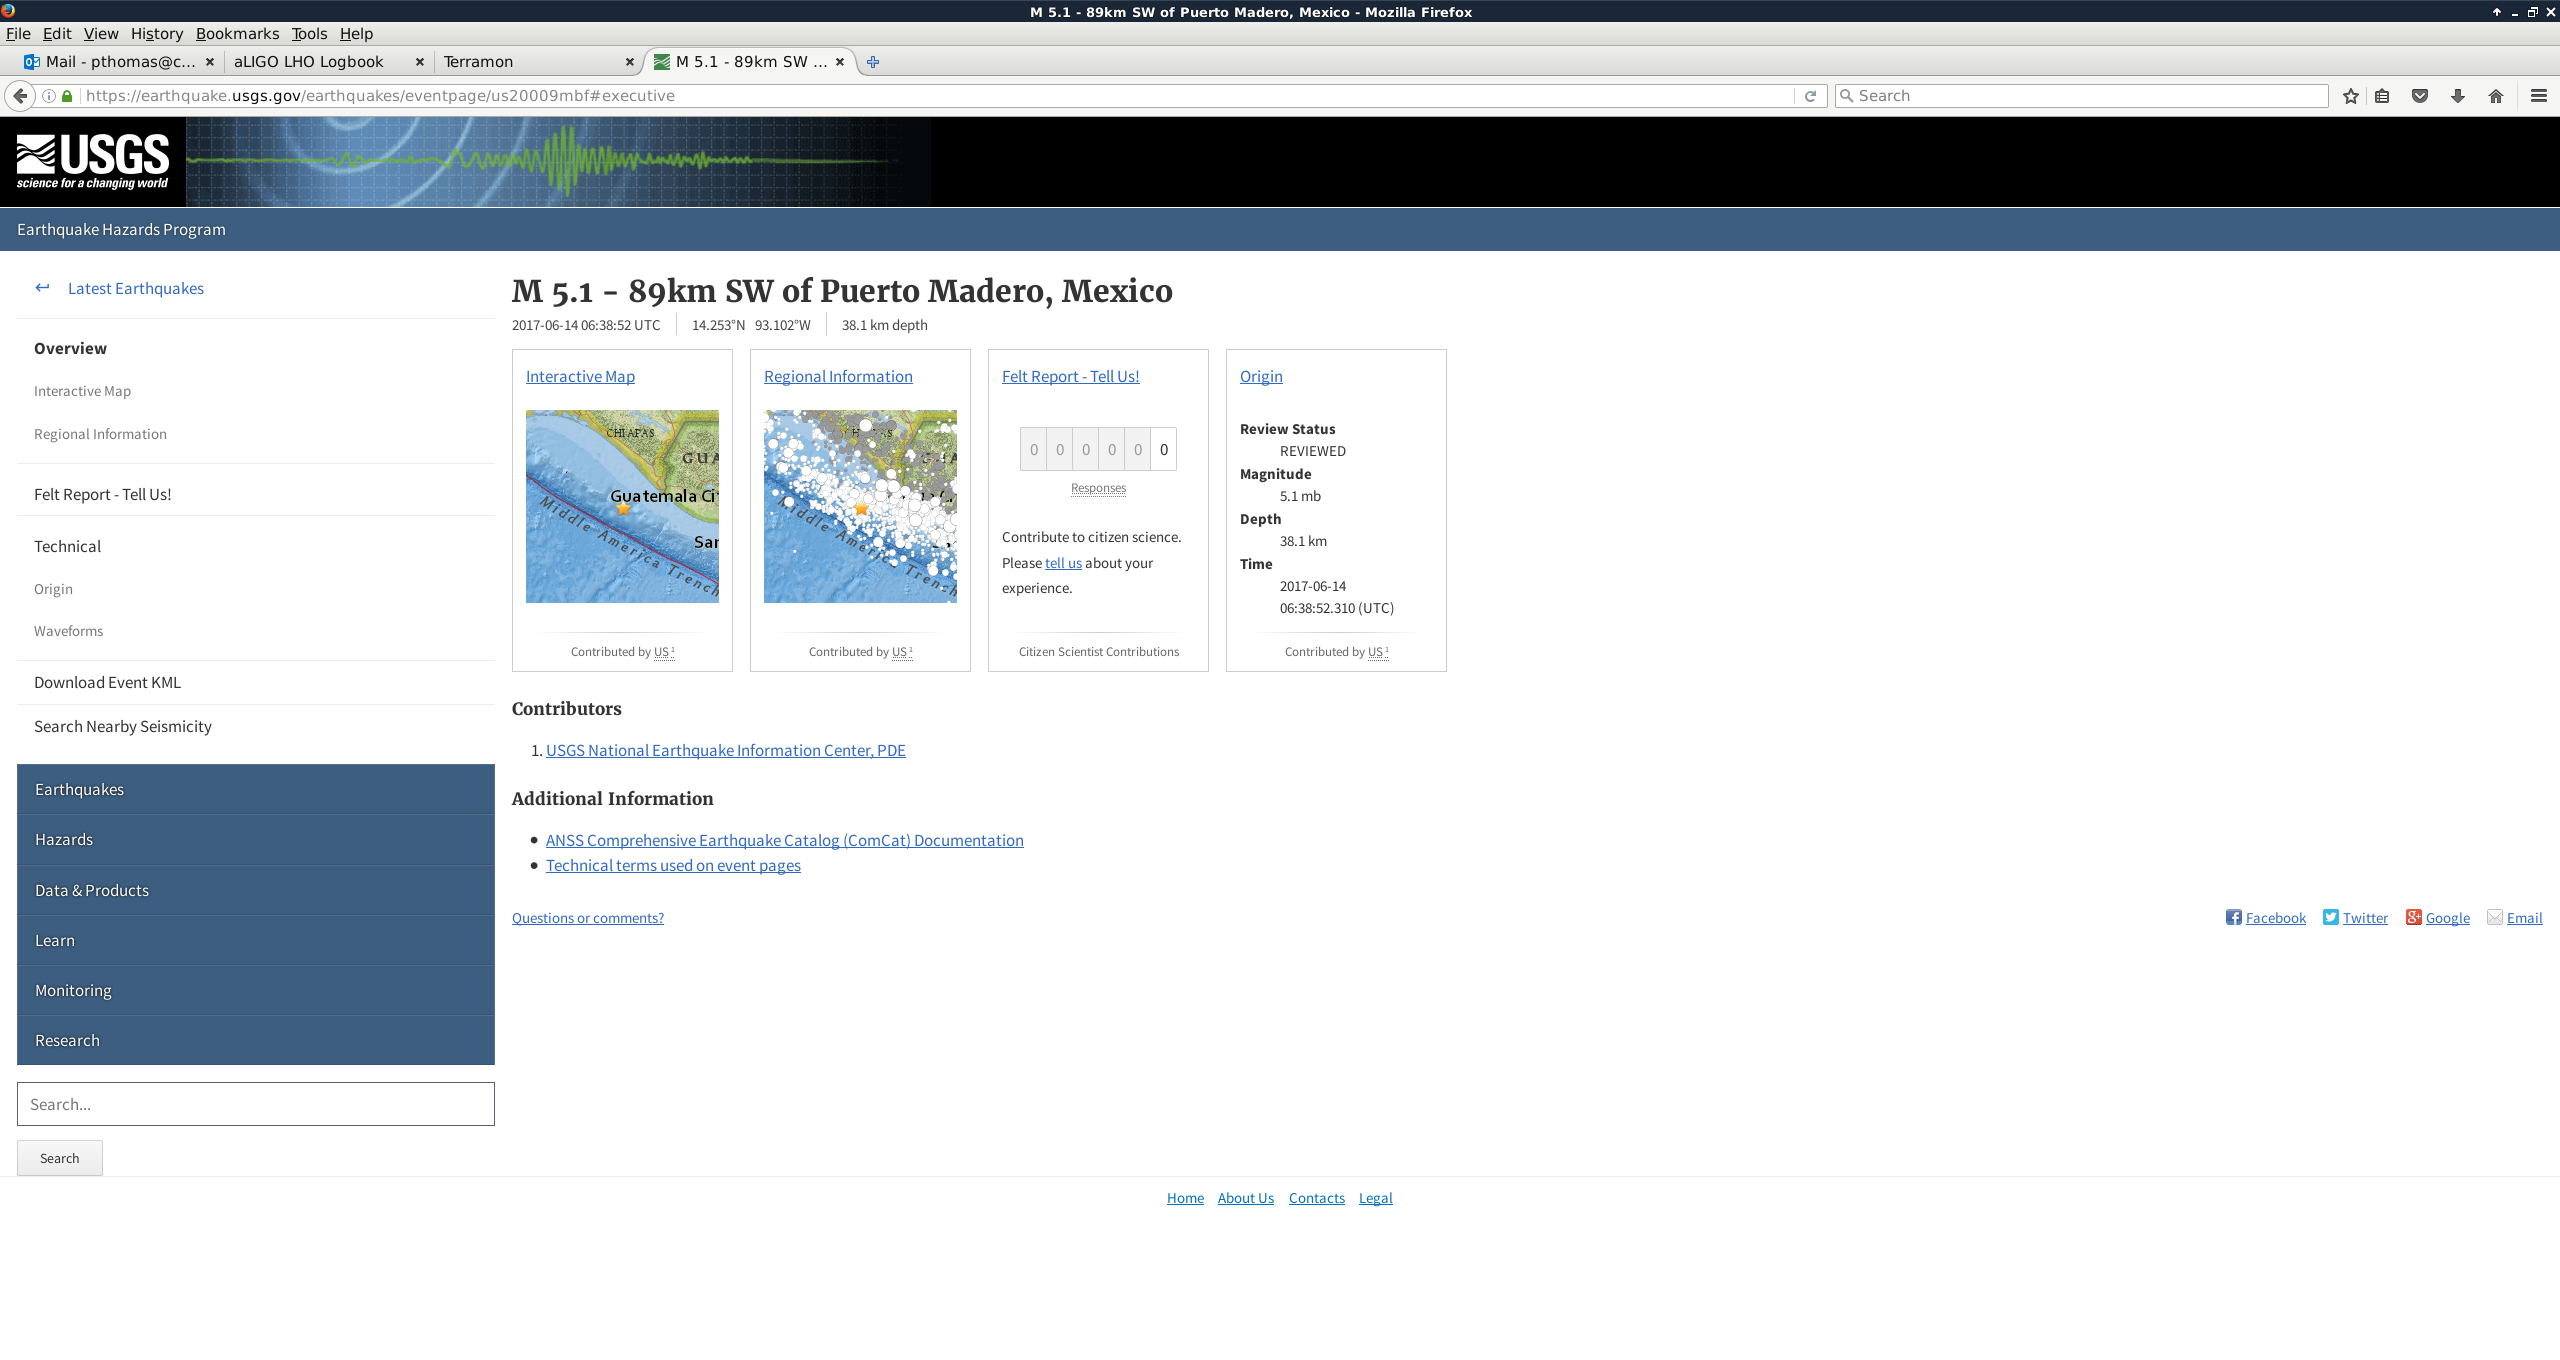

Verbal alarms just announced an incoming earthquake at 07:32 UTC. Seismon has updated to the attached screenshot.

07:38 UTC USGS has reported it
07:39 UTC Spike seen on BLRMS
07:45 UTC Watchdogs starting to trip
The following watchdogs tripped:
ISI ETMX stage 2
ISI ITMY stage 2
ISI ITMY stage 1
ISI ETMX stage 1
SUS TMSX
ISI ETMY stage 1
ISI ETMY stage 2
TITLE: 06/14 Eve Shift: 23:00-07:00 UTC (16:00-00:00 PST), all times posted in UTC
STATE of H1: Observing at 62Mpc
INCOMING OPERATOR: Patrick
SHIFT SUMMARY: Commissioning activities started the shift with Robert doing some baffle testing, then at 03:13 we went back to Observing and have been there since.
LOG:
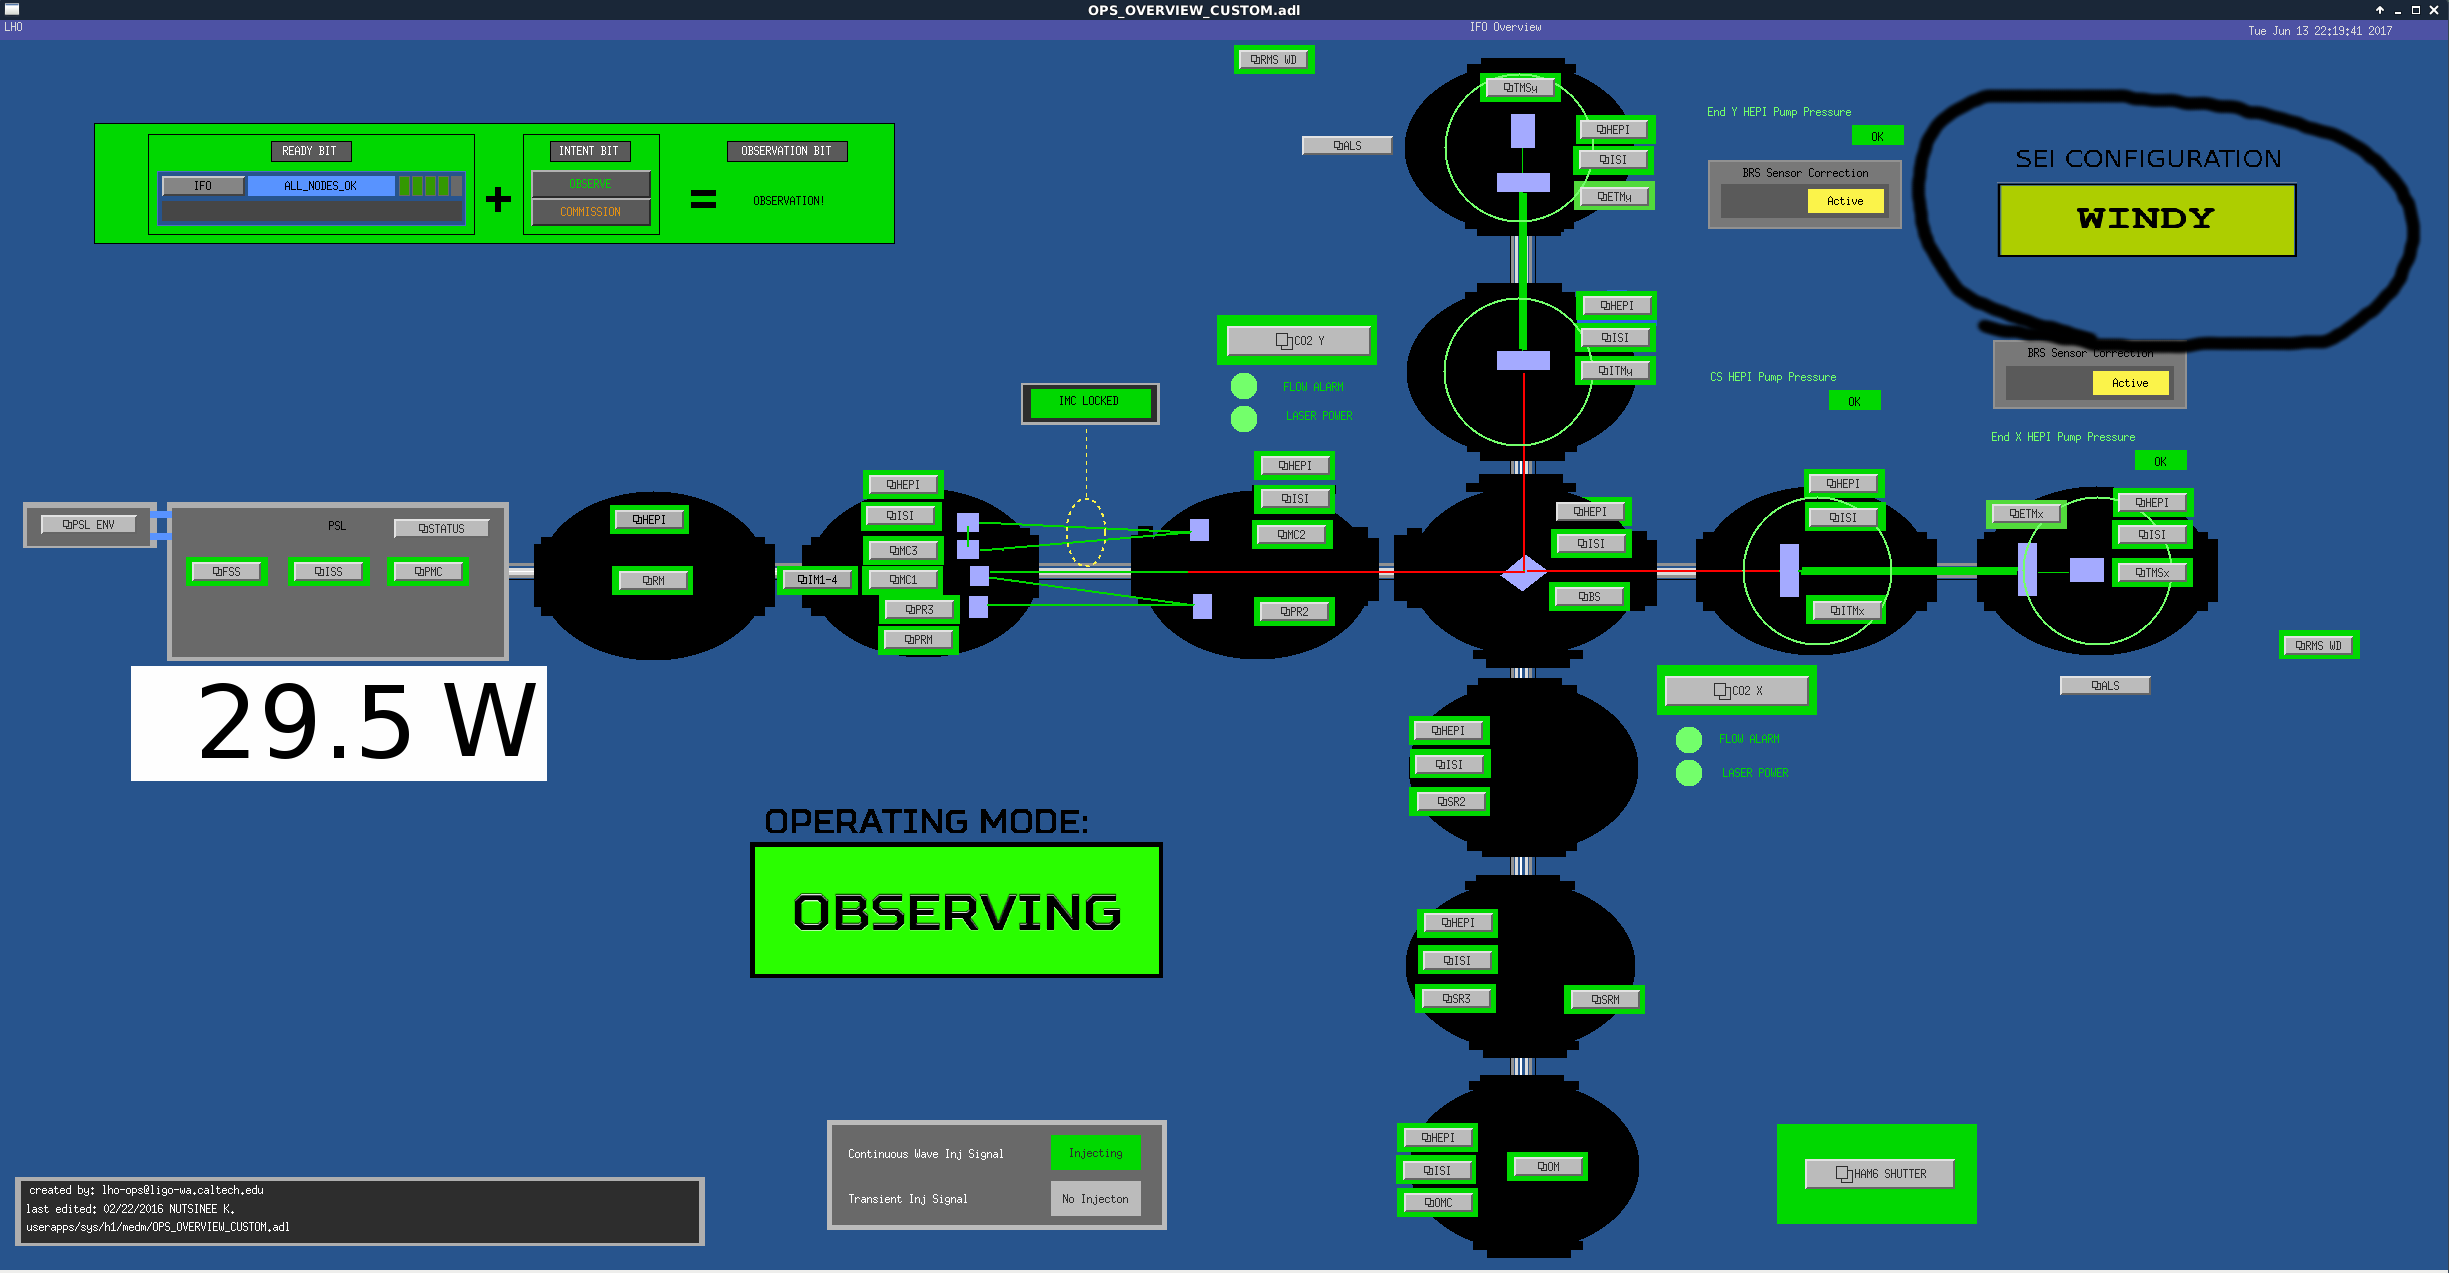
I added some SEI configuration images to the OPS_OVERVIEW. Jim and I were talking the other day and thought that this would be useful. It will look at SEI_CONF Guardian node and display the image accordingly. It currently does not show all the states that SEI_CONF can go to, only the "popular" ones for now.
Robert swept the LVEA and gave me the all good to go back into observing. We are Observing at 61Mpc on a 4hr lock.
TITLE: 06/13 Eve Shift: 23:00-07:00 UTC (16:00-00:00 PST), all times posted in UTC
STATE of H1: Commissioning
OUTGOING OPERATOR: Travis
CURRENT ENVIRONMENT:
Wind: 22mph Gusts, 17mph 5min avg
Primary useism: 0.10 μm/s
Secondary useism: 0.10 μm/s
QUICK SUMMARY: Maintenance/commissioning activies are continueing. Travis got it back up as he handed it off, now I just have to watch PI modes.
TITLE: 06/13 Day Shift: 15:00-23:00 UTC (08:00-16:00 PST), all times posted in UTC
STATE of H1: Commissioning
INCOMING OPERATOR: TJ
SHIFT SUMMARY: Maintenance until ~21:00 UTC, then were able to lock to NLN without issue. We are now in Commissioning mode for measurements by Robert and Sheila.
LOG: See attached txt file.
WP #7037

10:30 am, local time -> As found, CP3's dewar vacuum jacket measured 230 microns -> Began pumping using two-stage scroll pump with energize-to-open isolation valve

Noon, local time -> 140 microns
Checked pressure this morning (16:24 UTC/9:24 PDT), and is now sitting at 46 microns.
WP 7011
Cabling for the installation of two PSL GigE cameras were pulled and terminated. Cables are connected to a patch panel on SUS-R1, ports 11 & 12. Connection to the network switch in the CER still needs to be made. Cables were not pulled into the PSL enclosure.
A EL3104 analog input Beckhoff terminal was replaced from EtherCAT End Station Chassis 3. Alog 36571 reported CH3 & CH4 on terminal 7 showing an offset. Used a voltage calibrator to verify offset was from EL3104 terminal and not upstream.
Updated FRS Ticket 6024. Once a few days have past, we'll review the data to confirm success and the problem is fixed.
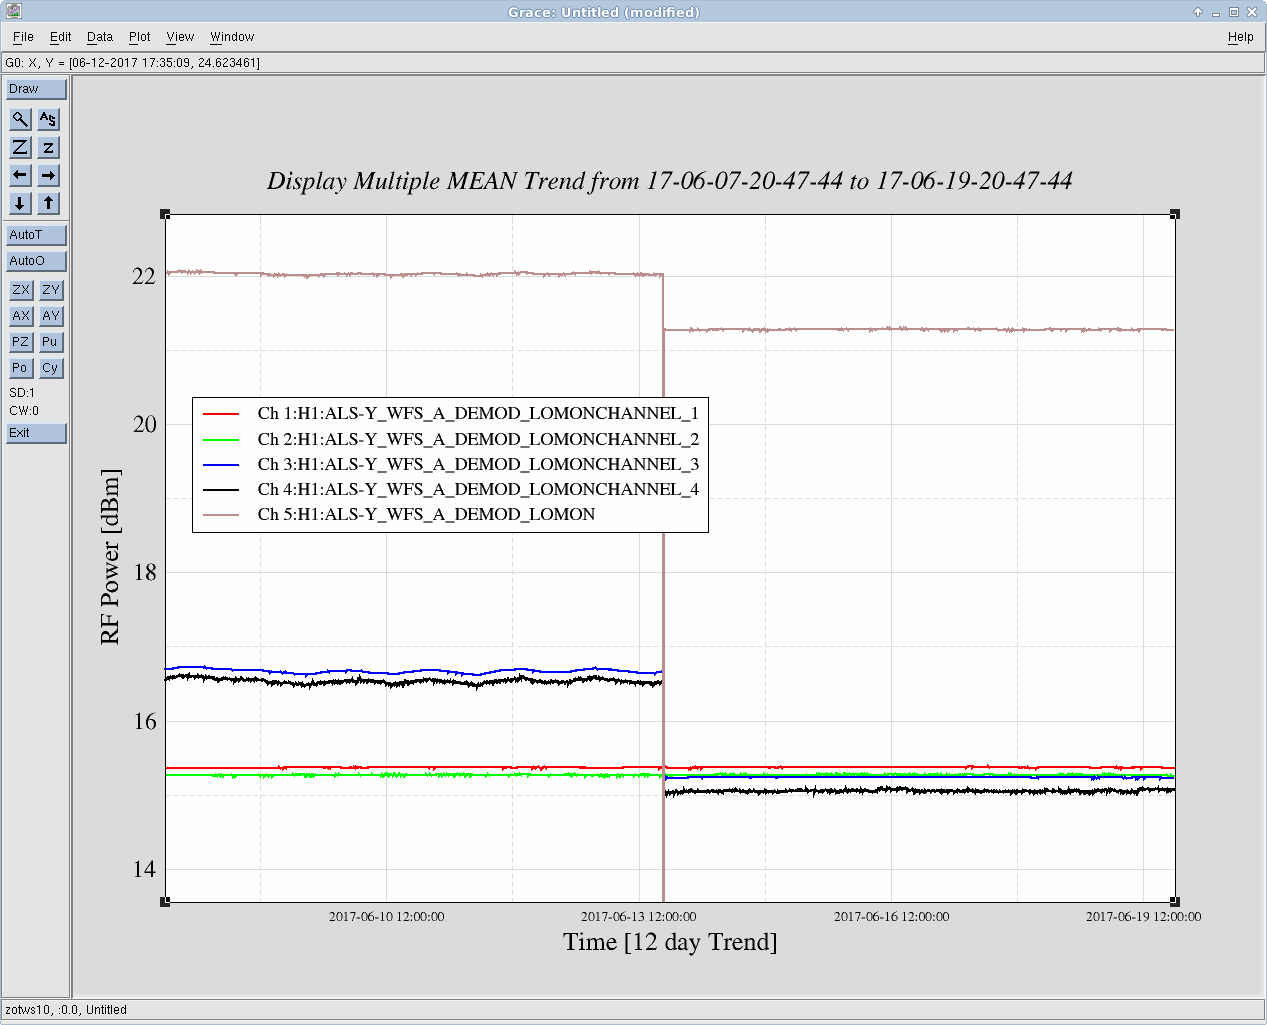
Trend over the past 8 days. Nominal adjusted to 21.5 dBm.
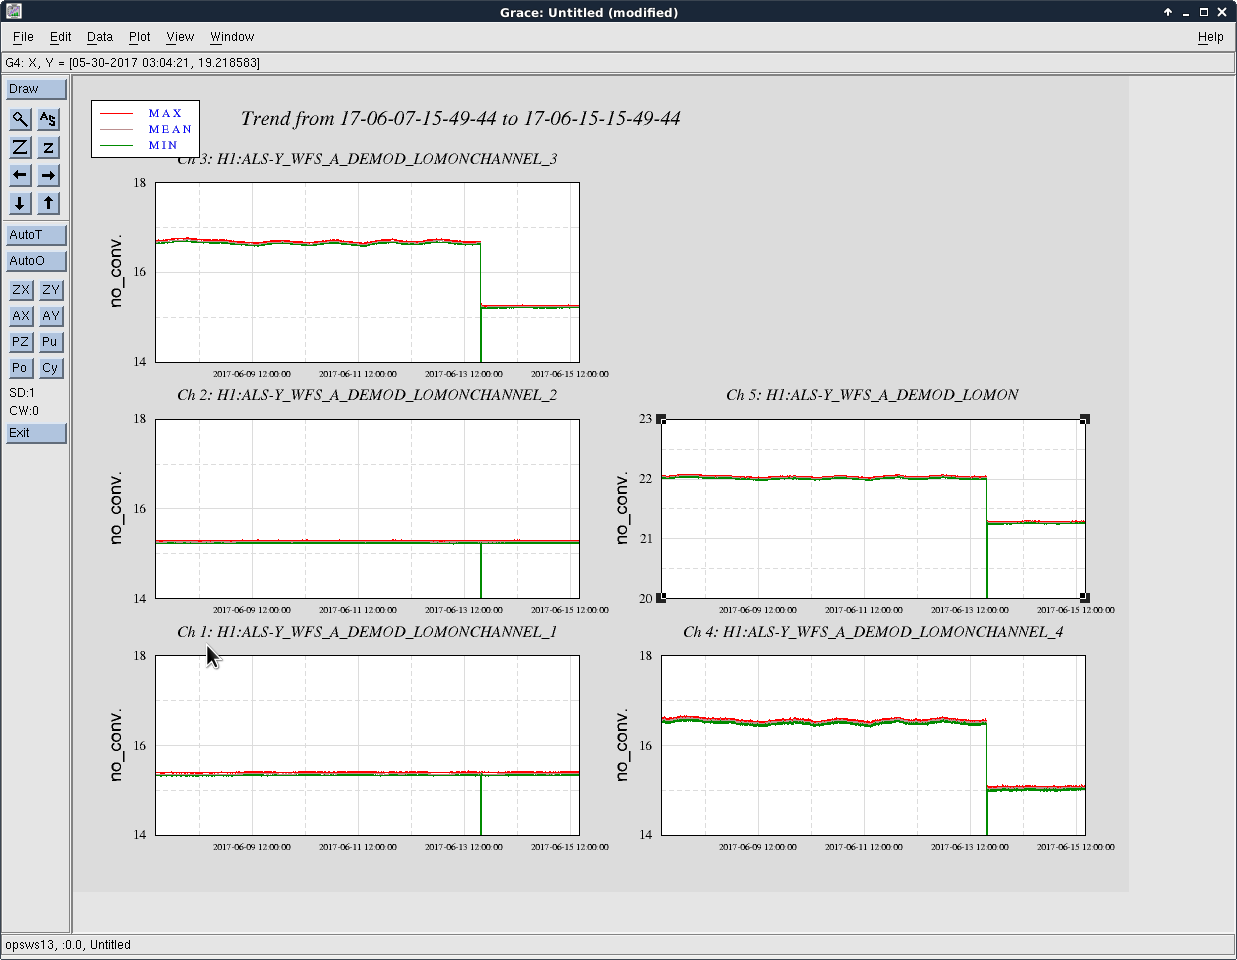
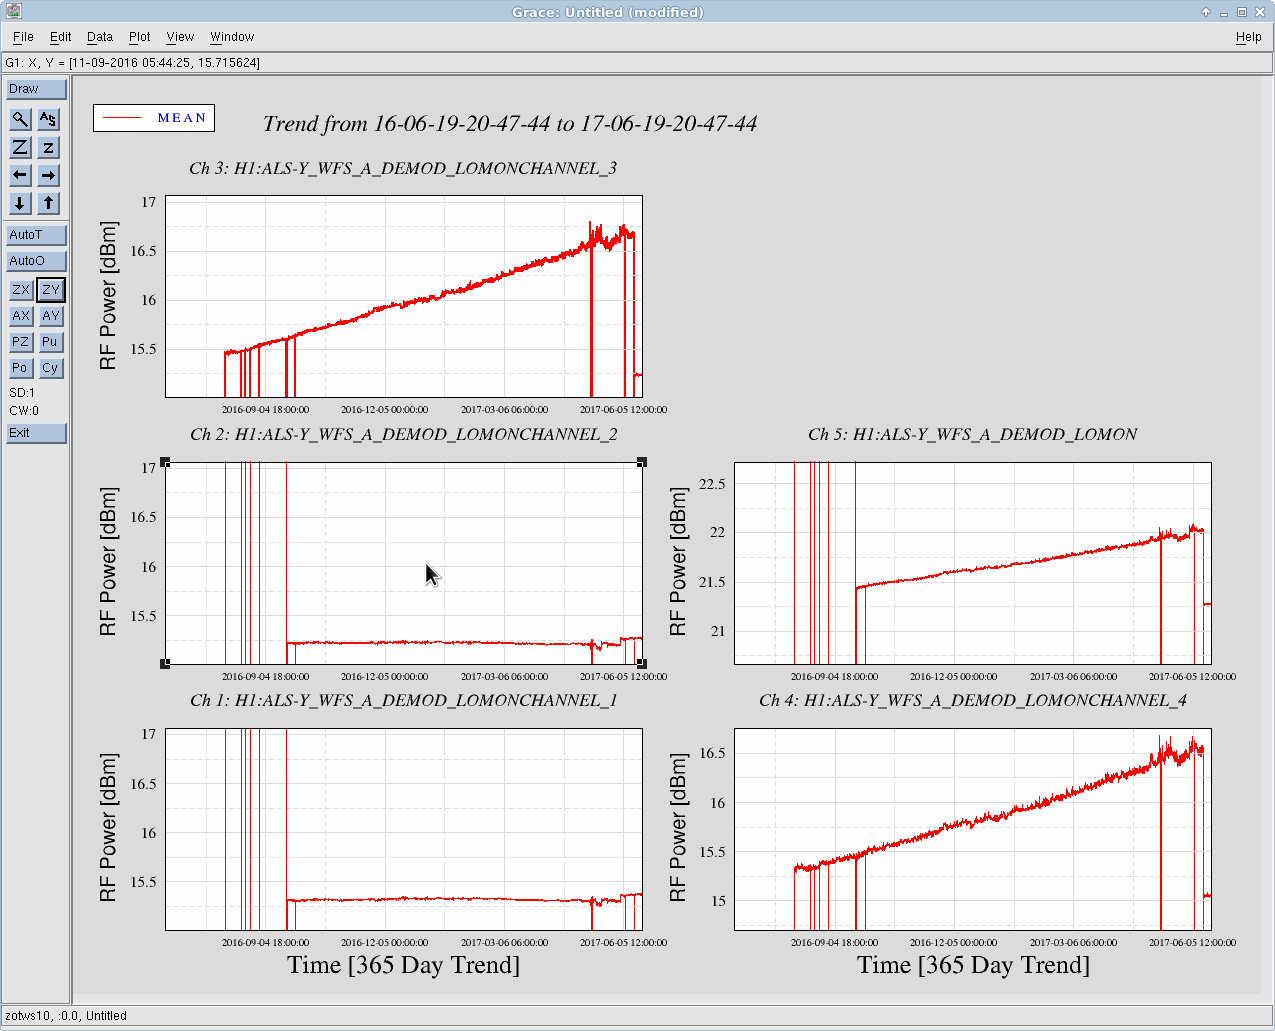
J. Kissel
FRS Ticket 6024

I attach two trends of the past 12 days (three more than Daniel's plot above), and the past 365 days of these local oscillator read backs of the H1 ALS Y WFS A system. One can see from the 365 day trend that these ADCs would on drift at a rate of (the equivalent of) ~0.1 [dBm / month], so we're not going to be able to see if the problem is true fixed in these 6 days since the module was swapped.

So, my vote is that we close the ticket, but continue to monitor, and re-open if we find any drift in the future.
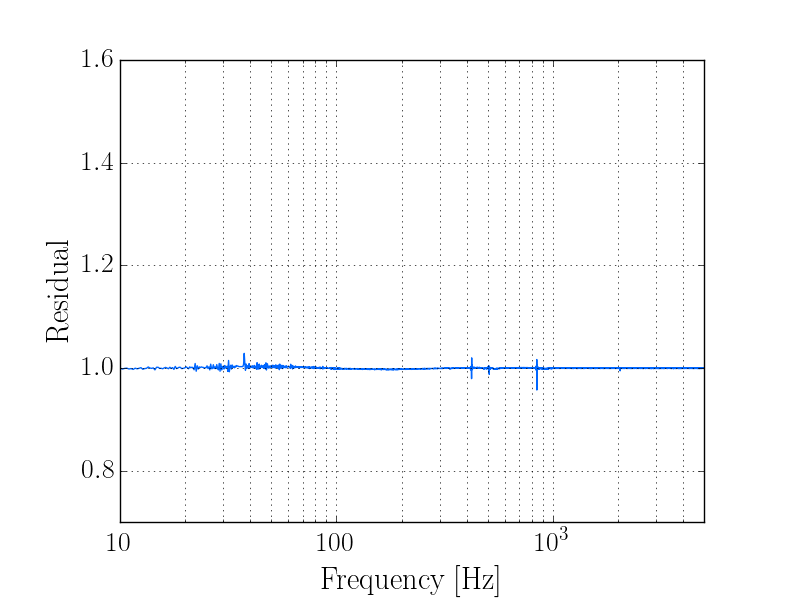
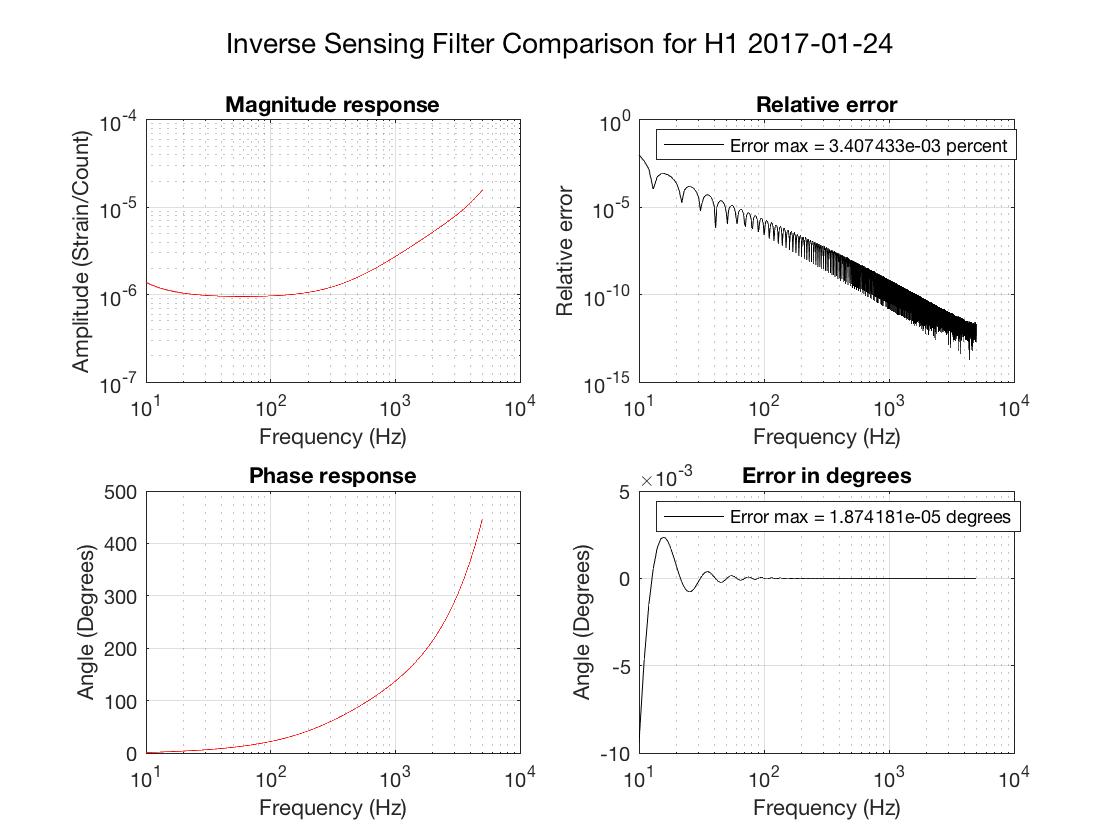
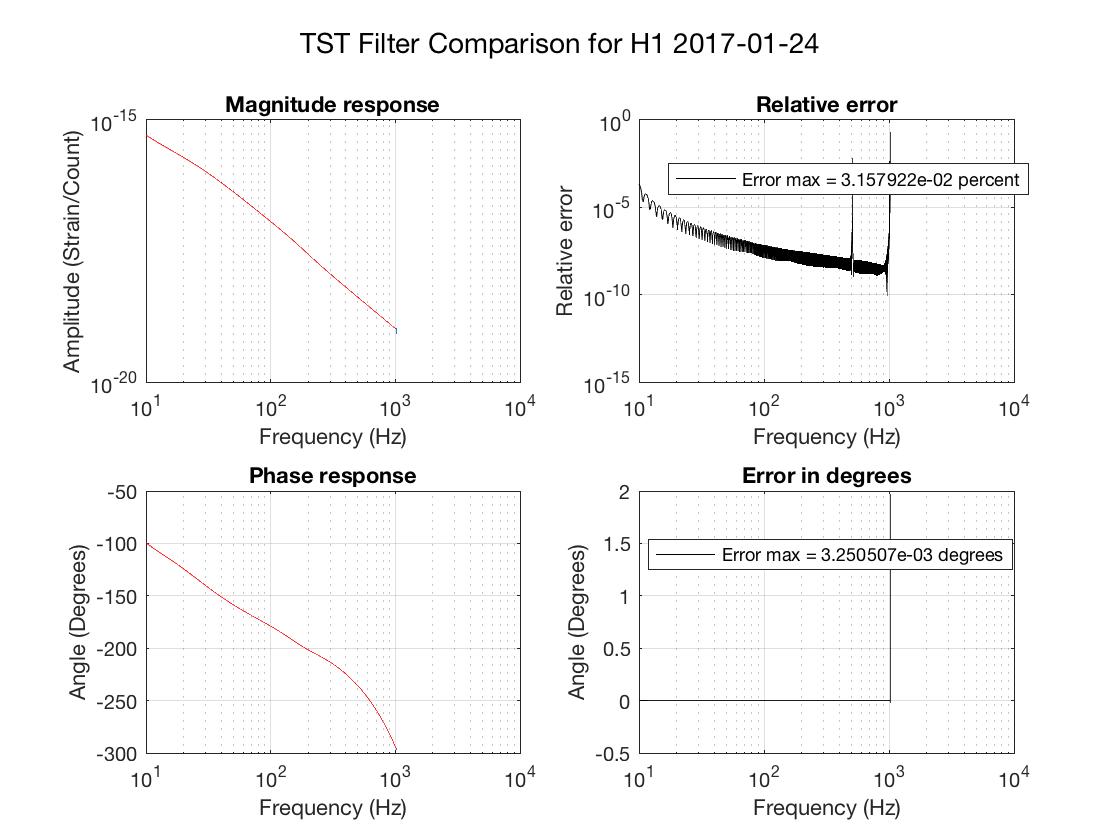
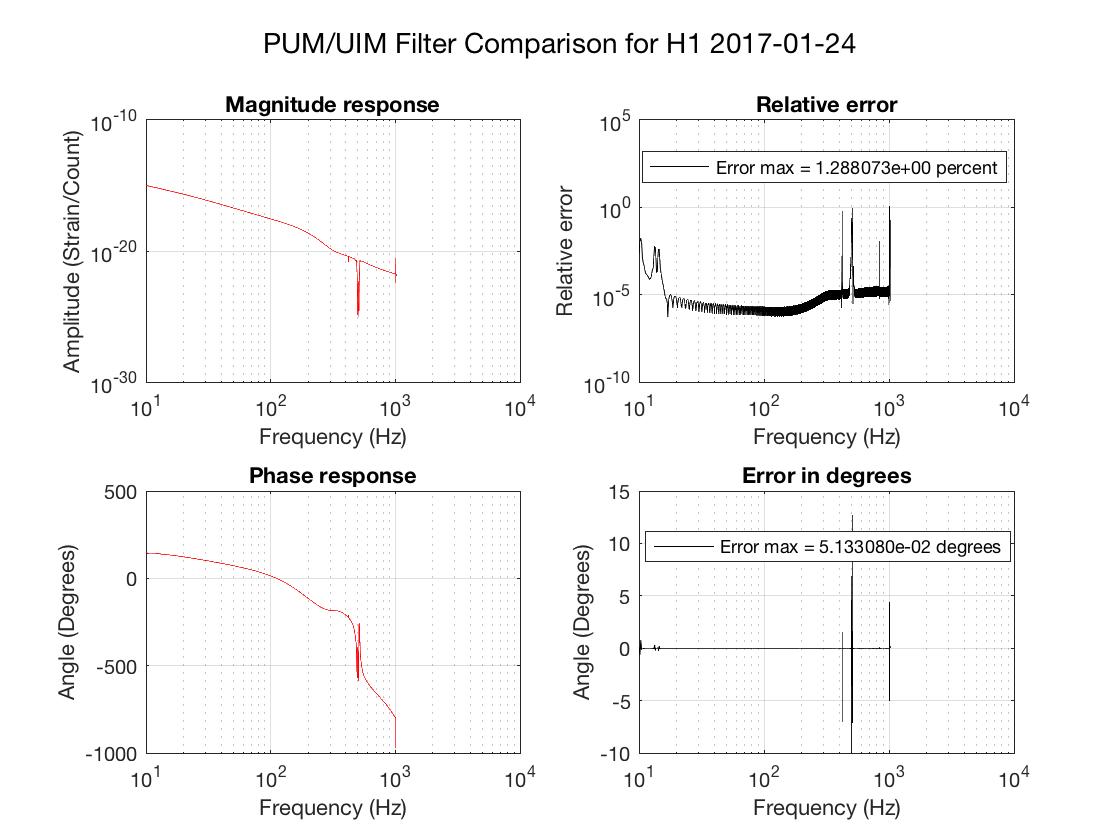
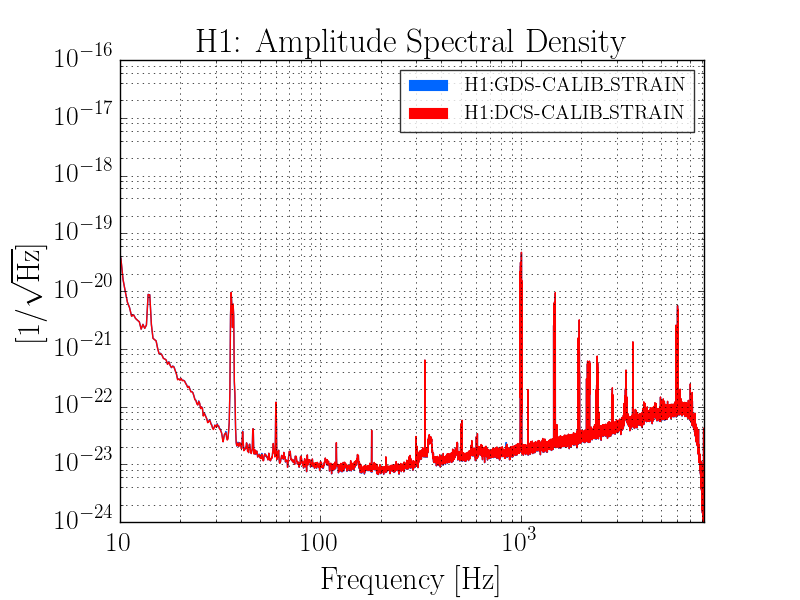
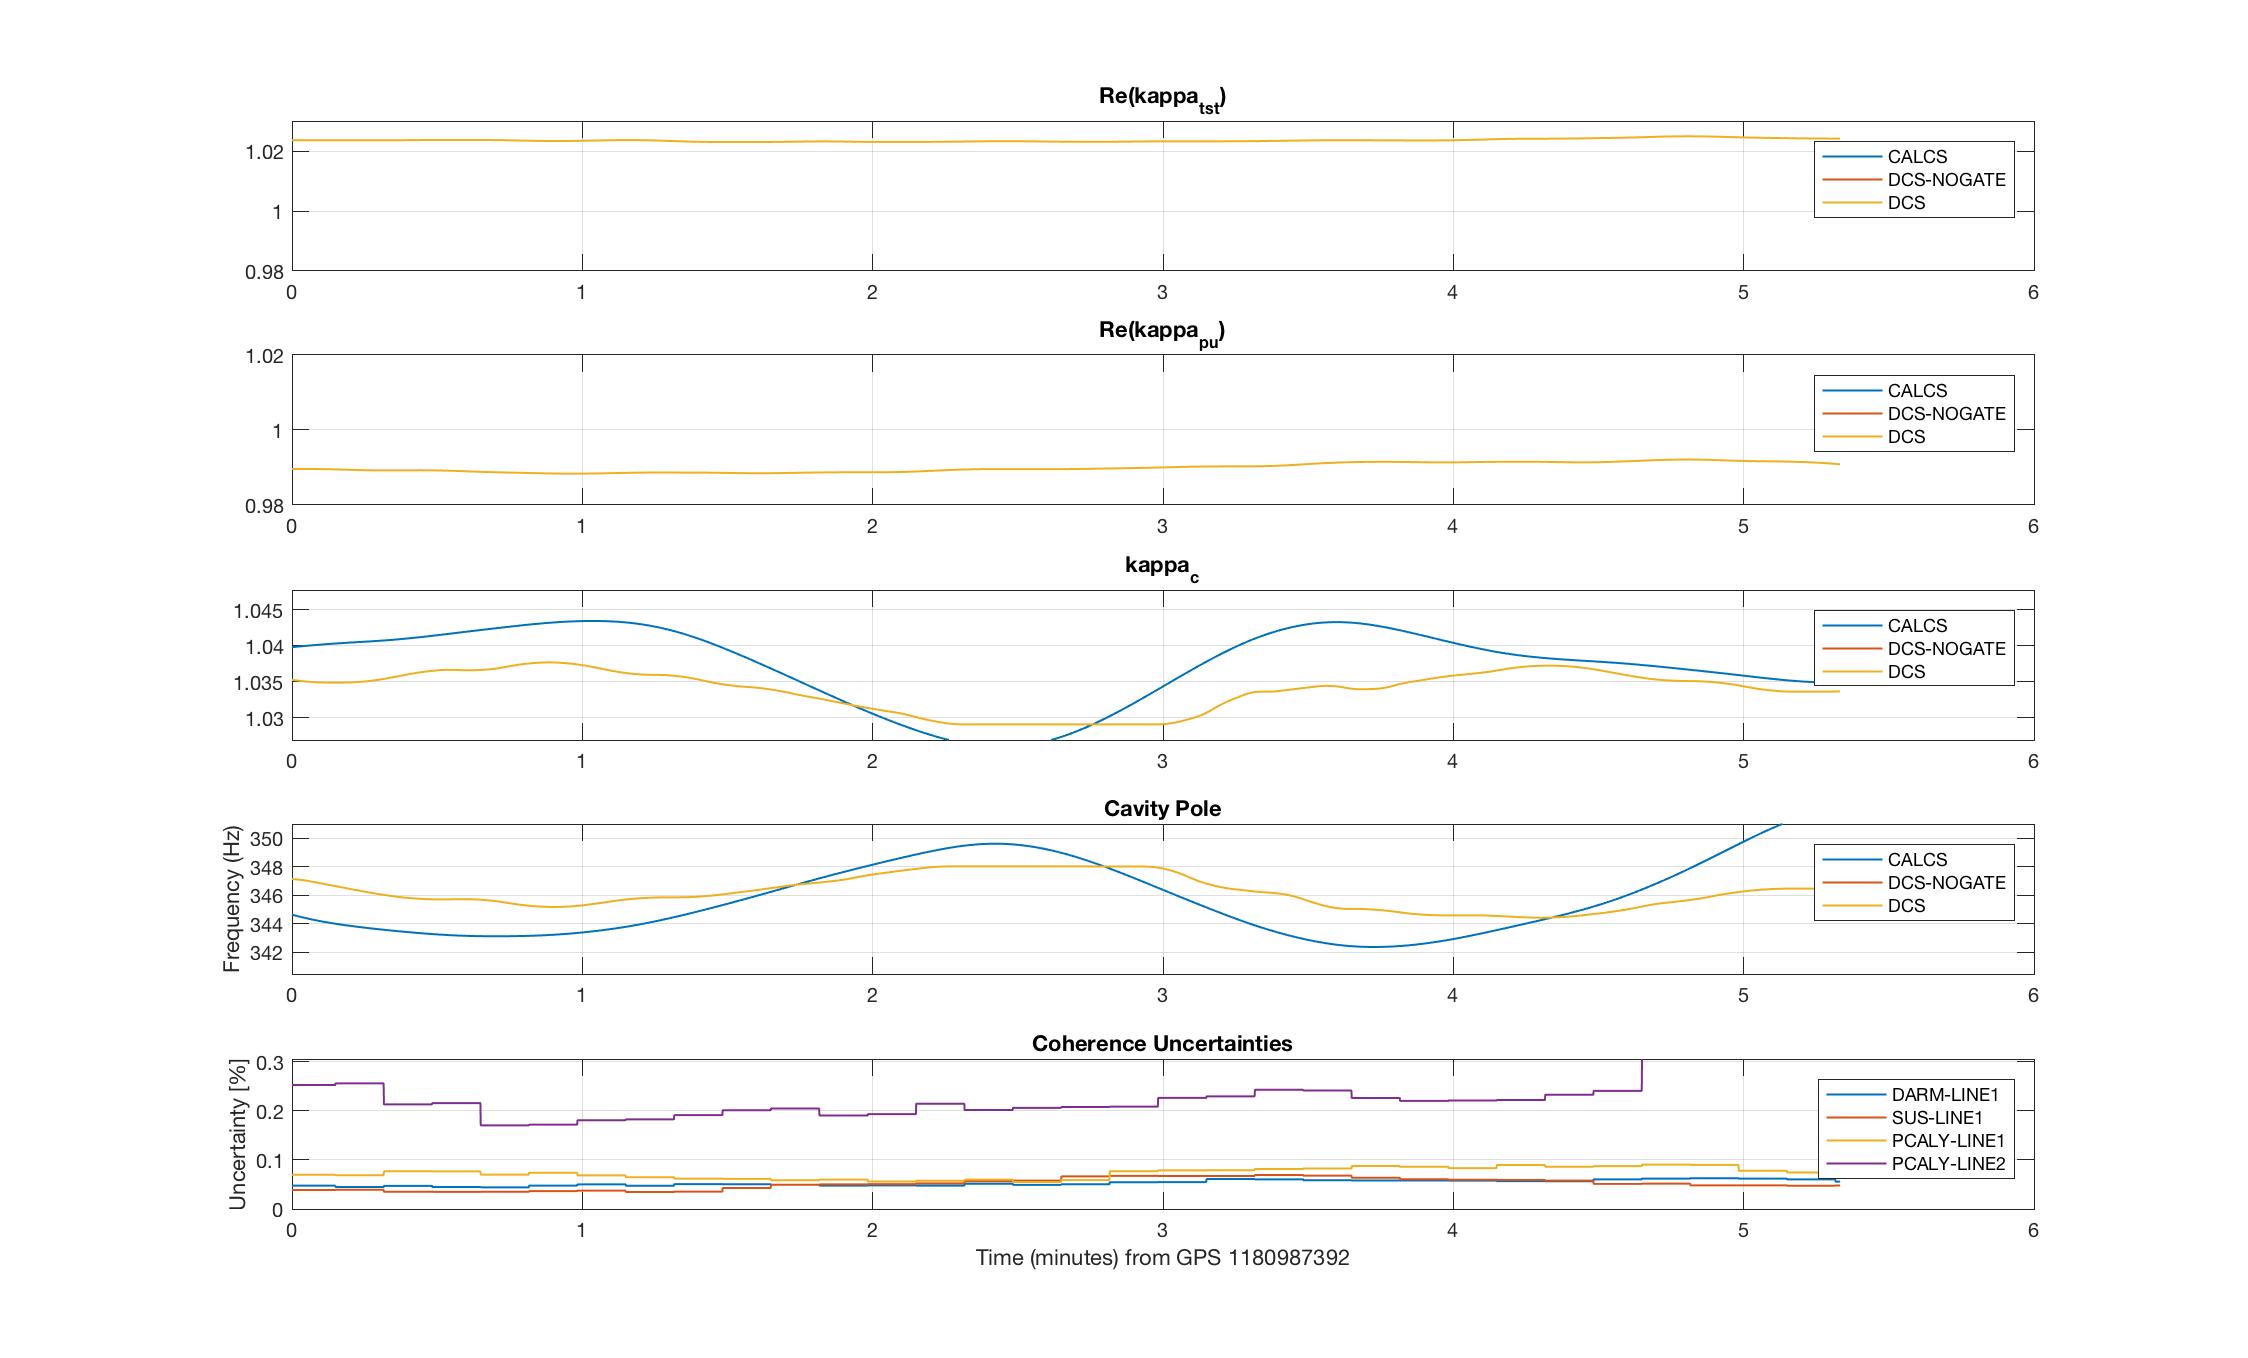
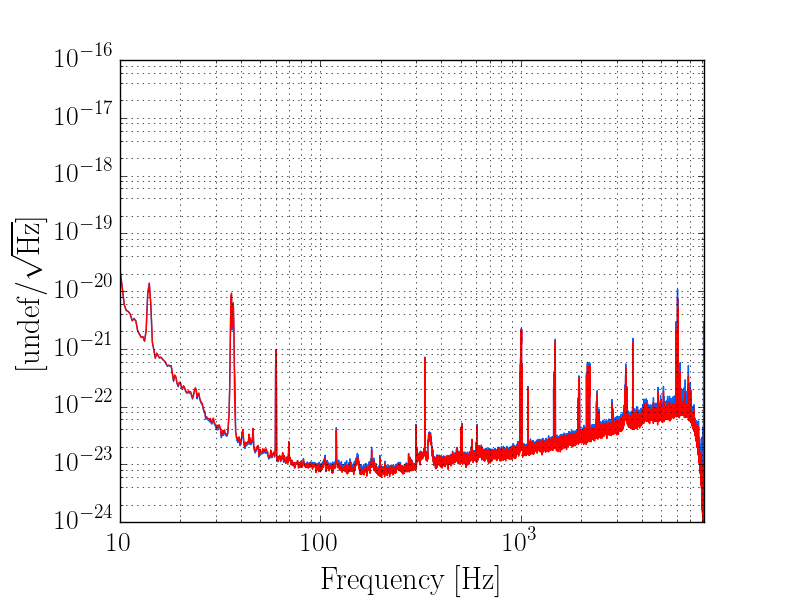
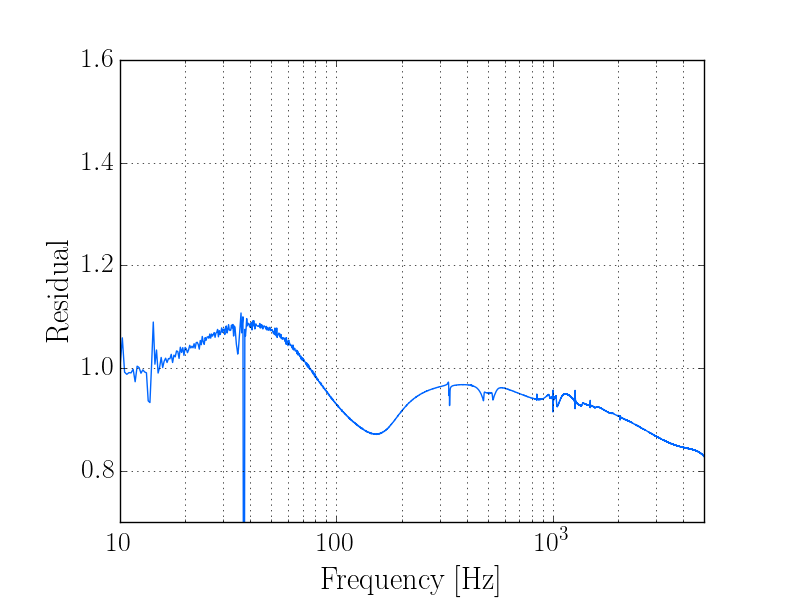
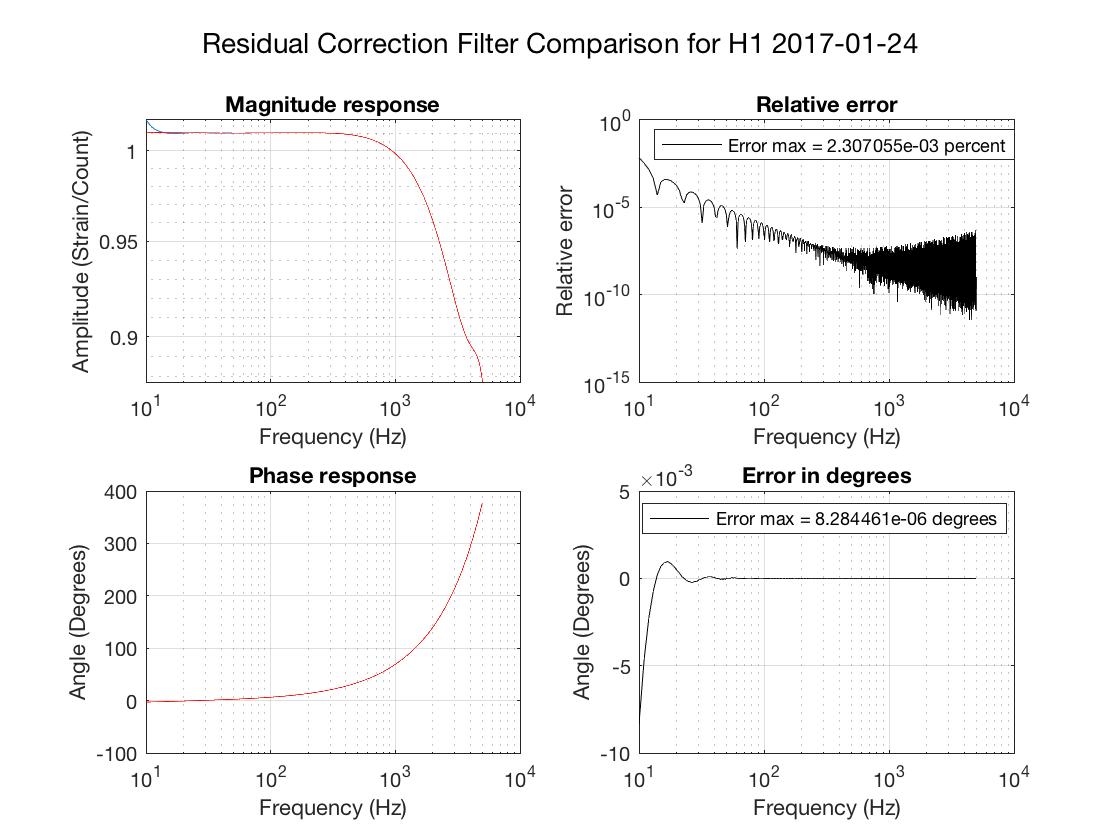
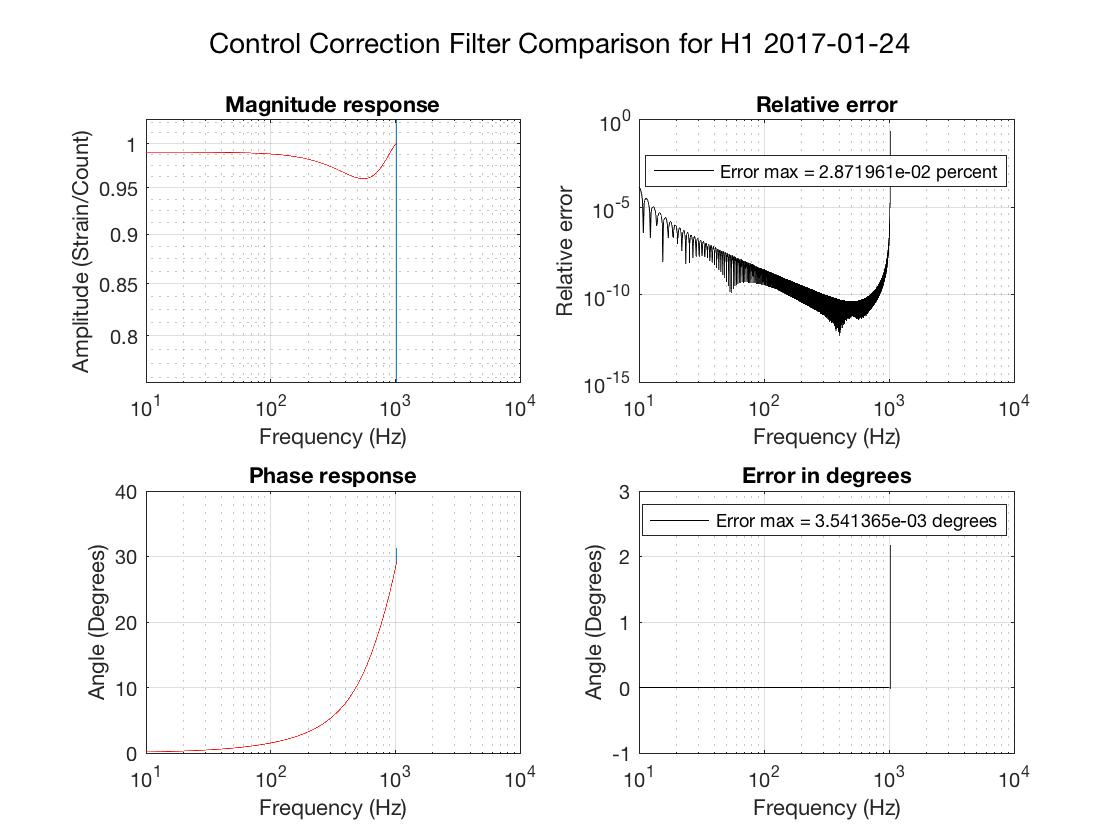
I have produced filters for offline calibration of Hanford data starting at GPS time 1173225472. The filters can be found in the calibration SVN at this location:
ligo/svncommon/CalSVN/aligocalibration/trunk/Runs/O2/GDSFilters/H1DCS_1173225472.npz

The new filters have EPICS and calibration line parameters for computing SRC detuning parameters. See
https://alog.ligo-wa.caltech.edu/aLOG/index.php?callRep=35041

For suggested command line options to use when calibrating this data, see:
https://wiki.ligo.org/Calibration/GDSCalibrationConfigurationsO2

The filters were produced using this Matlab script in SVN revision 4584:
ligo/svncommon/CalSVN/aligocalibration/trunk/Runs/O2/H1/Scripts/TDfilters/H1_run_td_filters_1173225472.m

The parameters files used (all in revision 4584) were:
ligo/svncommon/CalSVN/aligocalibration/trunk/Runs/O2/H1/params/2017-01-24/modelparams_H1_2017-01-24.conf
ligo/svncommon/CalSVN/aligocalibration/trunk/Runs/O2/H1/params/2017-01-24/H1_TDparams_1175954418.conf
ligo/svncommon/CalSVN/aligocalibration/trunk/Runs/O2/H1/Scripts/CAL_EPICS/callineParams_20170411.m
ligo/svncommon/CalSVN/aligocalibration/trunk/Runs/O2/H1/Scripts/CAL_EPICS/D20170411_H1_CAL_EPICS_VALUES.m

Several plots are attached. The first four (png files) are spectrum comparisons between CALCS, GDS, and DCS. GDS and DCS agree to the expected level.
Brief time series of the kappas and coherences are attached, for comparison with CALCS.
Time domain vs. frequency domain comparison plots of the filters are also attached.
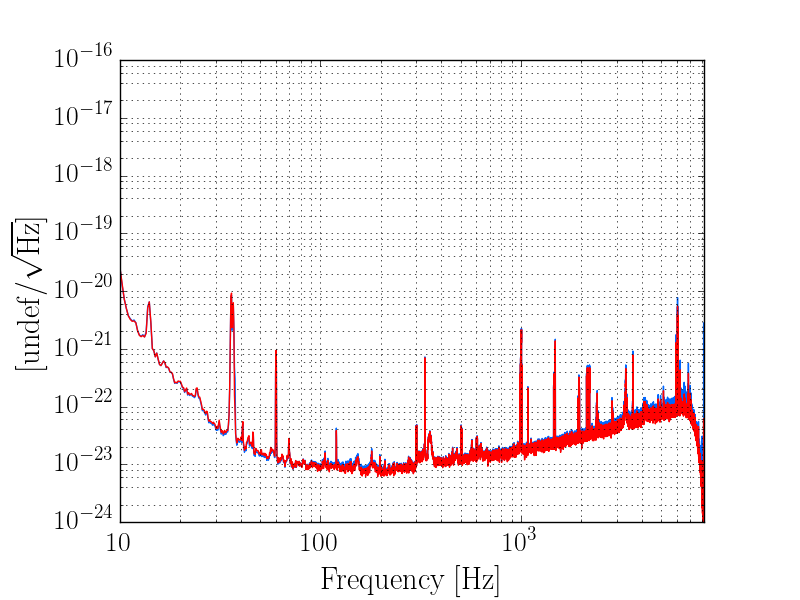
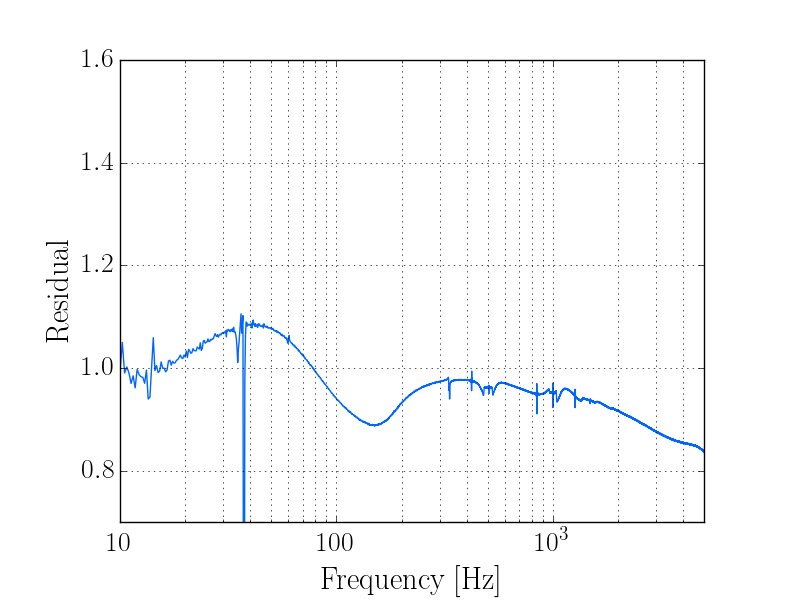
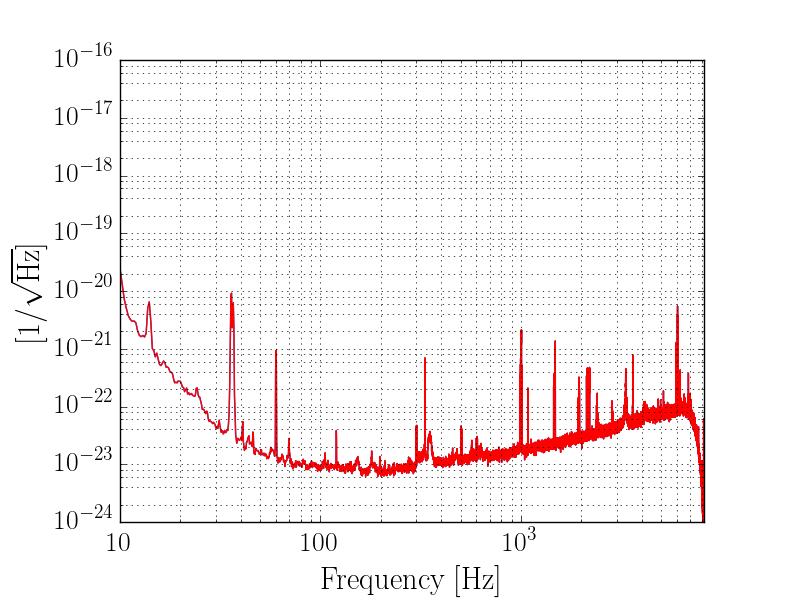
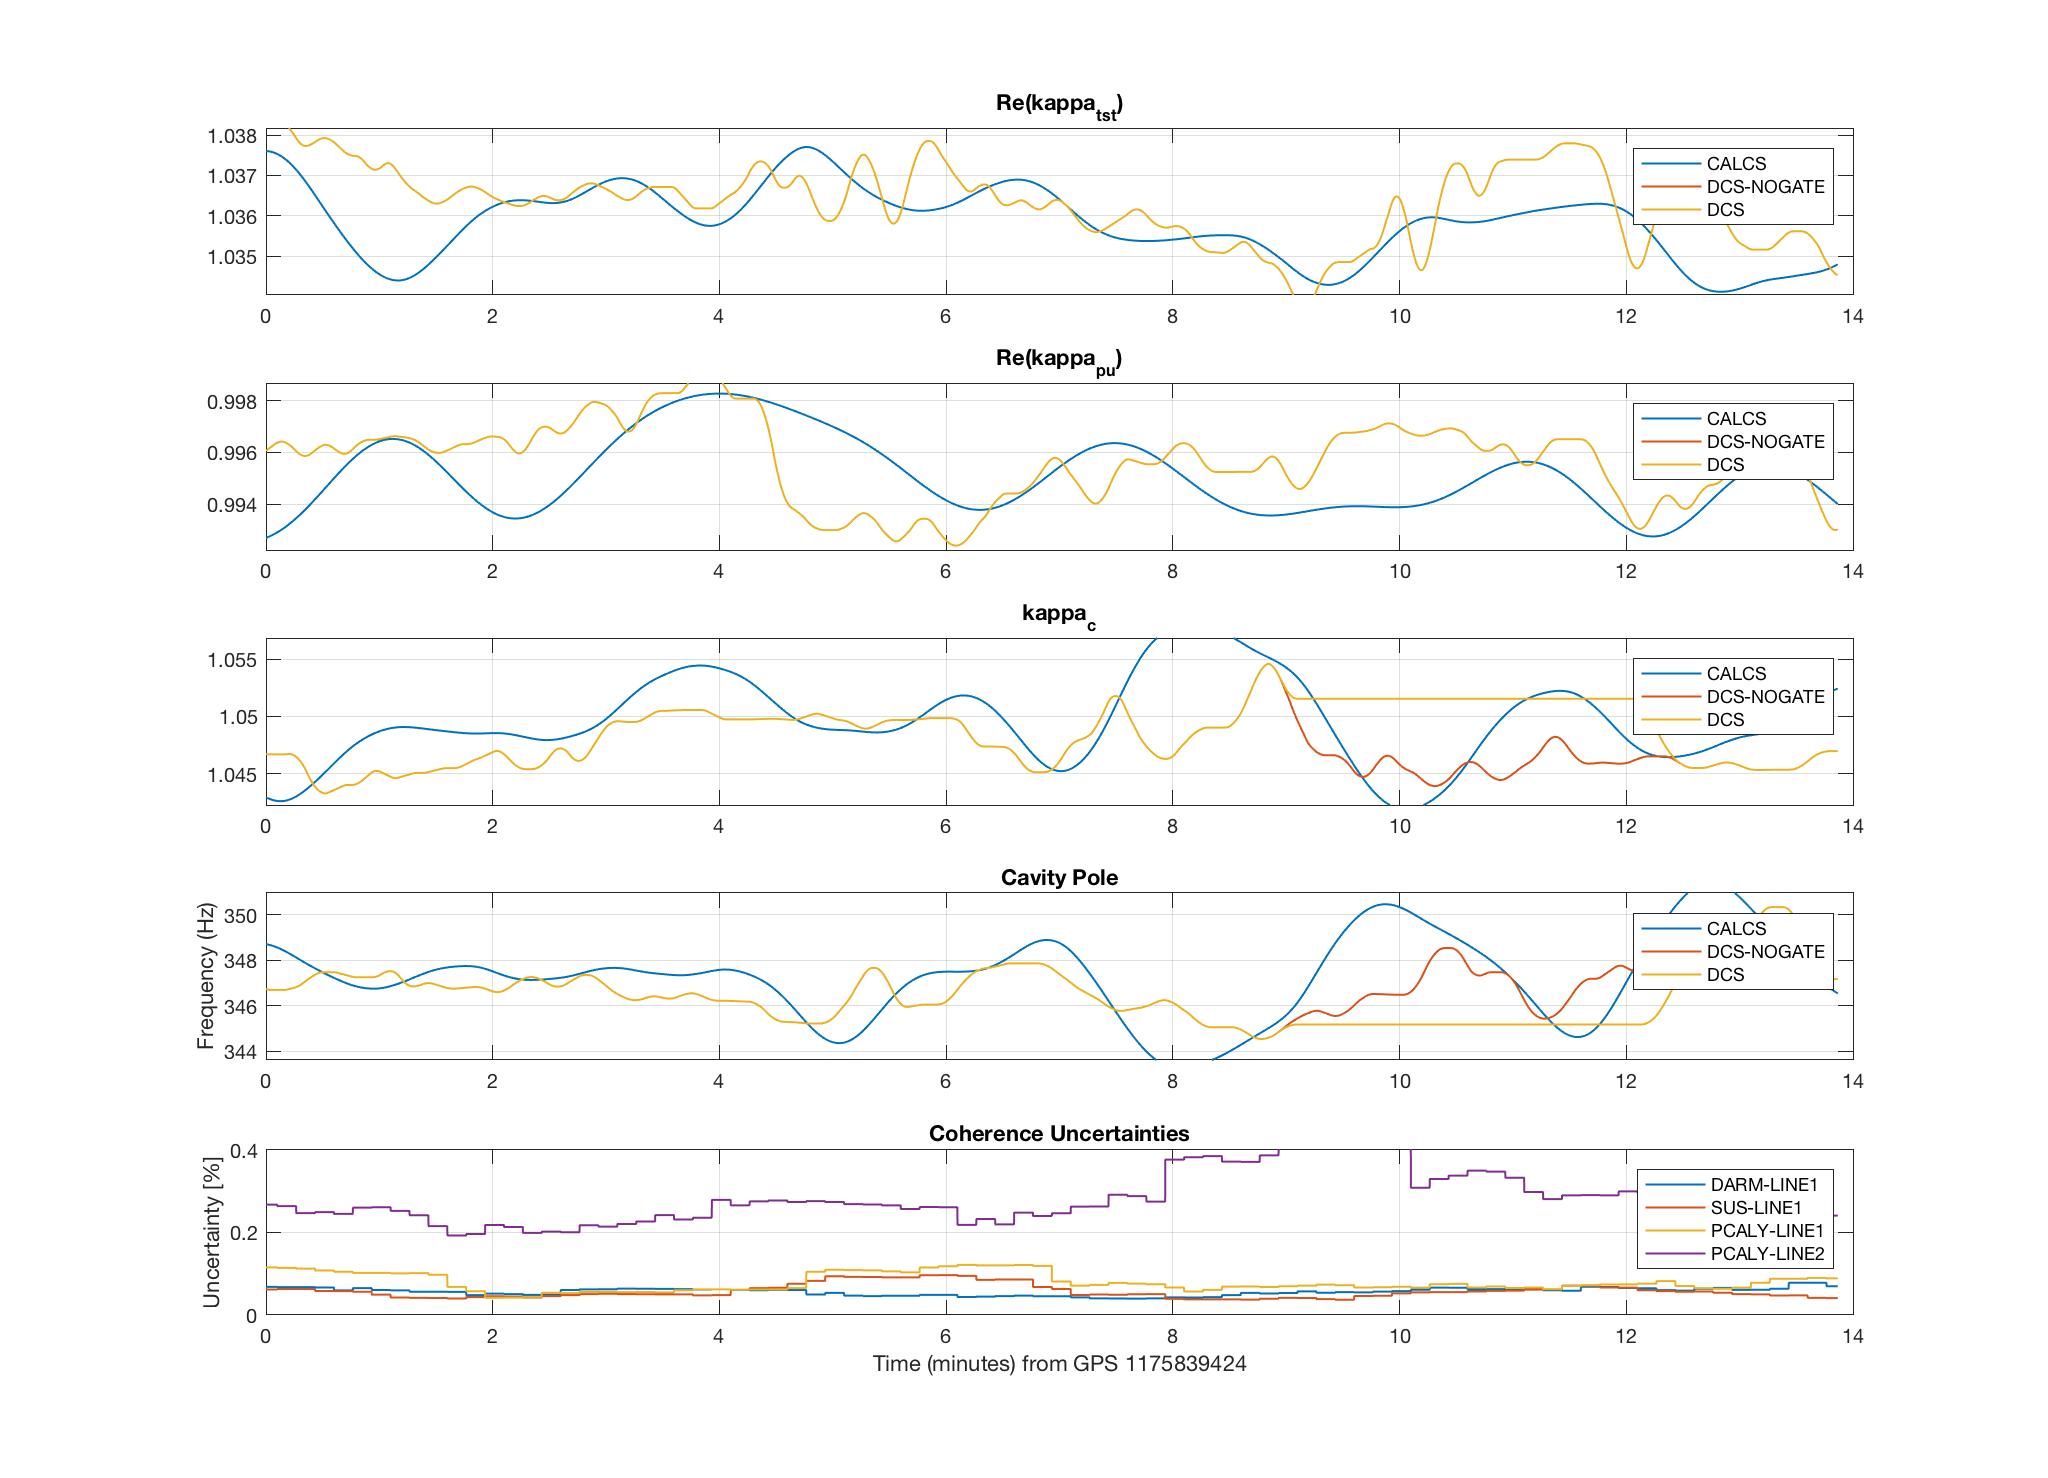
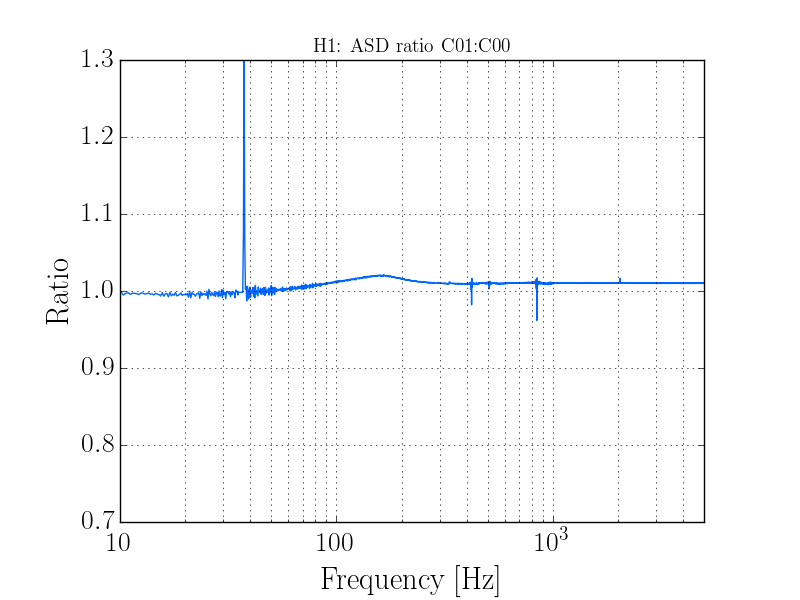
As a sanity check, I have calibrated data from early June to test whether these filters are up to date. Spectrum comparisons between the C00 frames and these filters are shown, and some unexpected discrepancy is noted at higher frequencies. Time series of the kappas are attached as well. These agree with the summary pages (i.e., the GDS pipeline).
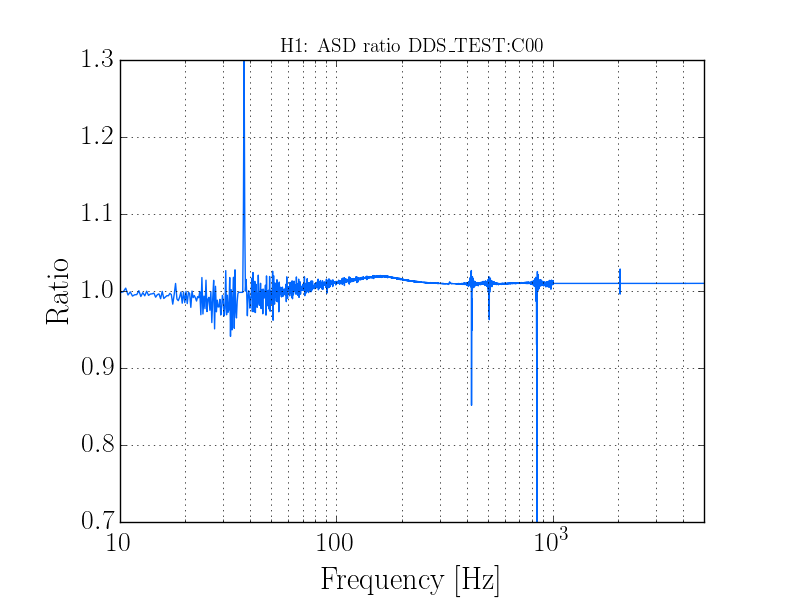
It is now evident that this change did not occur during the vent, as the attached ASD ratio plot is from C01 and C00 data from May 08, 2017 at 14:00:00 UTC (GPS 1178287218), right before the vent.
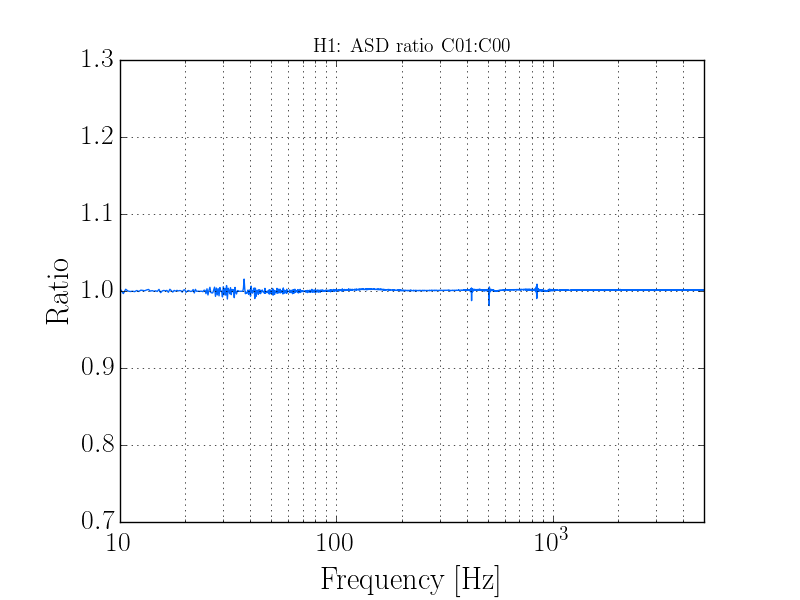
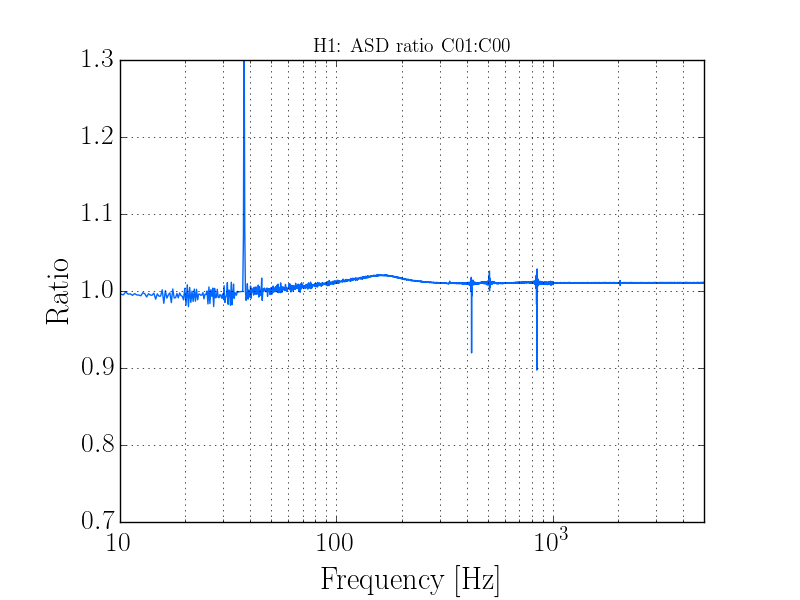
It seems this change occurred during maintenance on Tuesday, April 11. The first ASD ratio is from data right before maintenance activities, and the second is from right after. Also it is confirmed that this is not being caused by a difference in the applied kappas (so the EPICS records agree). The most likely culprit is a change in the inverse sensing filtering.
Relevant aLOGs around April 11th -- LHO aLOG 35474, and more specifically the comment, LHO aLOG 35476 which a "small change in writeEPICs code" is mentioned.

Can we compare the EPICs records committed to the repo around that time?
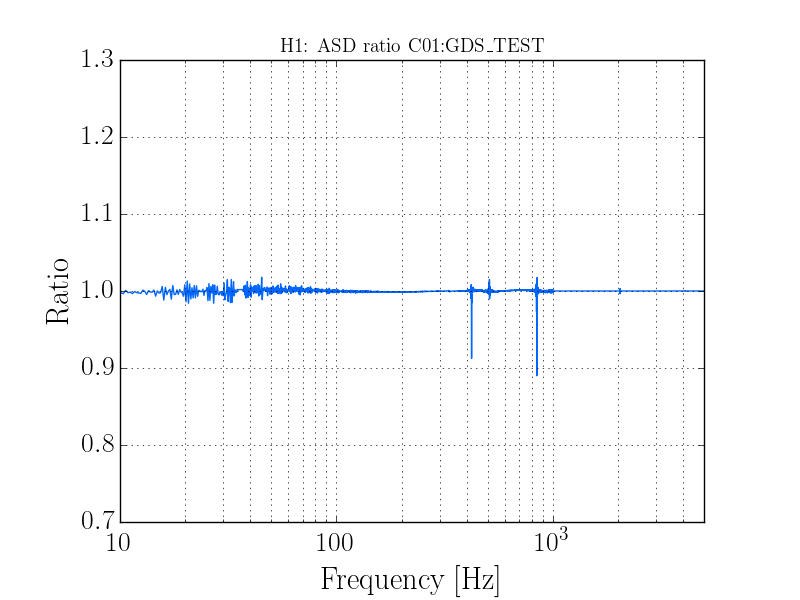
I traced the problem to the GDS filters installed on April 11: https://alog.ligo-wa.caltech.edu/aLOG/index.php?callRep=35462
Simply regenerating those filters seems to have fixed the problem, as shown in the attached ASD ratio plot comparing C01 to the corrected GDS filter output right after maintenance on April 11. The filters were generated as described in the above aLOG, except that the SVN revision was 4781, so the exact reason for the problem is unknown.

The C00 data affected by this problem starts on April 11 (GPS 1175976351), and it is still currently being affected, until we restart the GDS pipeline, no later than next Tuesday, June 20. The C01 frames are not affected by this and should be fine.
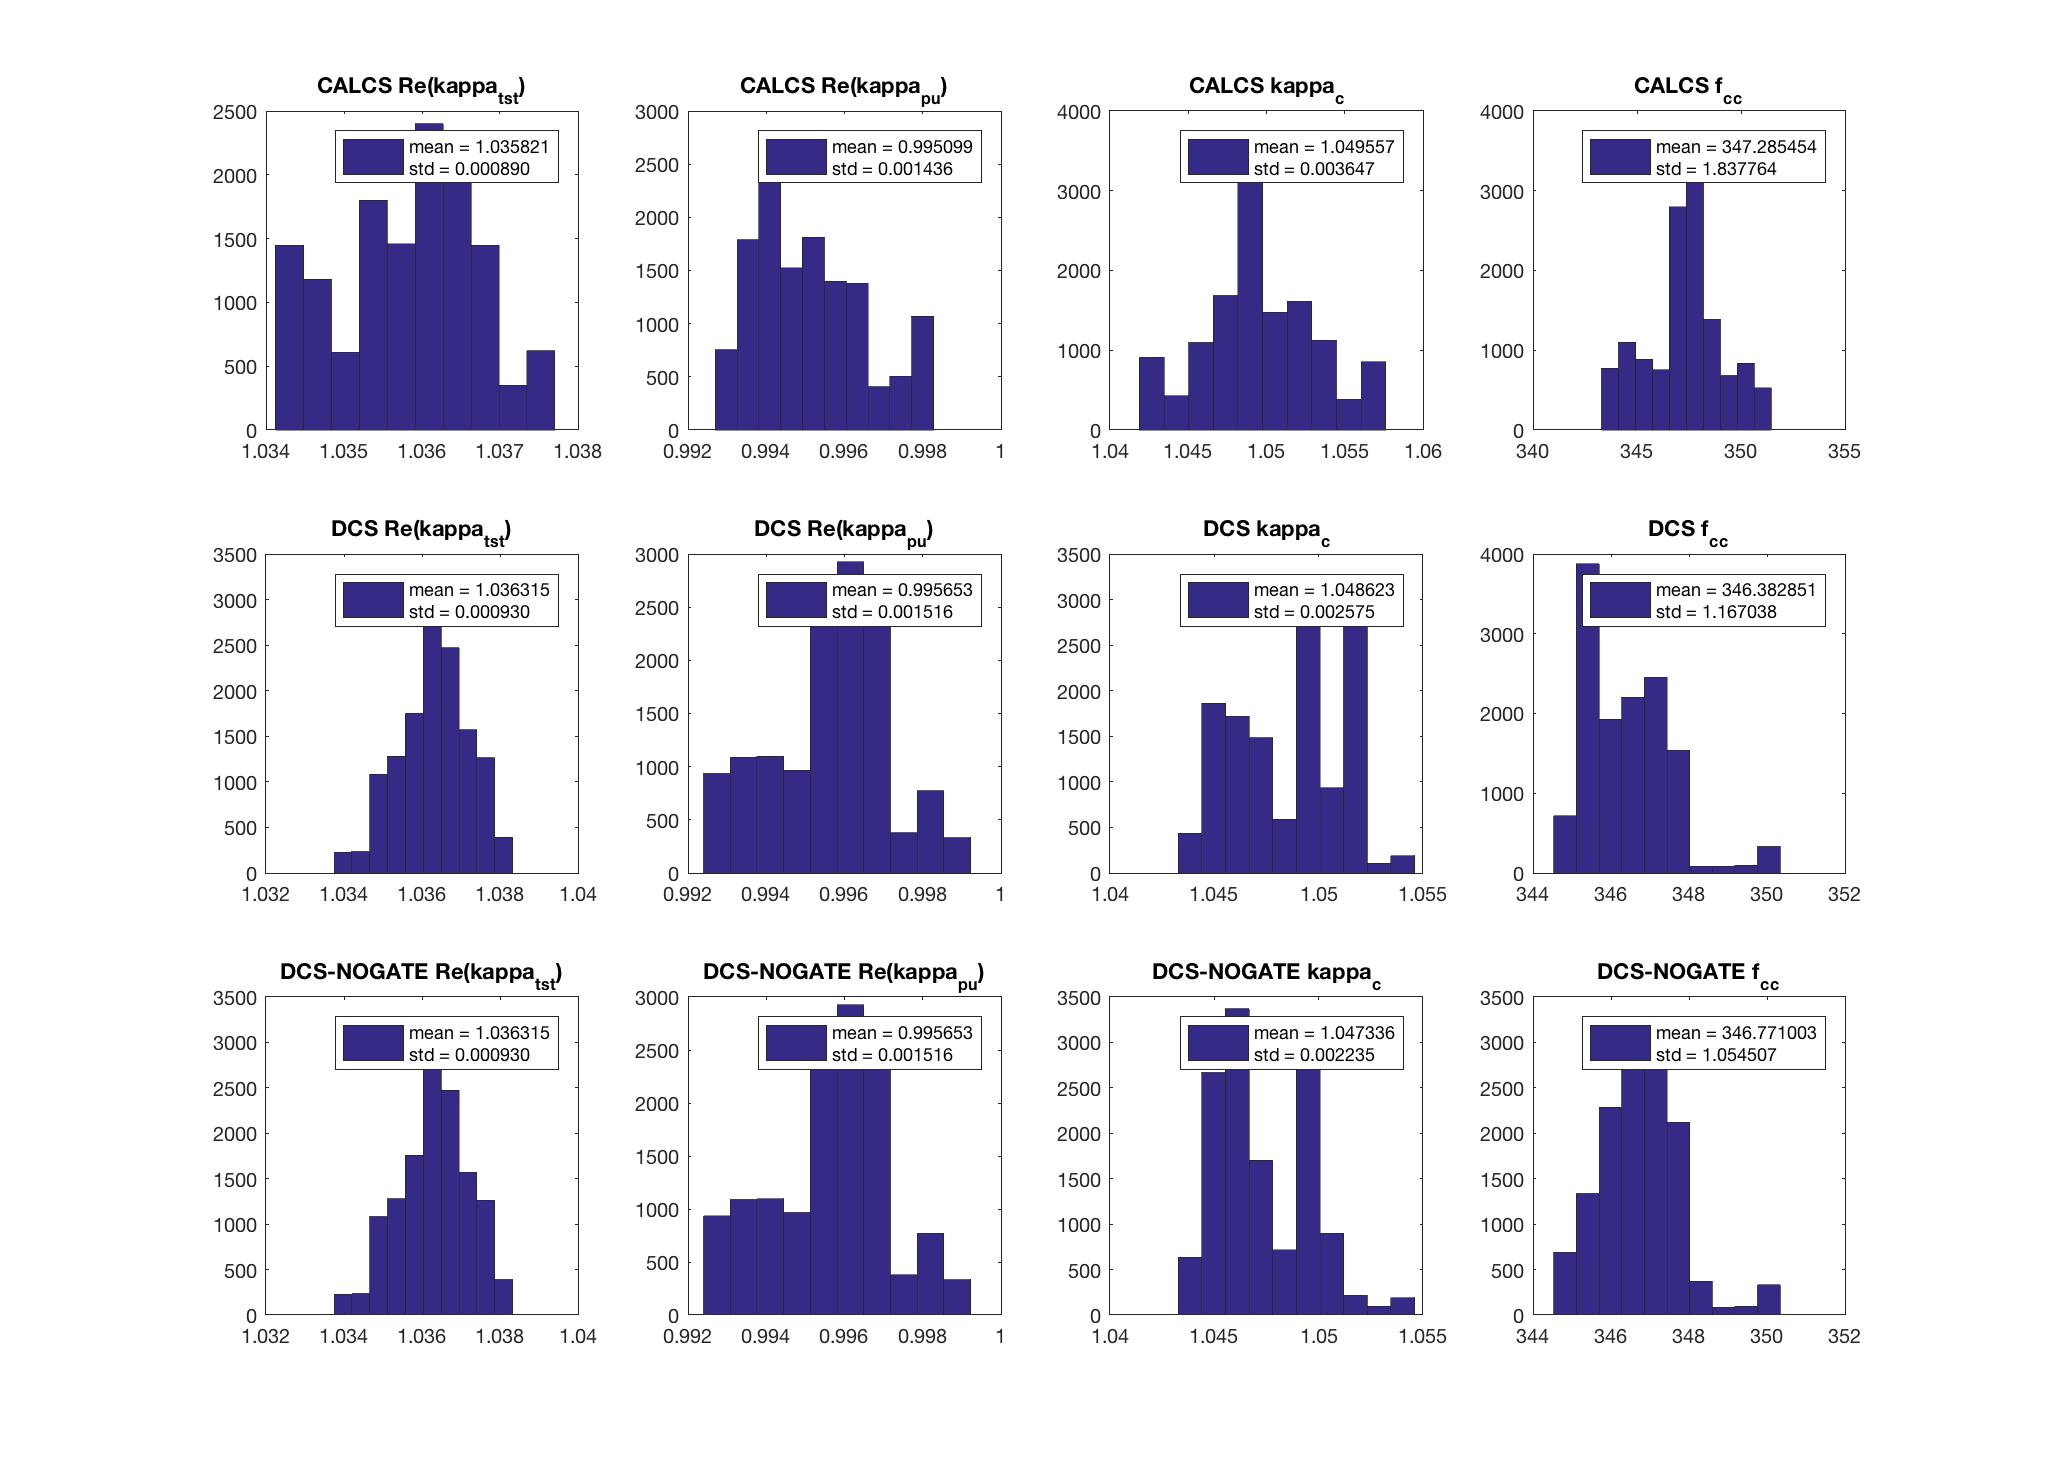
[Jeff K, Aaron V]

I have produced new GDS filters for LHO that include new paramters (pcal correction factors and EPICS) necessary to compute SRC detuning parameters. It will also be possible to subtract the calibration lines from the strain, producing the additional channel GDS-CALIB_STRAIN_CLEAN, if we desire. The filters can be found in the calibration SVN at this location:
ligo/svncommon/CalSVN/aligocalibration/trunk/Runs/O2/GDSFilters/H1GDS_1175954418.npz

For information on GDS calculations of SRC detuning parameters, see:
https://alog.ligo-wa.caltech.edu/aLOG/index.php?callRep=35041  (note that we now compute Q-inverse instead of Q)
https://alog.ligo-la.caltech.edu/EVNT/index.php?callRep=11785

The filters were produced using this Matlab script in SVN revision 4537:
ligo/svncommon/CalSVN/aligocalibration/trunk/Runs/O2/H1/Scripts/TDfilters/H1_run_td_filters_1175954418.m

The parameters files used (all in revision 4537) were:
ligo/svncommon/CalSVN/aligocalibration/trunk/Runs/O2/H1/params/2017-01-24/modelparams_H1_2017-01-24.conf
ligo/svncommon/CalSVN/aligocalibration/trunk/Runs/O2/H1/params/2017-01-24/H1_TDparams_1175954418.conf
ligo/svncommon/CalSVN/aligocalibration/trunk/Runs/O2/H1/Scripts/CAL_EPICS/callineParams_20170411.m

ASD plots comparing GDS and the front-end CALCS model are attached. These agree with those on the summary pages from the same day (4/10), as expected. Also, time domain vs. frequency domain comparison plots of the filters are attached. Lastly, a time series plot of the kappas from GDS and CALCS is attached, as well as histograms. These show the expected output.
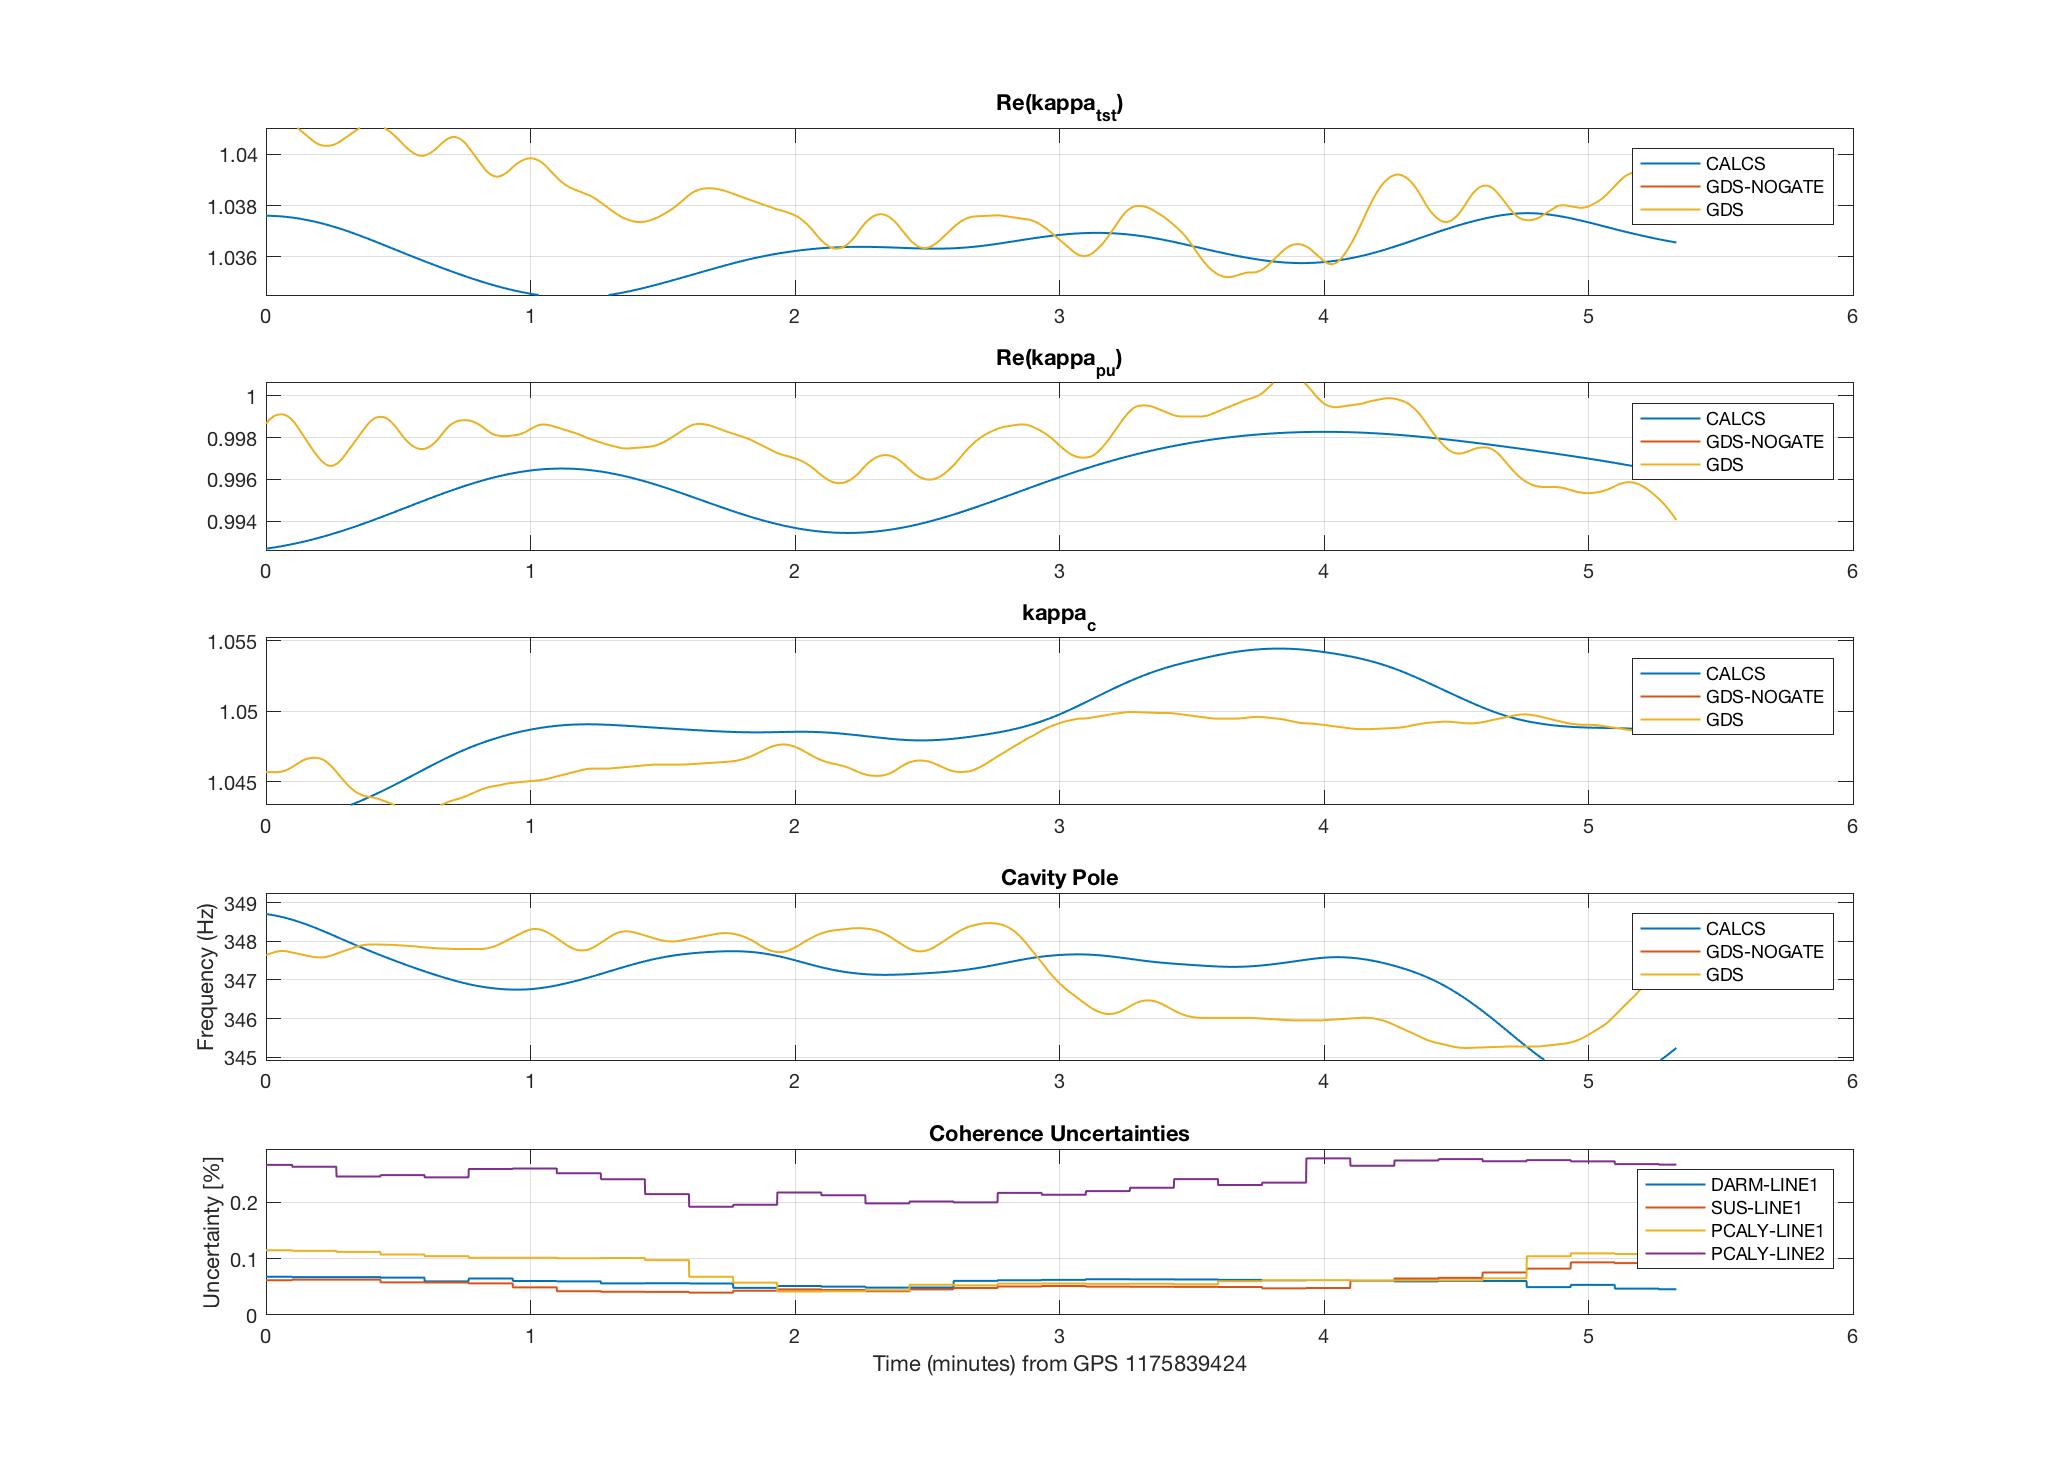
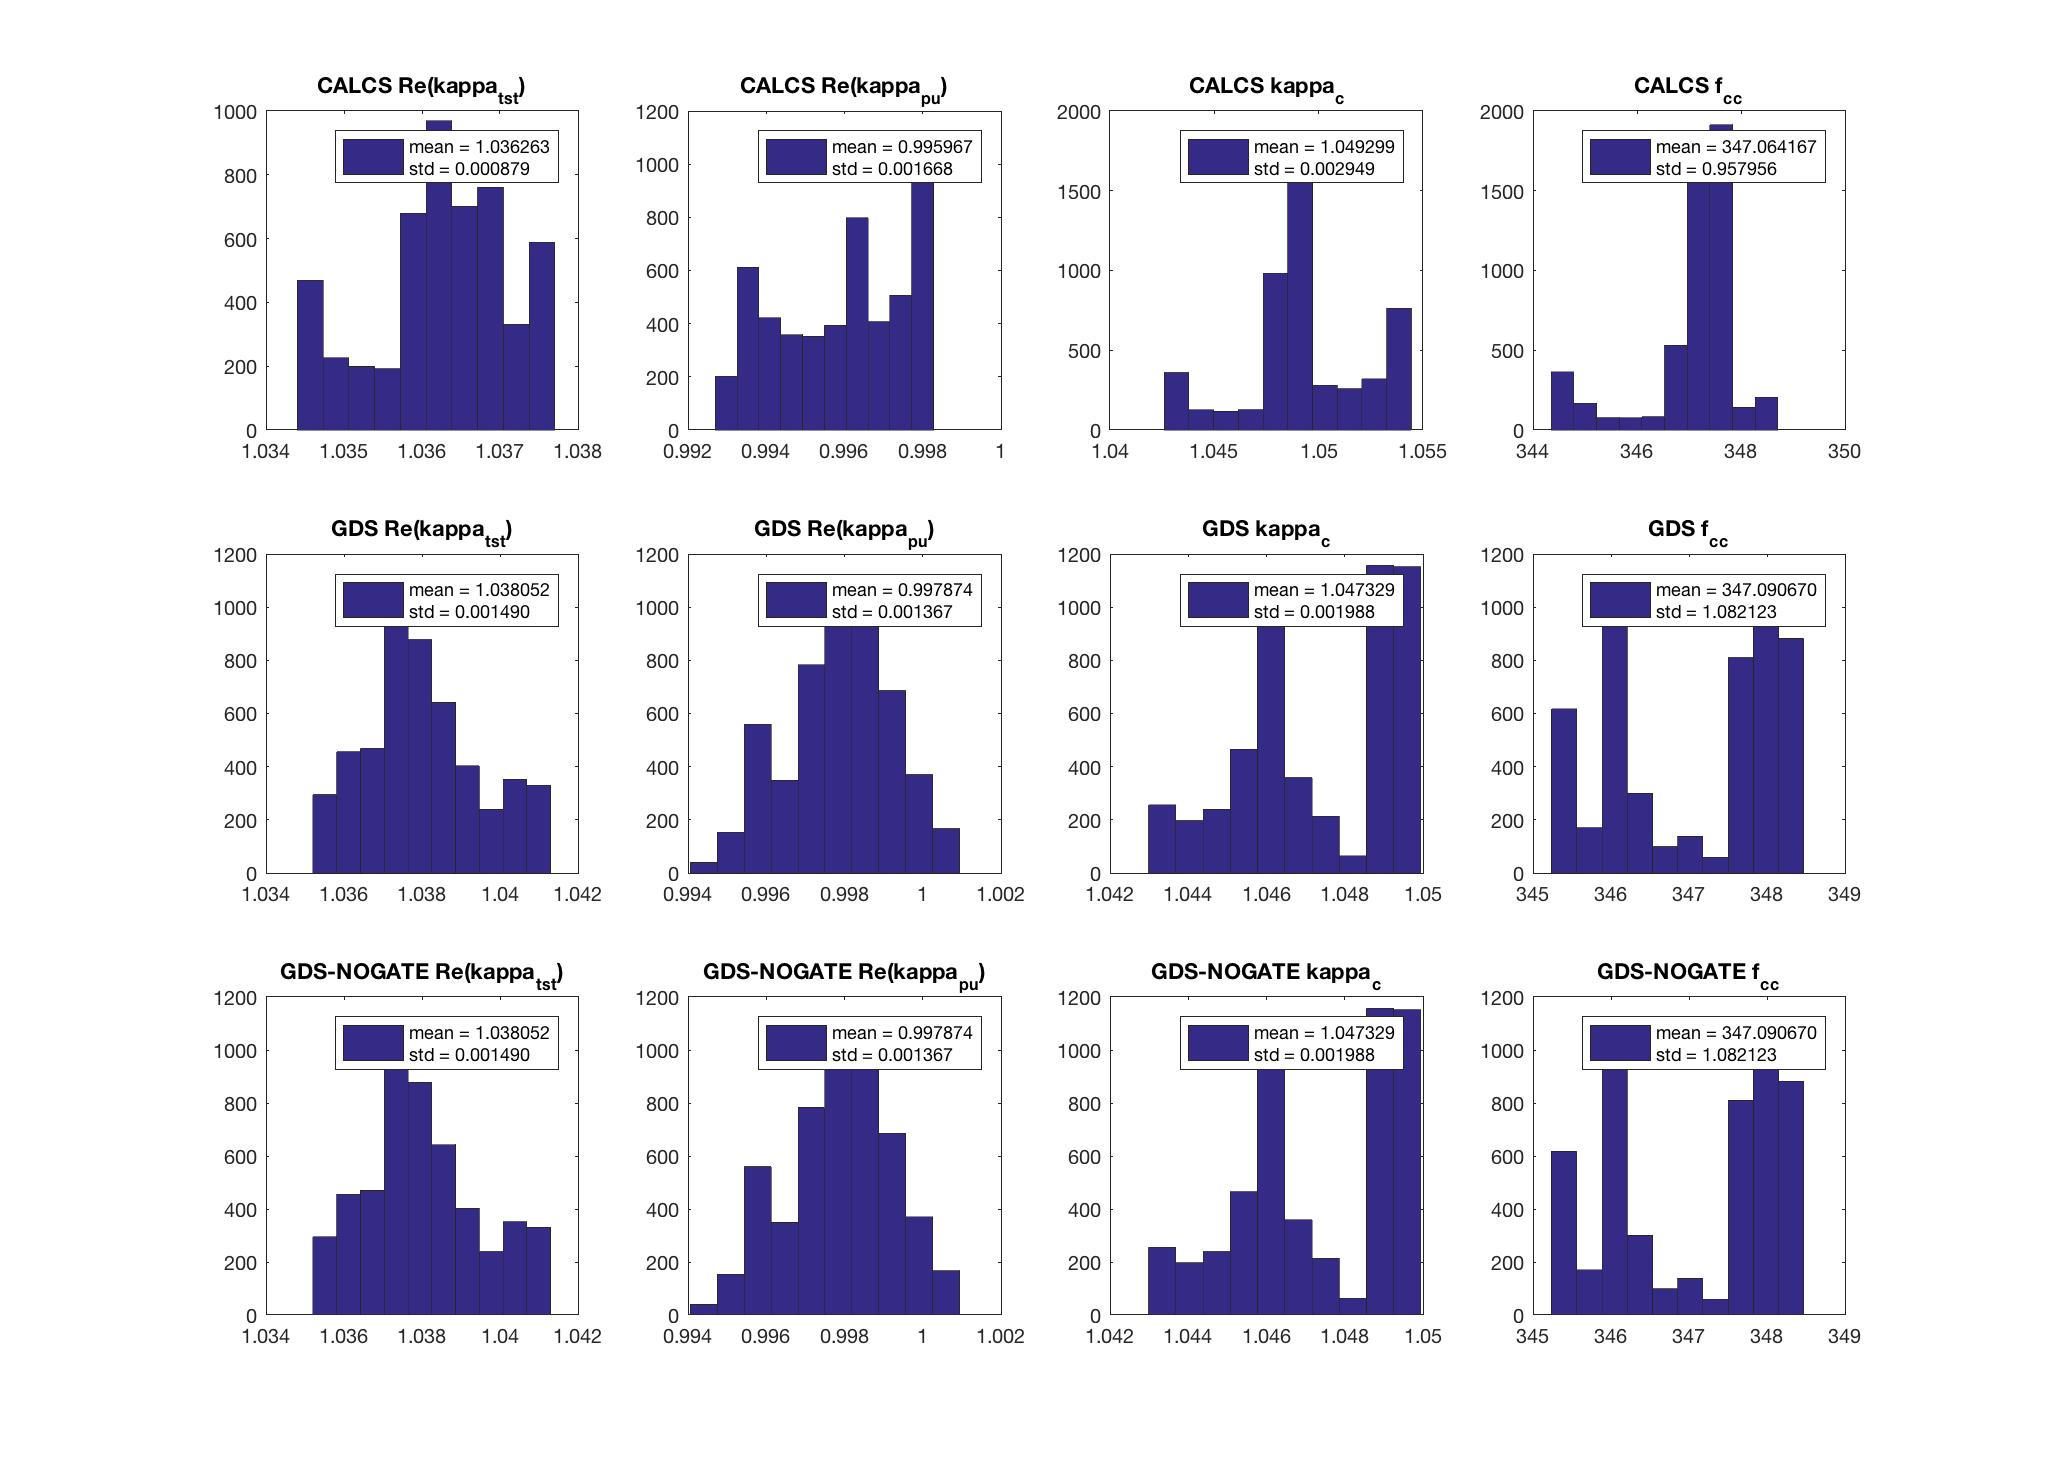
It was discovered that the output of these filters did not agree with the C01 frames. These GDS filters have been regenerated with SVN revision 4781, and the discrepancy has disappeared. For more details on this issue, see https://alog.ligo-wa.caltech.edu/aLOG/index.php?callRep=36863 .

More confusion. The link in the SITEMAP.adl file in
/opt/rtcds/lho/h1/medmpoints to/ligo/lho/h0/fmcs/medmnot/opt/rtcds/userapps/release/fmcs/h0/medm./ligo/lho/h0/fmcs/medmis an svn working copy already at the most recent revision.Perhaps something changed with the SITEMAP instead?
/ligo/apps/debian8/utils/bin/sitemap
patrick.thomas@zotws3:~$ cat /ligo/apps/debian8/utils/bin/sitemap
#!/bin/bash
source /ligo/cdscfg/stdsetup.sh
cd /opt/rtcds/lho/h1/medm
exec medm
-noMsg
-macro "USERAPPS=/opt/rtcds/userapps/release/"
-attach
-displayFont fixed
-x SITEMAP.adl &> /dev/null &