filiberto.clara@LIGO.ORG - posted 13:23, Tuesday 13 June 2017 - last comment - 14:28, Monday 19 June 2017(36855)
ALS Y WFS A Demod Readback Signals
The operator reported that Dave reported that the TCSY chiller was low on water. I filled it and topped off the TCSX chiller. The TCSY chiller needed 1.6L and was last filled ~3-4 weeks ago. The month before that, the log also shows a fill of ~1L. So, we're loosing a liter ever month right now... Also, the filters looked pretty green on both chillers. Let's just get through the end of this run so we can work on this system.
With John Zweizig and Aaron Viets.
The work on [LHO WP] Permit Number: 7032 is done.
We added the SRC channels,
H1:GDS-CALIB_F_S
H1:GDS-CALIB_F_S_NOGATE
H1:GDS-CALIB_SRC_Q_INVERSE
H1:GDS-CALIB_SRC_Q_INVERSE_NOGATE
back into the C00 hoft frames written to disk. These will appear in the aggregated C00 hoft frames starting from: 1181412580.
We did a complete yum update on the LHO DMT test computer. LLO also did security patching on the production DMT computers and we did that here too.
Other than some curtains on the top of ISC tables, which has been deemed okay, and the SR3 Optical Lever PD giraffe (unused in IFO operation sans position monitoring,) all curtains are clear of things.
Re terminated wiring for the anemometer to fix the problem.  I believe when the one of the  wires was landed the nut landed on the insulation and did not make good contact with the copper strands thus causing our issues.
WP 7038
This will be Roam6. I'll update the location map and keep an eye out for wind. Closing WP 7030.
Combined with JeffK's change on the OMC model, these changes connected the OMC state to the HAM6 ISI WD system. There is no longer a white box around the payload button on the HAM6 ISI overview and the Payload button brings up an medm now. This closes WP 7029.
CER activity caused a timing error on h1seih454 and h1oaf0. Connection to IO-Chassis was not impacted, all models on these front end computers were restarted. h1oaf0 models were restarted twice, the first time I started it as the wrong user.
I checked the TCS Chillers on the mech room mezzanine to verify they are ok, which they are but EY's chiller water level looks low.
strong possibility that when I was attaching the side to the rack this glitched the system.
The lifting platform was hoisted over the beam tube and placed back into its storage location
(the H2 Diode Room).

    This closes WP 7038.


JeffB / Peter
Hugh, Patrick, Dave:
We built and restarted h1isiham6 model, followed by a DAQ restart to add some slow channels from h1isiham6, and install the new H0EDCU_FMCS.ini
Hugh made a minor change to h1isiham6.mdl to generated a payload MEDM adl file. A new h1isiham6.ko was generated and the model was restarted for completeness.
WP 7026

Finished restart. There are white boxes on the medm screens for the channels that were removed. I will update the medm screens at a later time.
A DAQ restart is still required.
H0EDCU_FMCS changes due to today's code change. 62 channels added, 28 channels removed, net addition of 34 channels.
Channels Added:
+[H0:FMC-CS_CY_H2O_PUMPCALC]
+[H0:FMC-CS_LVEA_AH_COOLVALVE_1_PC]
+[H0:FMC-CS_LVEA_AH_COOLVALVE_2_PC]
+[H0:FMC-CS_LVEA_AH_COOLVALVE_3_PC]
+[H0:FMC-CS_LVEA_AH_COOLVALVE_4_PC]
+[H0:FMC-CS_LVEA_AH_DAMPER_1_PC]
+[H0:FMC-CS_LVEA_AH_DAMPER_2_PC]
+[H0:FMC-CS_LVEA_AH_PITCH_VANE_1_PC]
+[H0:FMC-CS_LVEA_AH_PITCH_VANE_2_PC]
+[H0:FMC-CS_LVEA_AH_PITCH_VANE_3_PC]
+[H0:FMC-CS_LVEA_AH_PITCH_VANE_4_PC]
+[H0:FMC-CS_LVEA_HEATER_ZONE1A_PC]
+[H0:FMC-CS_LVEA_HEATER_ZONE1B_PC]
+[H0:FMC-CS_LVEA_HEATER_ZONE2A_PC]
+[H0:FMC-CS_LVEA_HEATER_ZONE2B_PC]
+[H0:FMC-CS_LVEA_HEATER_ZONE3A_PC]
+[H0:FMC-CS_LVEA_HEATER_ZONE3B_PC]
+[H0:FMC-CS_LVEA_HEATER_ZONE4_PC]
+[H0:FMC-CS_LVEA_HEATER_ZONE5_PC]
+[H0:FMC-CS_OSB_AH_COOLVALVE_5_PC]
+[H0:FMC-CS_OSB_AH_COOLVALVE_6_PC]
+[H0:FMC-CS_OSB_AH_HEATINGCOIL_10_PC]
+[H0:FMC-CS_OSB_AH_HEATINGCOIL_9_PC]
+[H0:FMC-CS_OSB_CR_DV6_DEGC]
+[H0:FMC-CS_OSB_CR_DV7_DEGC]
+[H0:FMC-CS_OSB_CR_DV8_DEGC]
+[H0:FMC-CS_OSB_CUR_DV9_DEGC]
+[H0:FMC-CS_OSB_GC_DV10_DEGC]
+[H0:FMC-CS_OSB_MSR_DV5_DEGC]
+[H0:FMC-EX_AH_COOLVALVE_1_PC]
+[H0:FMC-EX_AH_COOLVALVE_2_PC]
+[H0:FMC-EX_AH_DAMPER_1_PC]
+[H0:FMC-EX_AH_DAMPER_2_PC]
+[H0:FMC-EX_AH_HEATER_PC]
+[H0:FMC-EX_AH_PITCH_VANE_1_PC]
+[H0:FMC-EX_AH_PITCH_VANE_2_PC]
+[H0:FMC-EX_CY_H2O_PUMPCALC]
+[H0:FMC-EY_AH_COOLVALVE_1_PC]
+[H0:FMC-EY_AH_COOLVALVE_2_PC]
+[H0:FMC-EY_AH_DAMPER_1_PC]
+[H0:FMC-EY_AH_DAMPER_2_PC]
+[H0:FMC-EY_AH_HEATER_PC]
+[H0:FMC-EY_AH_PITCH_VANE_1_PC]
+[H0:FMC-EY_AH_PITCH_VANE_2_PC]
+[H0:FMC-EY_CY_H2O_PUMPCALC]
+[H0:FMC-MILLIAMP_MAXVAL]
+[H0:FMC-MX_AH_COOLVALVE_1_PC]
+[H0:FMC-MX_AH_COOLVALVE_2_PC]
+[H0:FMC-MX_AH_DAMPER_1_PC]
+[H0:FMC-MX_AH_DAMPER_2_PC]
+[H0:FMC-MX_AH_HEATER_PC]
+[H0:FMC-MX_AH_PITCH_VANE_1_PC]
+[H0:FMC-MX_AH_PITCH_VANE_2_PC]
+[H0:FMC-MX_CY_H2O_PUMPCALC]
+[H0:FMC-MY_AH_COOLVALVE_1_PC]
+[H0:FMC-MY_AH_COOLVALVE_2_PC]
+[H0:FMC-MY_AH_DAMPER_1_PC]
+[H0:FMC-MY_AH_DAMPER_2_PC]
+[H0:FMC-MY_AH_HEATER_PC]
+[H0:FMC-MY_AH_PITCH_VANE_1_PC]
+[H0:FMC-MY_AH_PITCH_VANE_2_PC]
+[H0:FMC-MY_CY_H2O_PUMPCALC]
Channels removed:
-[H0:FMC-EX_AH_COOLVALVE_1]
-[H0:FMC-EX_AH_COOLVALVE_2]
-[H0:FMC-EX_AH_DAMPER_1]
-[H0:FMC-EX_AH_DAMPER_2]
-[H0:FMC-EX_AH_HEATER]
-[H0:FMC-EX_AH_PITCH_VANE_1]
-[H0:FMC-EX_AH_PITCH_VANE_2]
-[H0:FMC-EY_AH_COOLVALVE_1]
-[H0:FMC-EY_AH_COOLVALVE_2]
-[H0:FMC-EY_AH_DAMPER_1]
-[H0:FMC-EY_AH_DAMPER_2]
-[H0:FMC-EY_AH_HEATER]
-[H0:FMC-EY_AH_PITCH_VANE_1]
-[H0:FMC-EY_AH_PITCH_VANE_2]
-[H0:FMC-MX_AH_COOLVALVE_1]
-[H0:FMC-MX_AH_COOLVALVE_2]
-[H0:FMC-MX_AH_DAMPER_1]
-[H0:FMC-MX_AH_DAMPER_2]
-[H0:FMC-MX_AH_HEATER]
-[H0:FMC-MX_AH_PITCH_VANE_1]
-[H0:FMC-MX_AH_PITCH_VANE_2]
-[H0:FMC-MY_AH_COOLVALVE_1]
-[H0:FMC-MY_AH_COOLVALVE_2]
-[H0:FMC-MY_AH_DAMPER_1]
-[H0:FMC-MY_AH_DAMPER_2]
-[H0:FMC-MY_AH_HEATER]
-[H0:FMC-MY_AH_PITCH_VANE_1]
-[H0:FMC-MY_AH_PITCH_VANE_2]
I was not expecting the addition of any channels. No harm done I guess though.
Range is dropping with it. See attached.
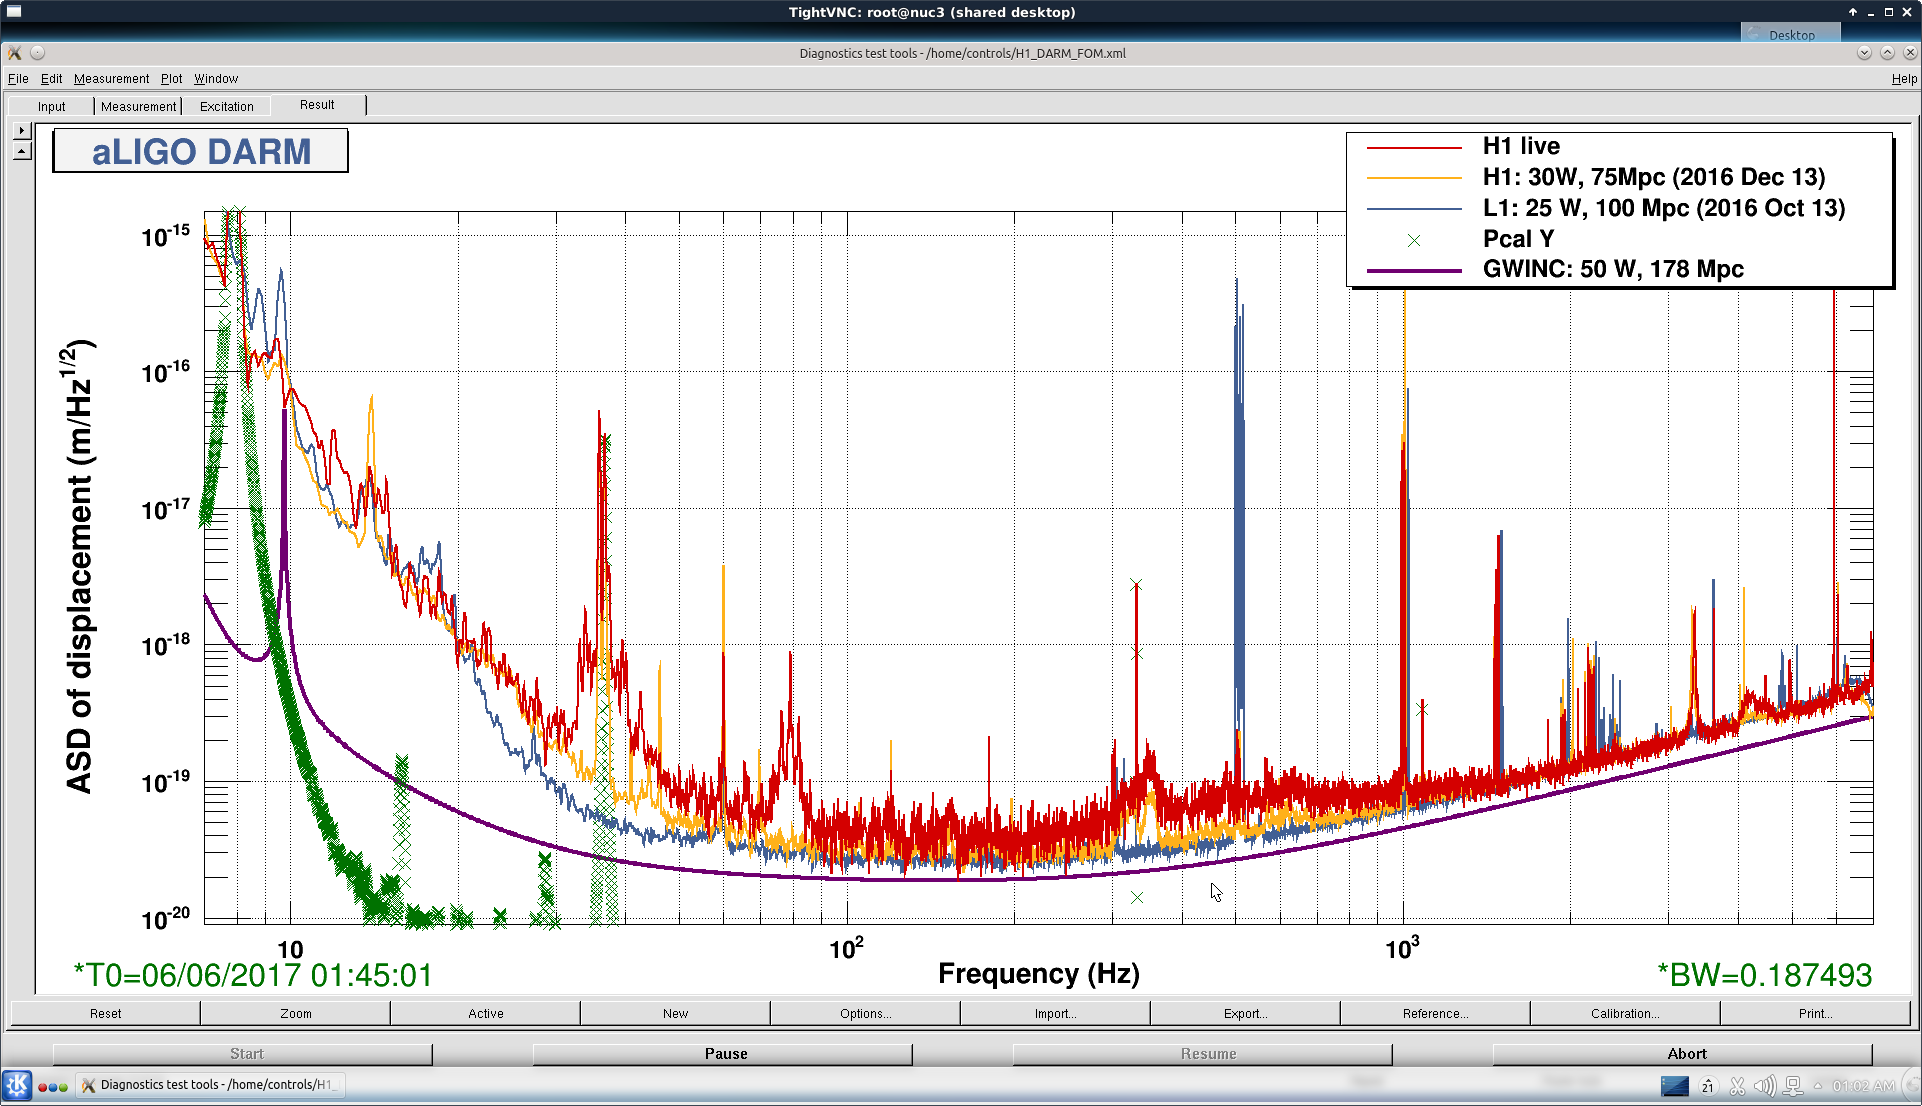
I have seen this before: alog 35173. If I recall, Jeff K. knew what it was, but I don't remember what he said.
Found it: alog 35184
What is rung up at 6kHz? That might be the problem.
Good question. Somehow I hadn't noticed that.

It is not there in the screenshot in the first alog I linked to (from when this happened before).
Well, maybe it is, but at a much reduced amplitude.
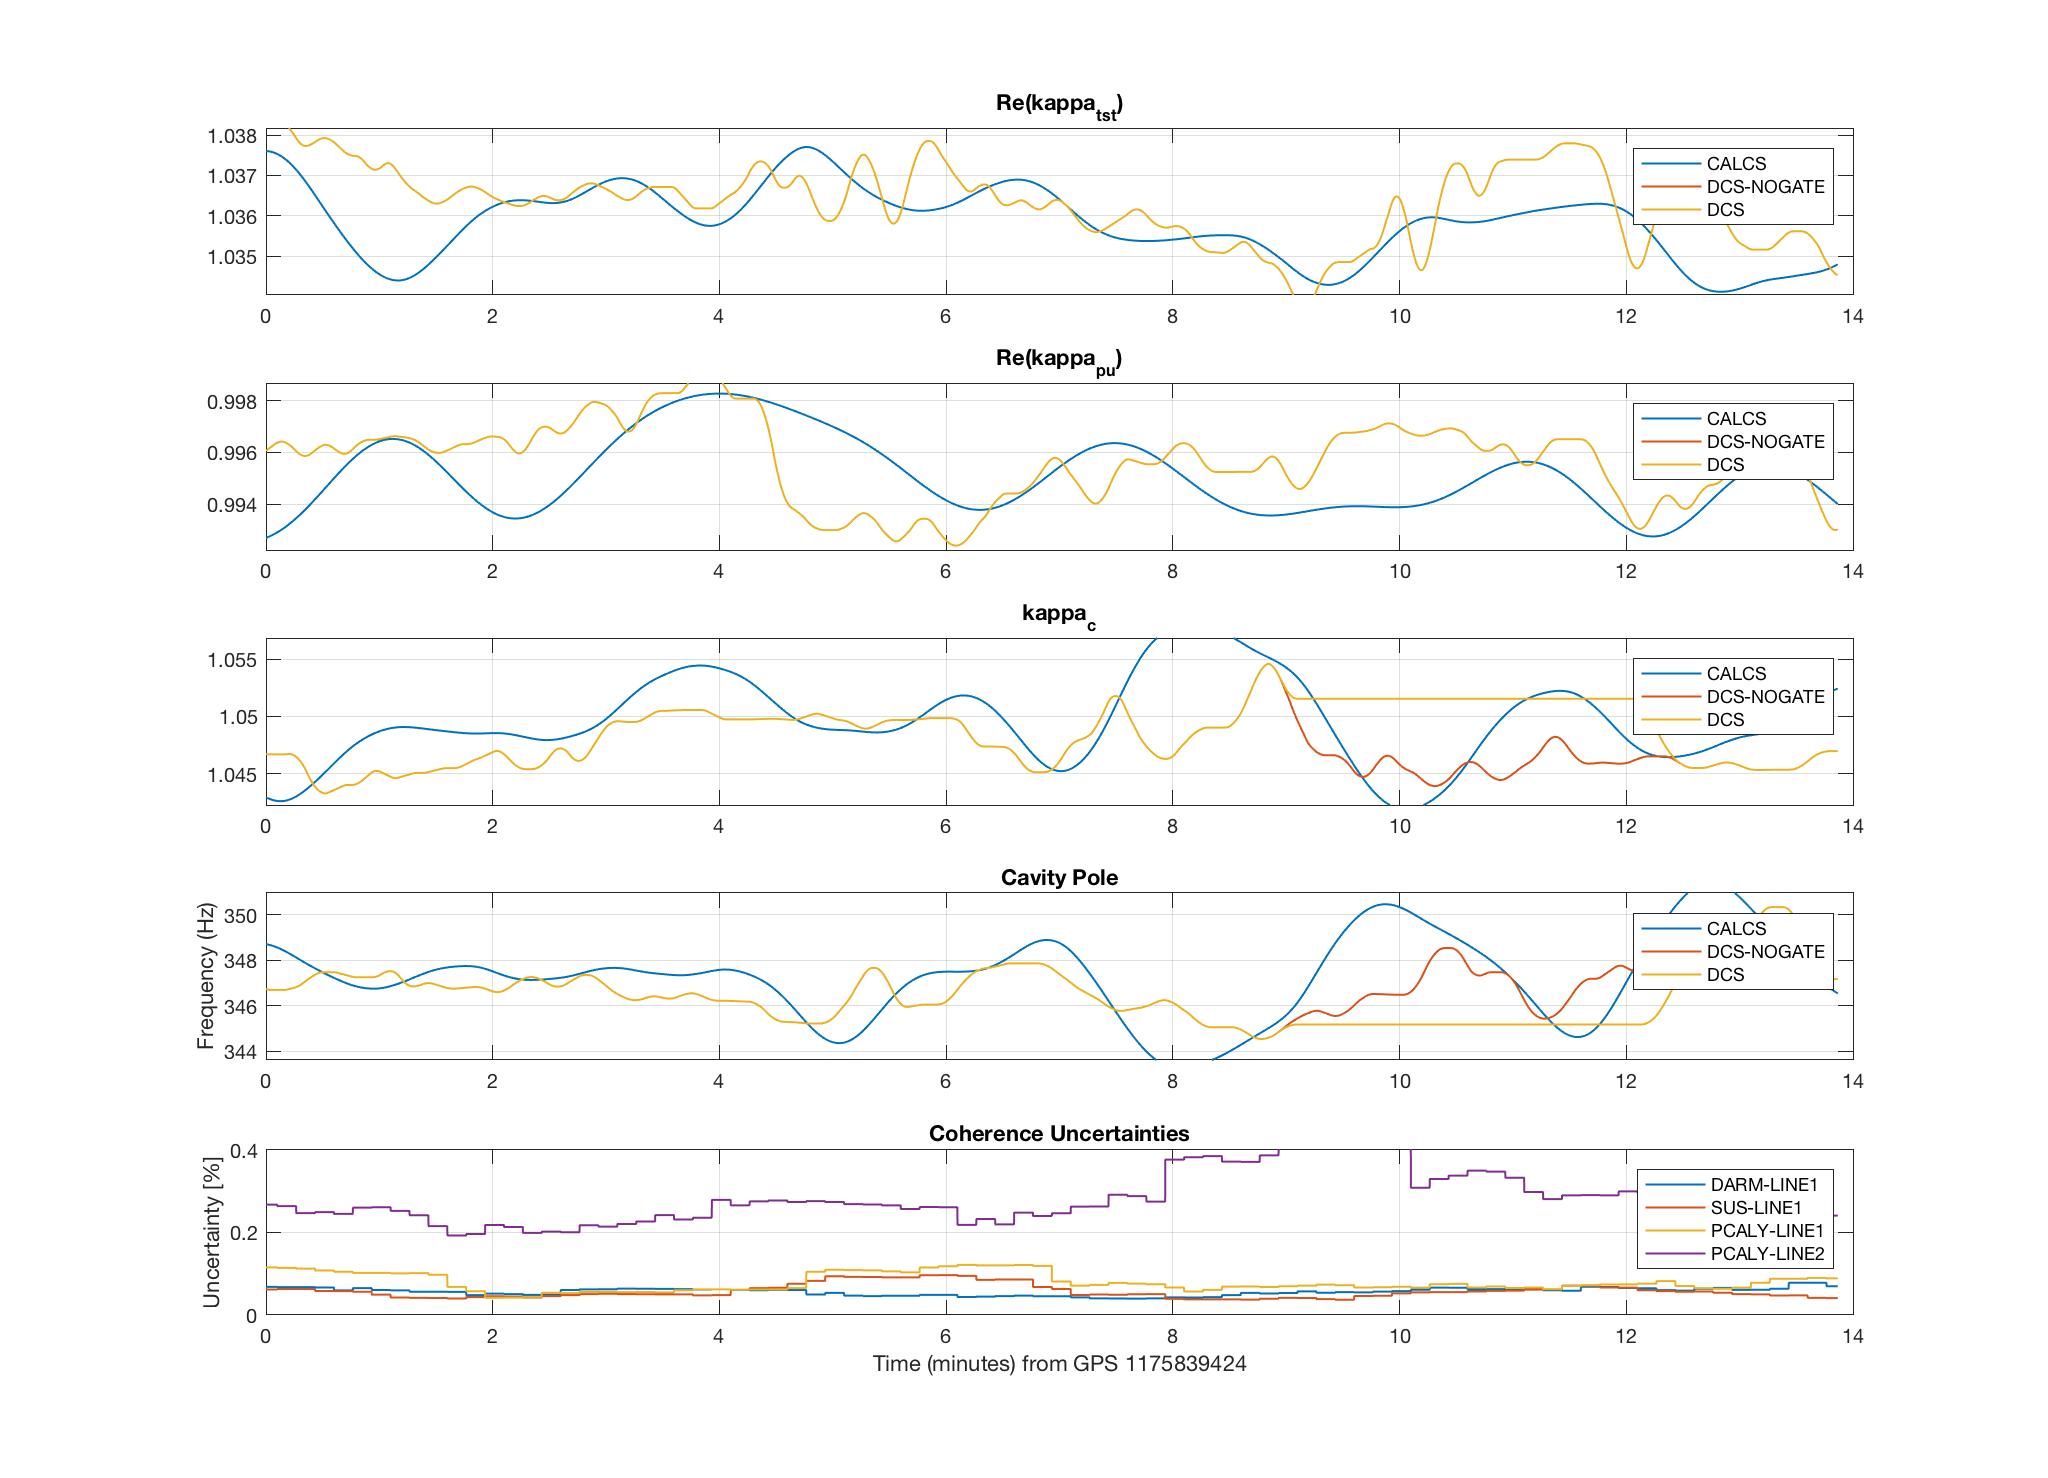
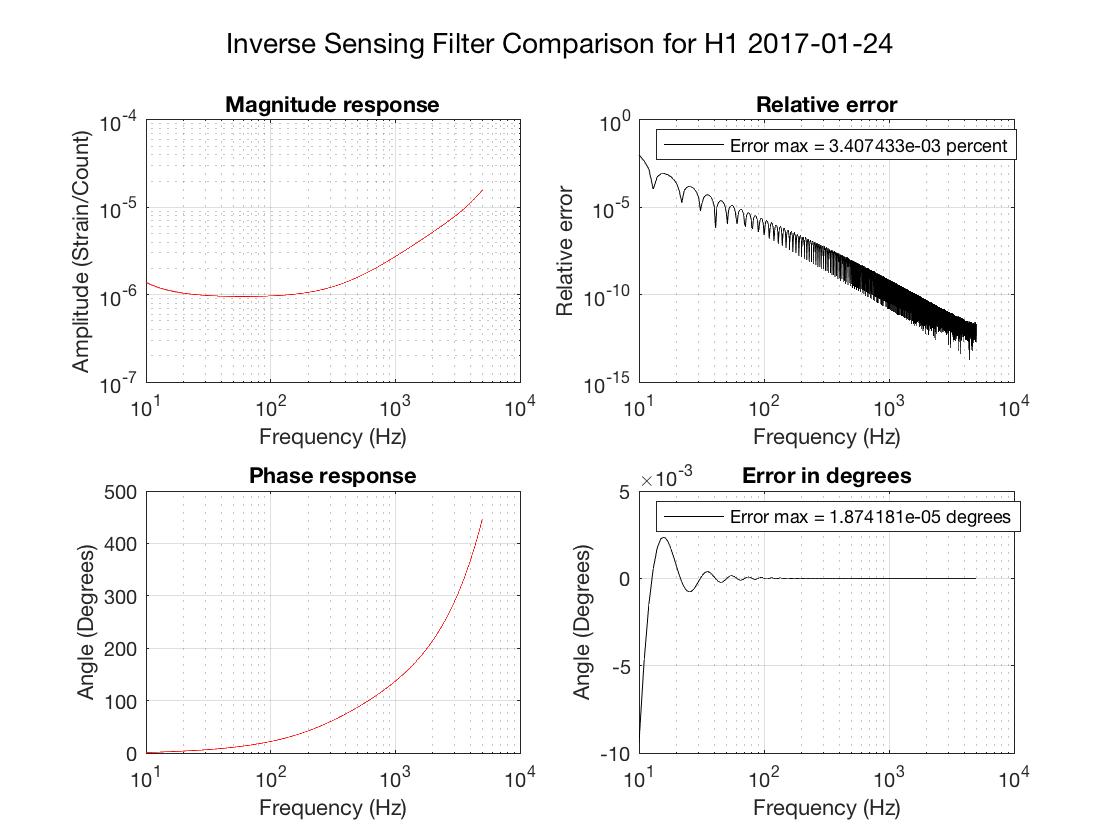
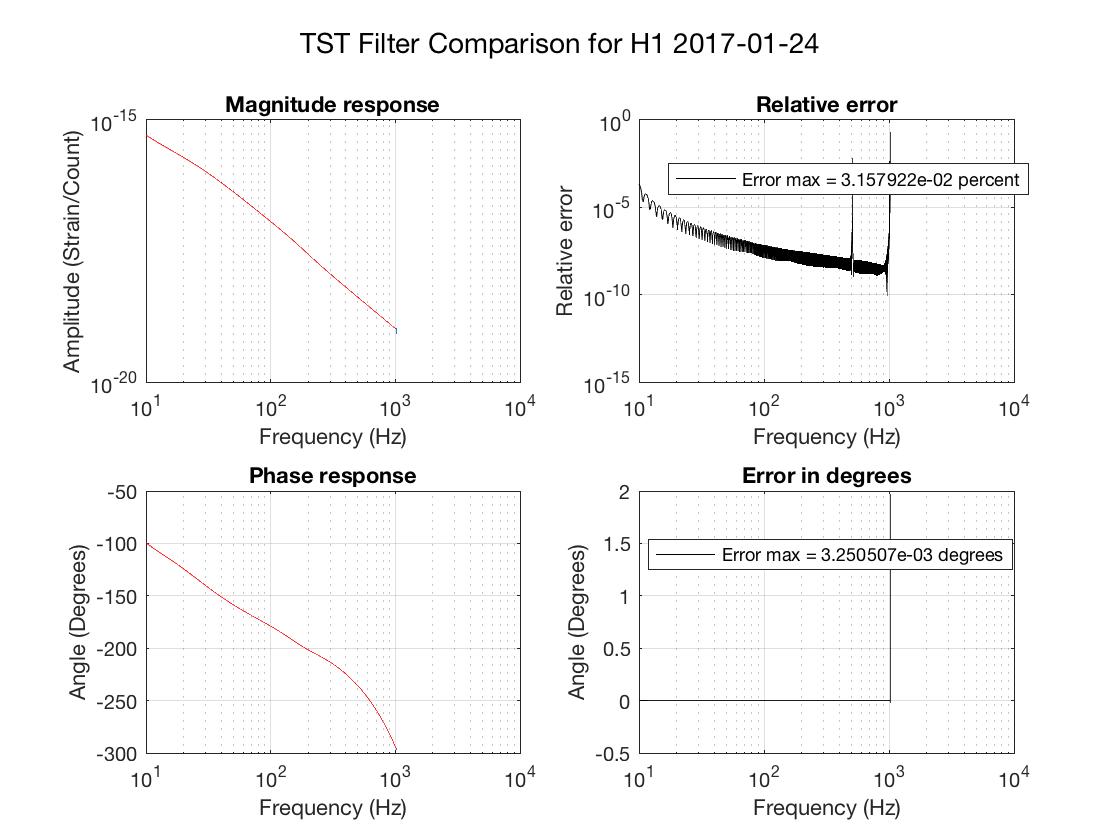
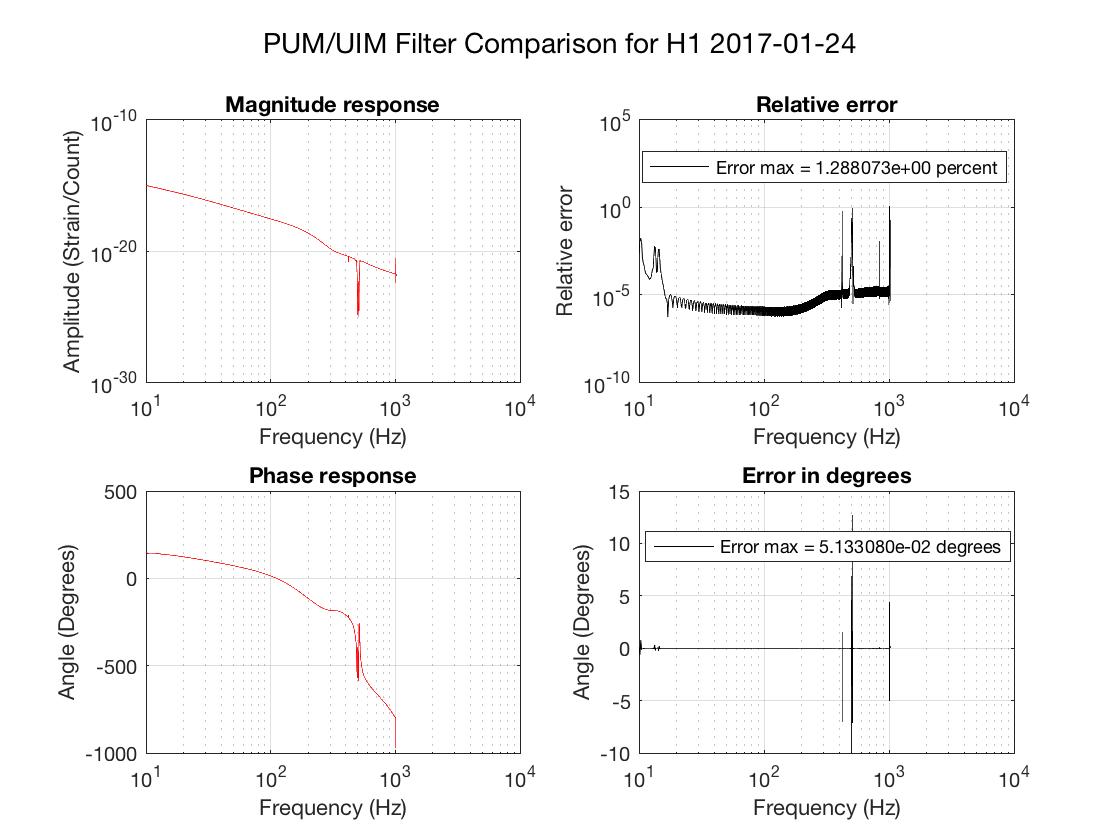
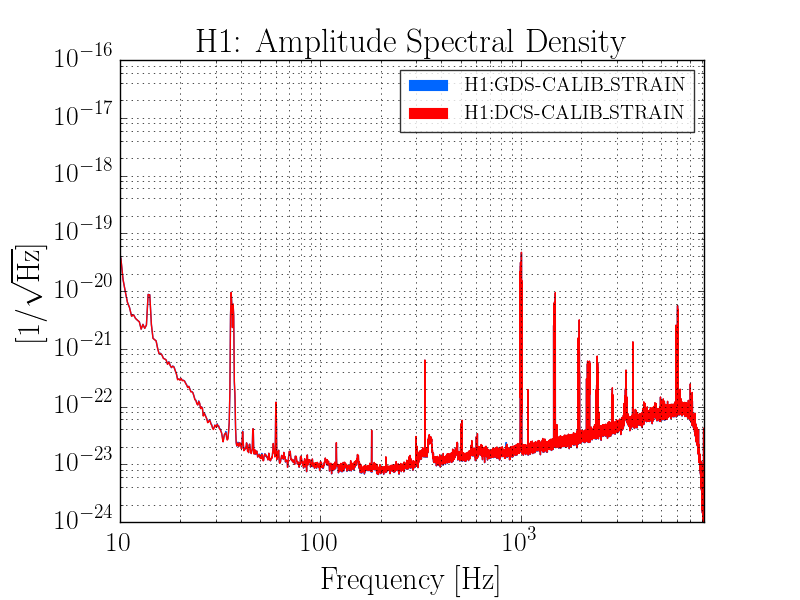
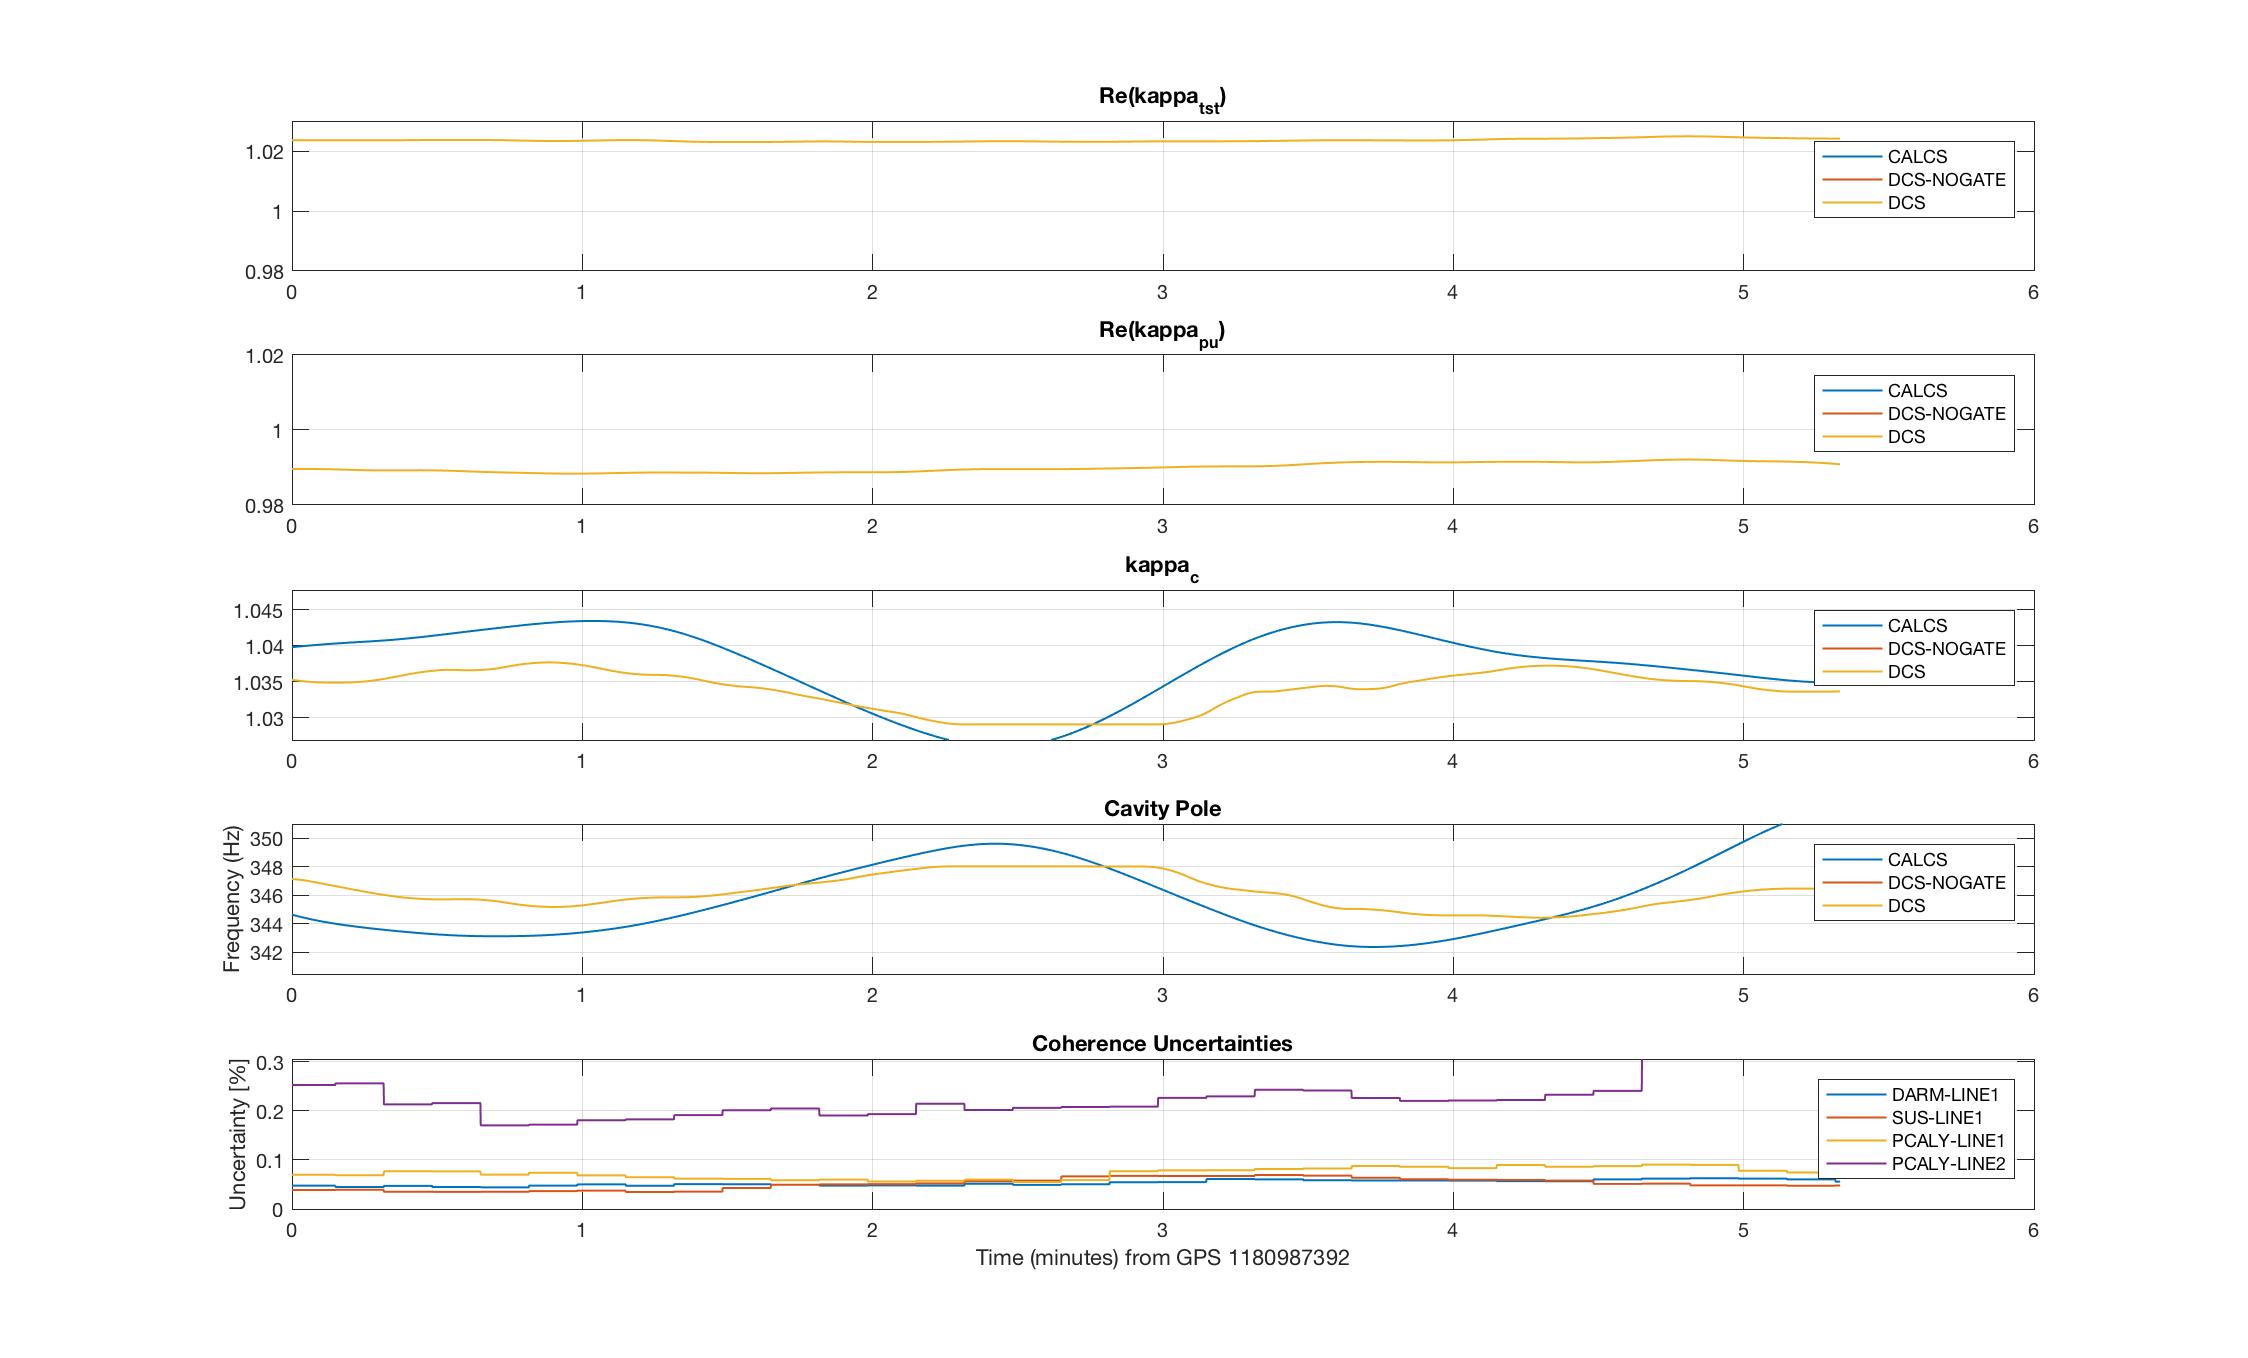
I have produced filters for offline calibration of Hanford data starting at GPS time 1173225472. The filters can be found in the calibration SVN at this location:
ligo/svncommon/CalSVN/aligocalibration/trunk/Runs/O2/GDSFilters/H1DCS_1173225472.npz

The new filters have EPICS and calibration line parameters for computing SRC detuning parameters. See
https://alog.ligo-wa.caltech.edu/aLOG/index.php?callRep=35041

For suggested command line options to use when calibrating this data, see:
https://wiki.ligo.org/Calibration/GDSCalibrationConfigurationsO2

The filters were produced using this Matlab script in SVN revision 4584:
ligo/svncommon/CalSVN/aligocalibration/trunk/Runs/O2/H1/Scripts/TDfilters/H1_run_td_filters_1173225472.m

The parameters files used (all in revision 4584) were:
ligo/svncommon/CalSVN/aligocalibration/trunk/Runs/O2/H1/params/2017-01-24/modelparams_H1_2017-01-24.conf
ligo/svncommon/CalSVN/aligocalibration/trunk/Runs/O2/H1/params/2017-01-24/H1_TDparams_1175954418.conf
ligo/svncommon/CalSVN/aligocalibration/trunk/Runs/O2/H1/Scripts/CAL_EPICS/callineParams_20170411.m
ligo/svncommon/CalSVN/aligocalibration/trunk/Runs/O2/H1/Scripts/CAL_EPICS/D20170411_H1_CAL_EPICS_VALUES.m

Several plots are attached. The first four (png files) are spectrum comparisons between CALCS, GDS, and DCS. GDS and DCS agree to the expected level.
Brief time series of the kappas and coherences are attached, for comparison with CALCS.
Time domain vs. frequency domain comparison plots of the filters are also attached.
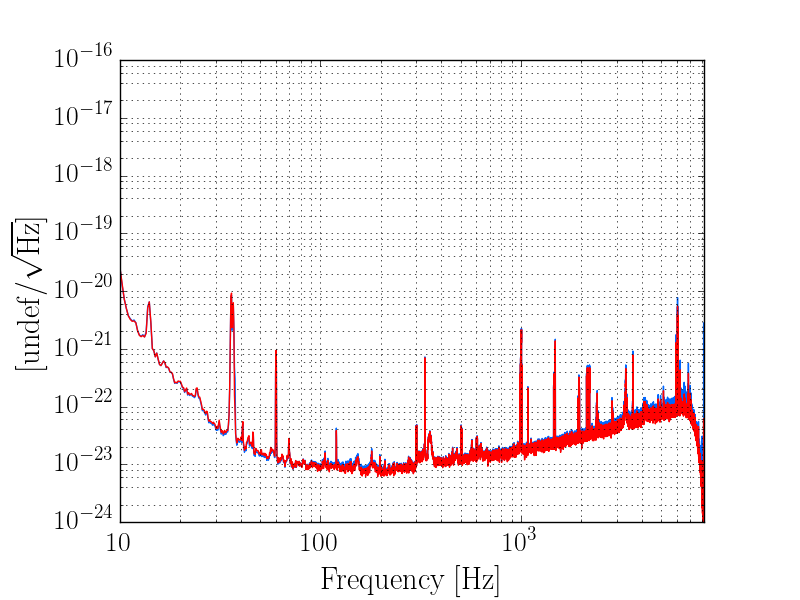
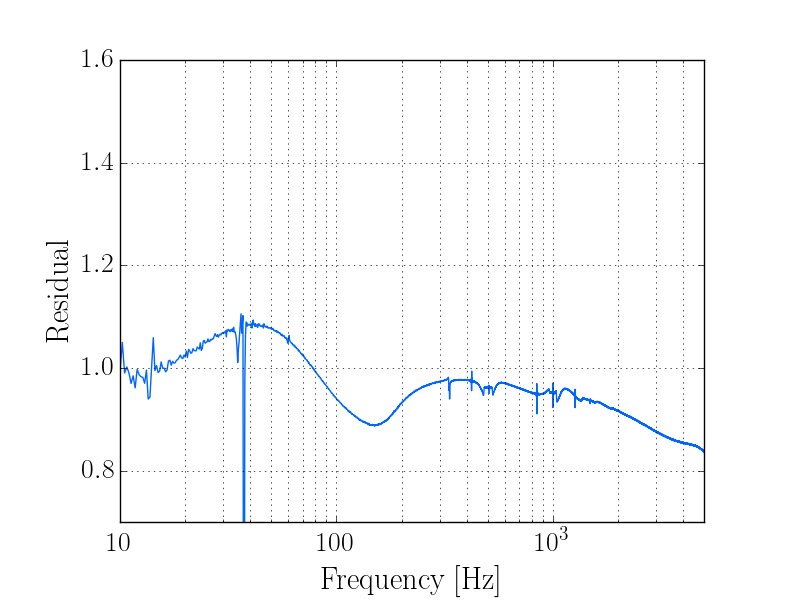
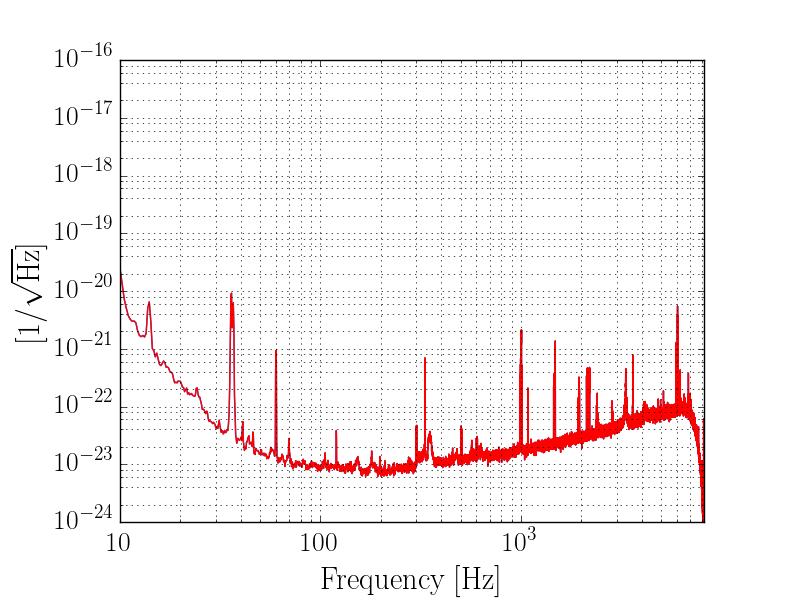
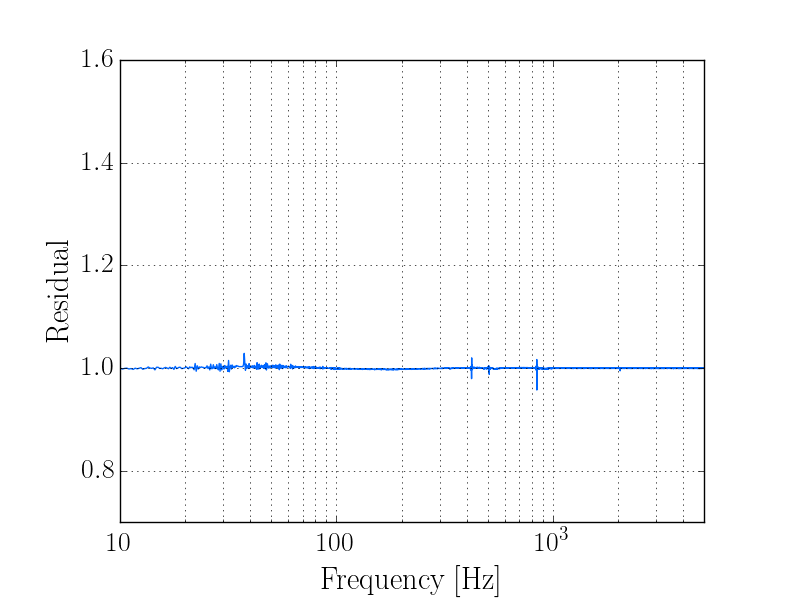
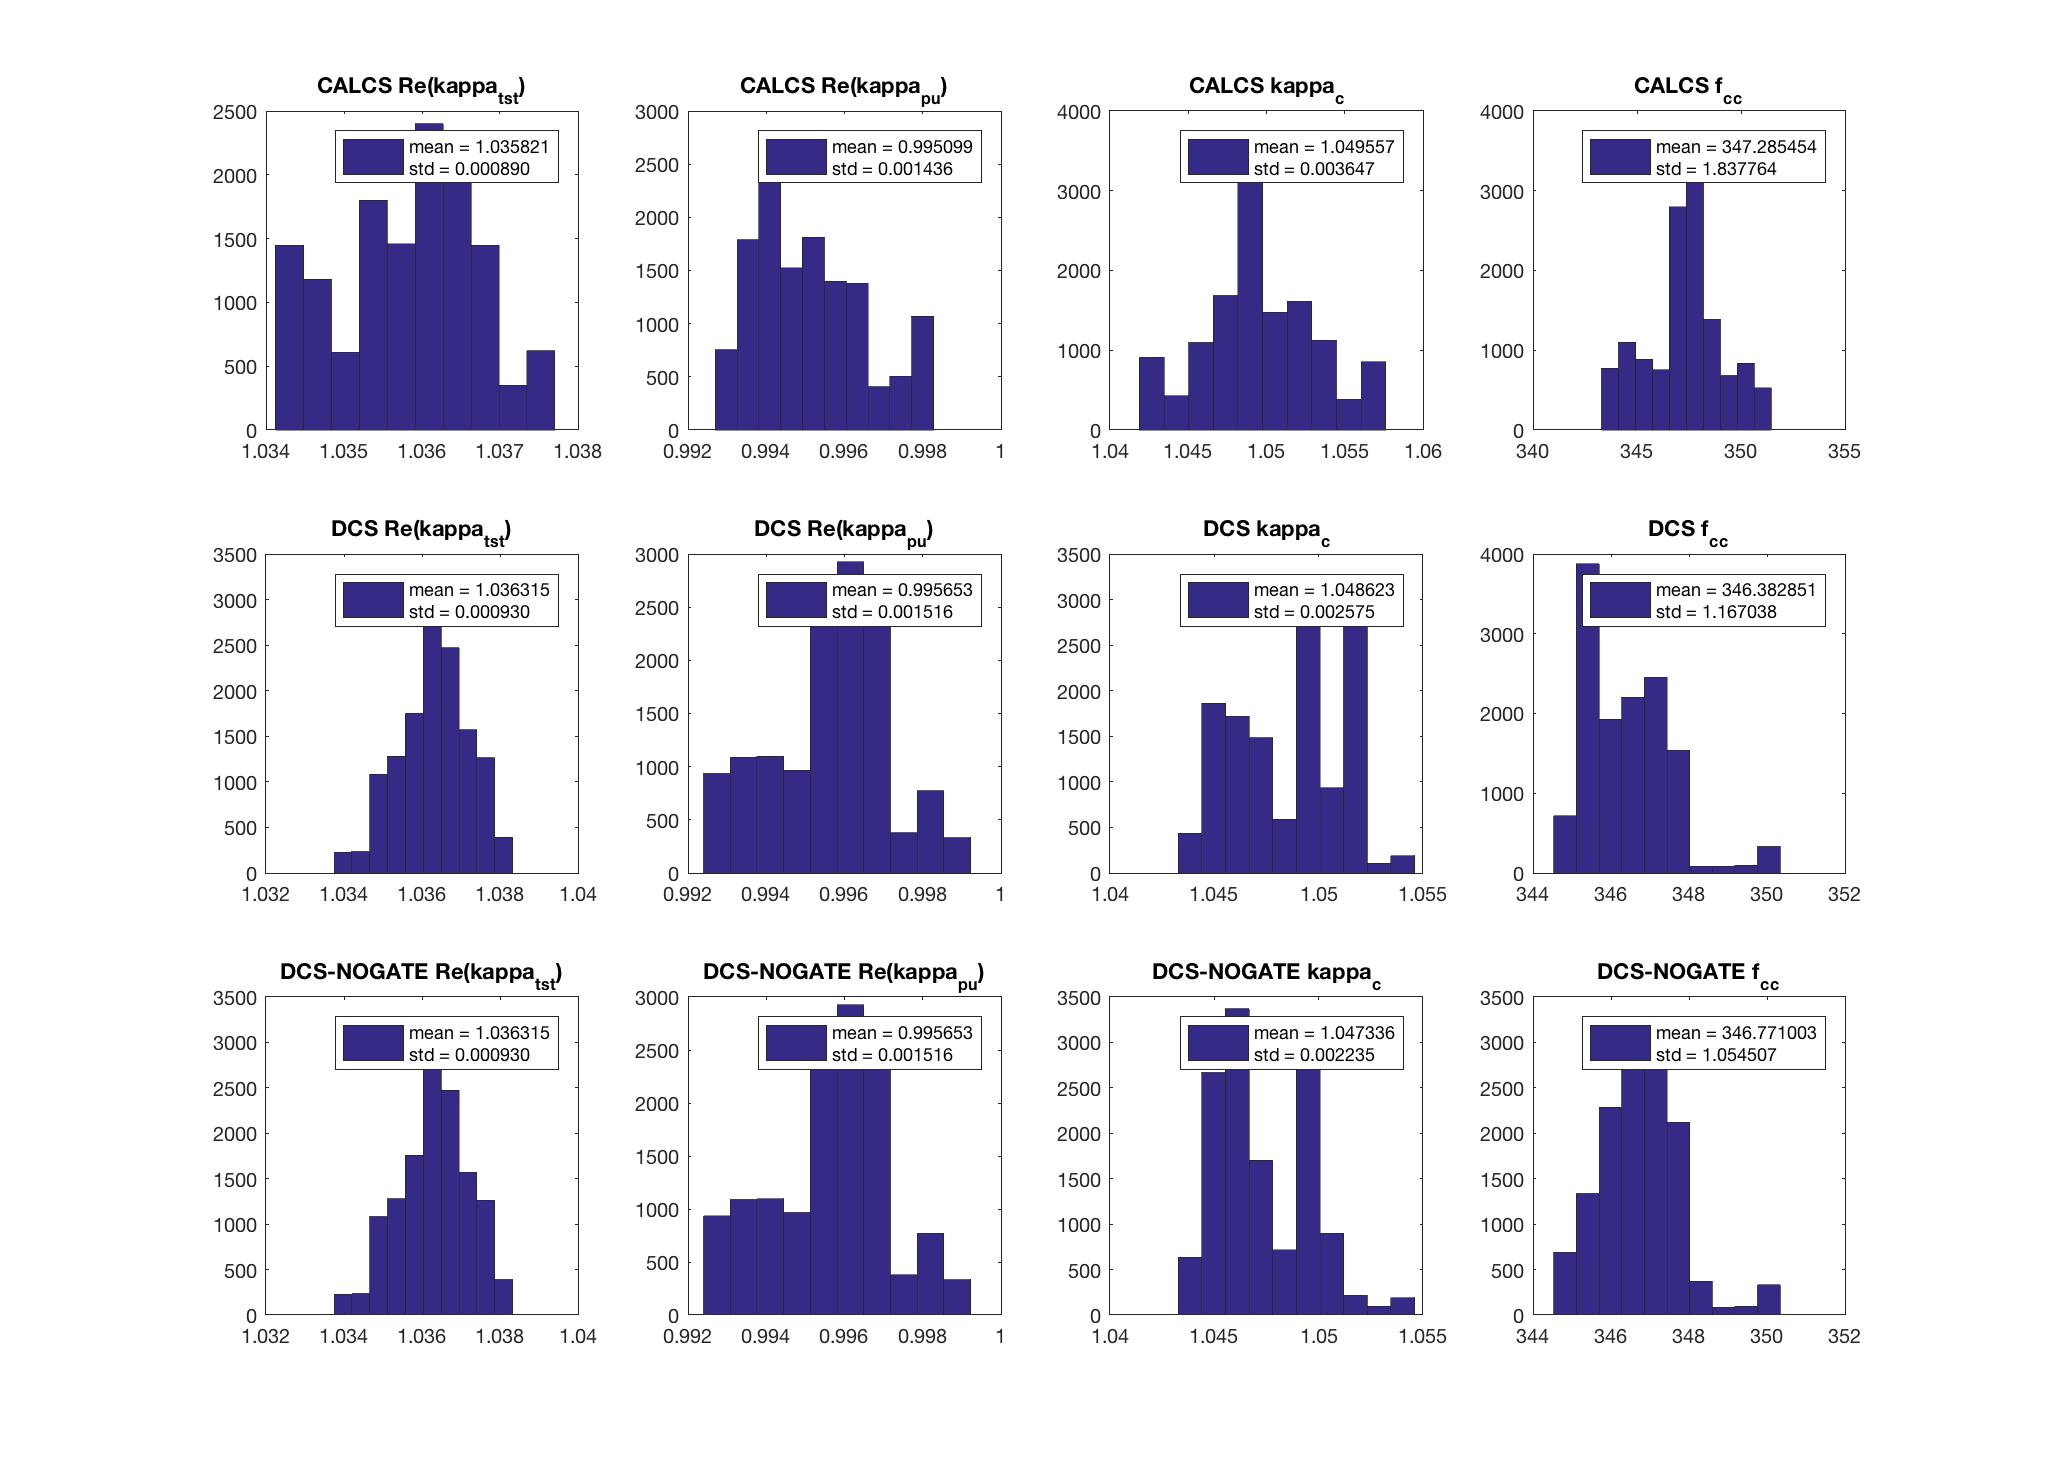
As a sanity check, I have calibrated data from early June to test whether these filters are up to date. Spectrum comparisons between the C00 frames and these filters are shown, and some unexpected discrepancy is noted at higher frequencies. Time series of the kappas are attached as well. These agree with the summary pages (i.e., the GDS pipeline).
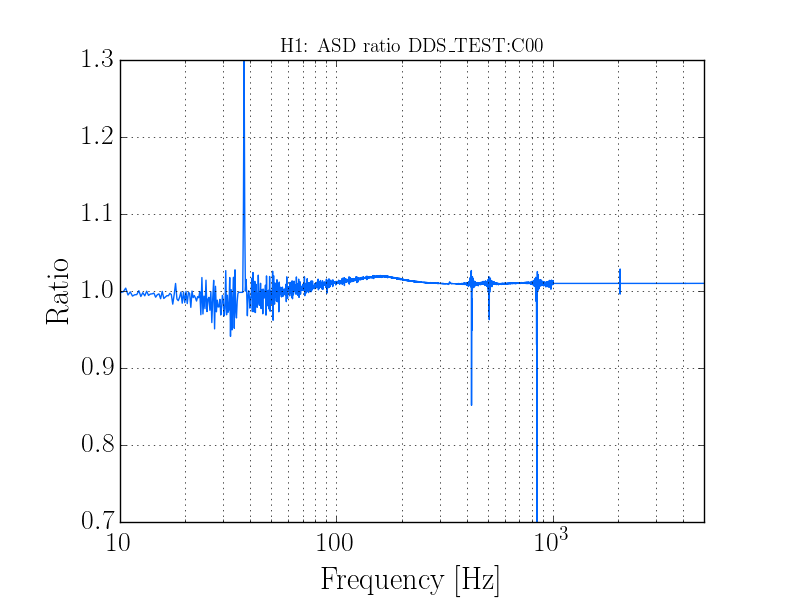
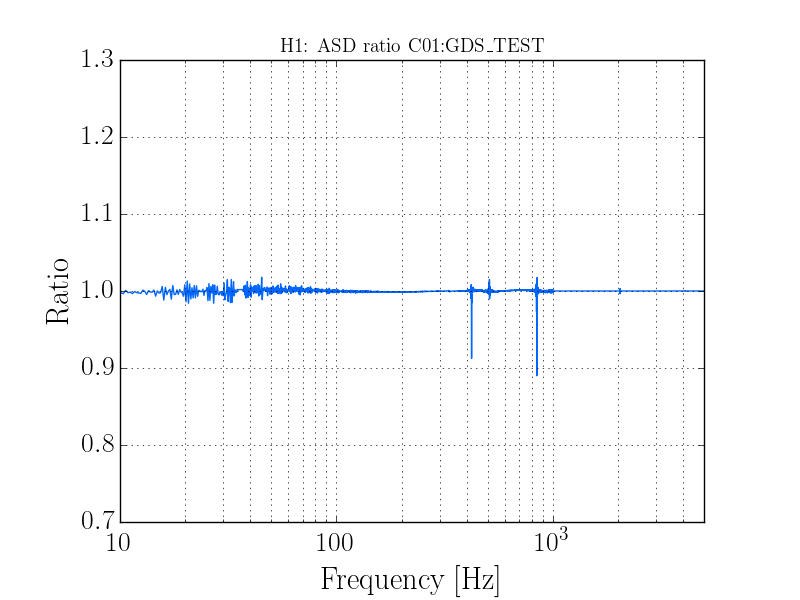
It is now evident that this change did not occur during the vent, as the attached ASD ratio plot is from C01 and C00 data from May 08, 2017 at 14:00:00 UTC (GPS 1178287218), right before the vent.
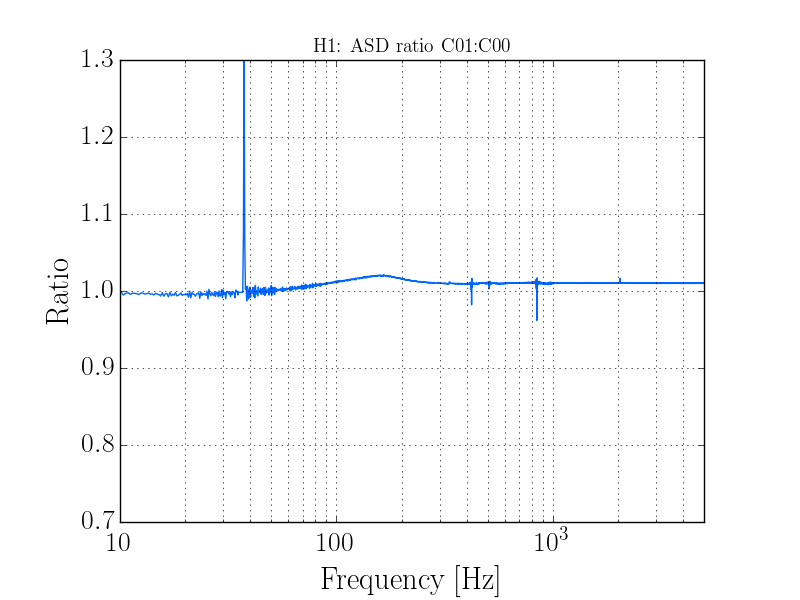
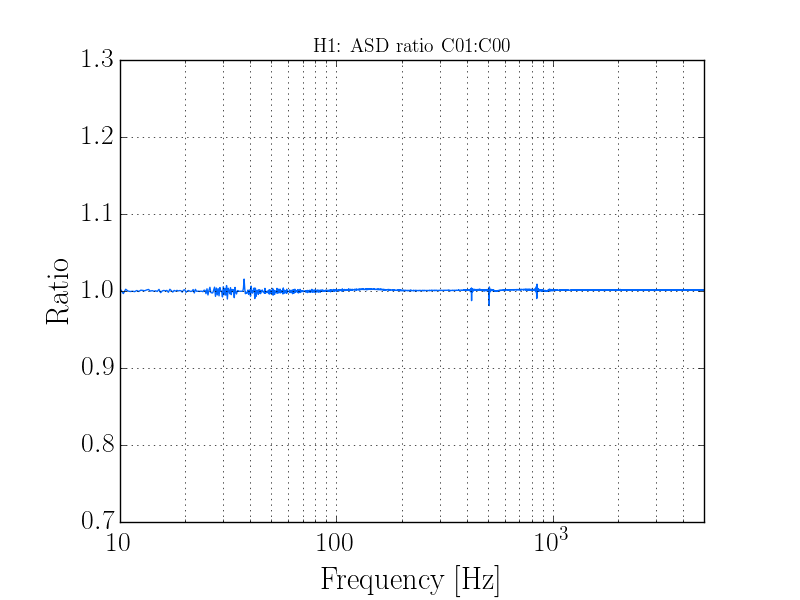
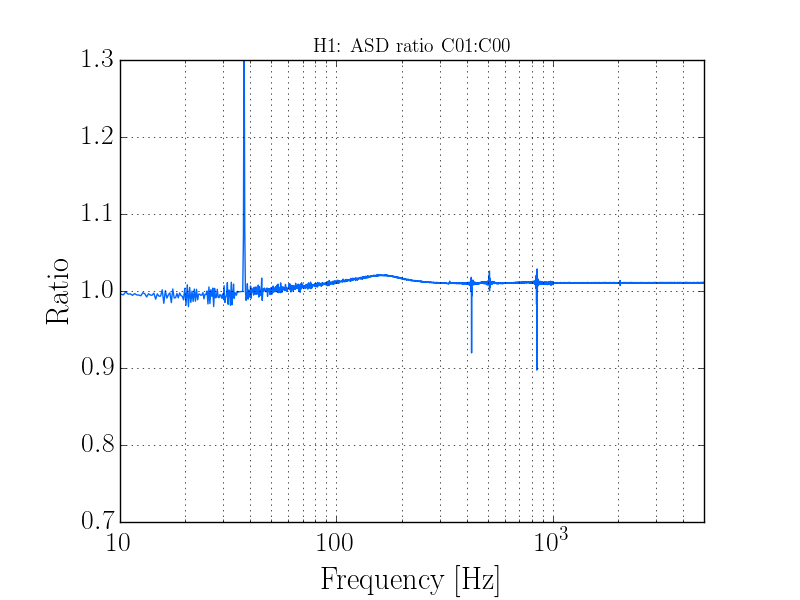
It seems this change occurred during maintenance on Tuesday, April 11. The first ASD ratio is from data right before maintenance activities, and the second is from right after. Also it is confirmed that this is not being caused by a difference in the applied kappas (so the EPICS records agree). The most likely culprit is a change in the inverse sensing filtering.
Relevant aLOGs around April 11th -- LHO aLOG 35474, and more specifically the comment, LHO aLOG 35476 which a "small change in writeEPICs code" is mentioned.

Can we compare the EPICs records committed to the repo around that time?
I traced the problem to the GDS filters installed on April 11: https://alog.ligo-wa.caltech.edu/aLOG/index.php?callRep=35462
Simply regenerating those filters seems to have fixed the problem, as shown in the attached ASD ratio plot comparing C01 to the corrected GDS filter output right after maintenance on April 11. The filters were generated as described in the above aLOG, except that the SVN revision was 4781, so the exact reason for the problem is unknown.

The C00 data affected by this problem starts on April 11 (GPS 1175976351), and it is still currently being affected, until we restart the GDS pipeline, no later than next Tuesday, June 20. The C01 frames are not affected by this and should be fine.
Trend over the past 8 days. Nominal adjusted to 21.5 dBm.