cheryl.vorvick@LIGO.ORG - posted 07:54, Wednesday 07 June 2017 (36698)
Ops Owl Summary:
- H1 to LOW NOISE ESD ETMY was consistant, but no NLN
- ROLL and Violins were high
I checked the Vacuum Site Overview MEDM screen and saw the telltale rise in pressure at the Y-mid station that is consistent with a warming 80K cyrogenic pump, I investigated and found that IP9 had tripped off so I restarted it. Only one of the two channels restarted. The other channel is inop. While on site I overfilled CP4 by opening the LLCV manual bypass valve 1/2 turn. LN2 was observed at the exhaust outlet in a total of 38 minutes.
C
Leaving UHP GN2 regulator output set at 40 psig and flow limitied to 2 LPM.

0355 hrs. local -> Kyle leaving site (this time for real).  Cheryl V. in CR
Thank you, Kyle and Gerardo, for responding. Tagging VE.
Remote logged in at around 7:00 utc, determined that IP9 had tripped, notified Kyle who was already manually filling CP4 (first time).
At the same time I noticed that I had not fully restored CP4 fill control screen and the power for LLCV was still disabled (which is very easy to miss), at this time I enabled the power and restored all values, this screen was not restored due to a wrong burtrestore file, see Patrick's earlier aLOG.
as of 7:100UTC:
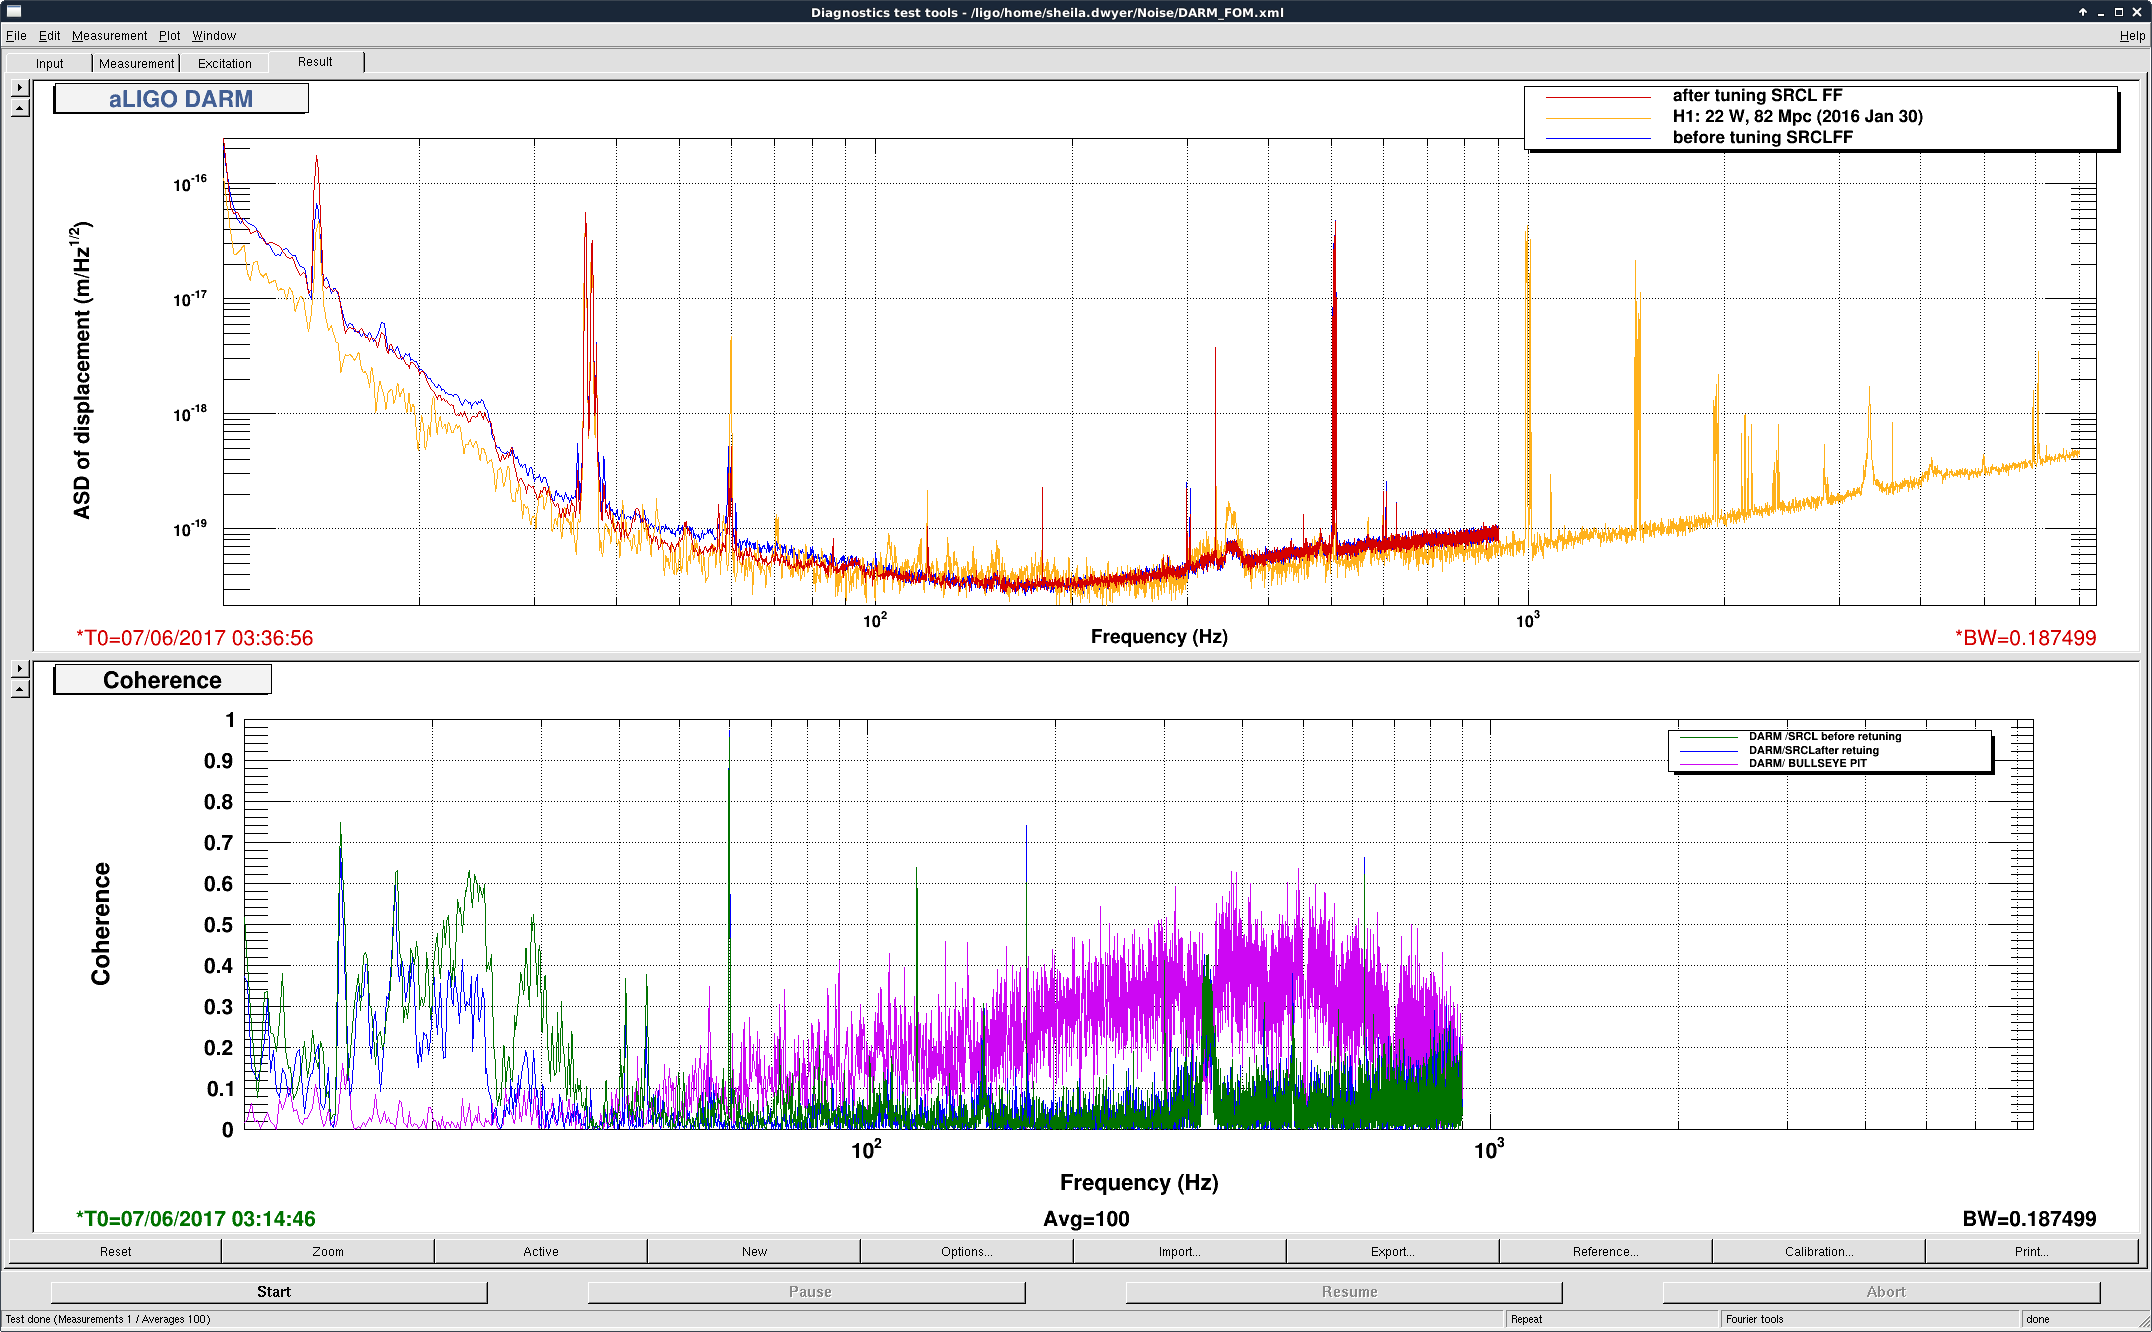
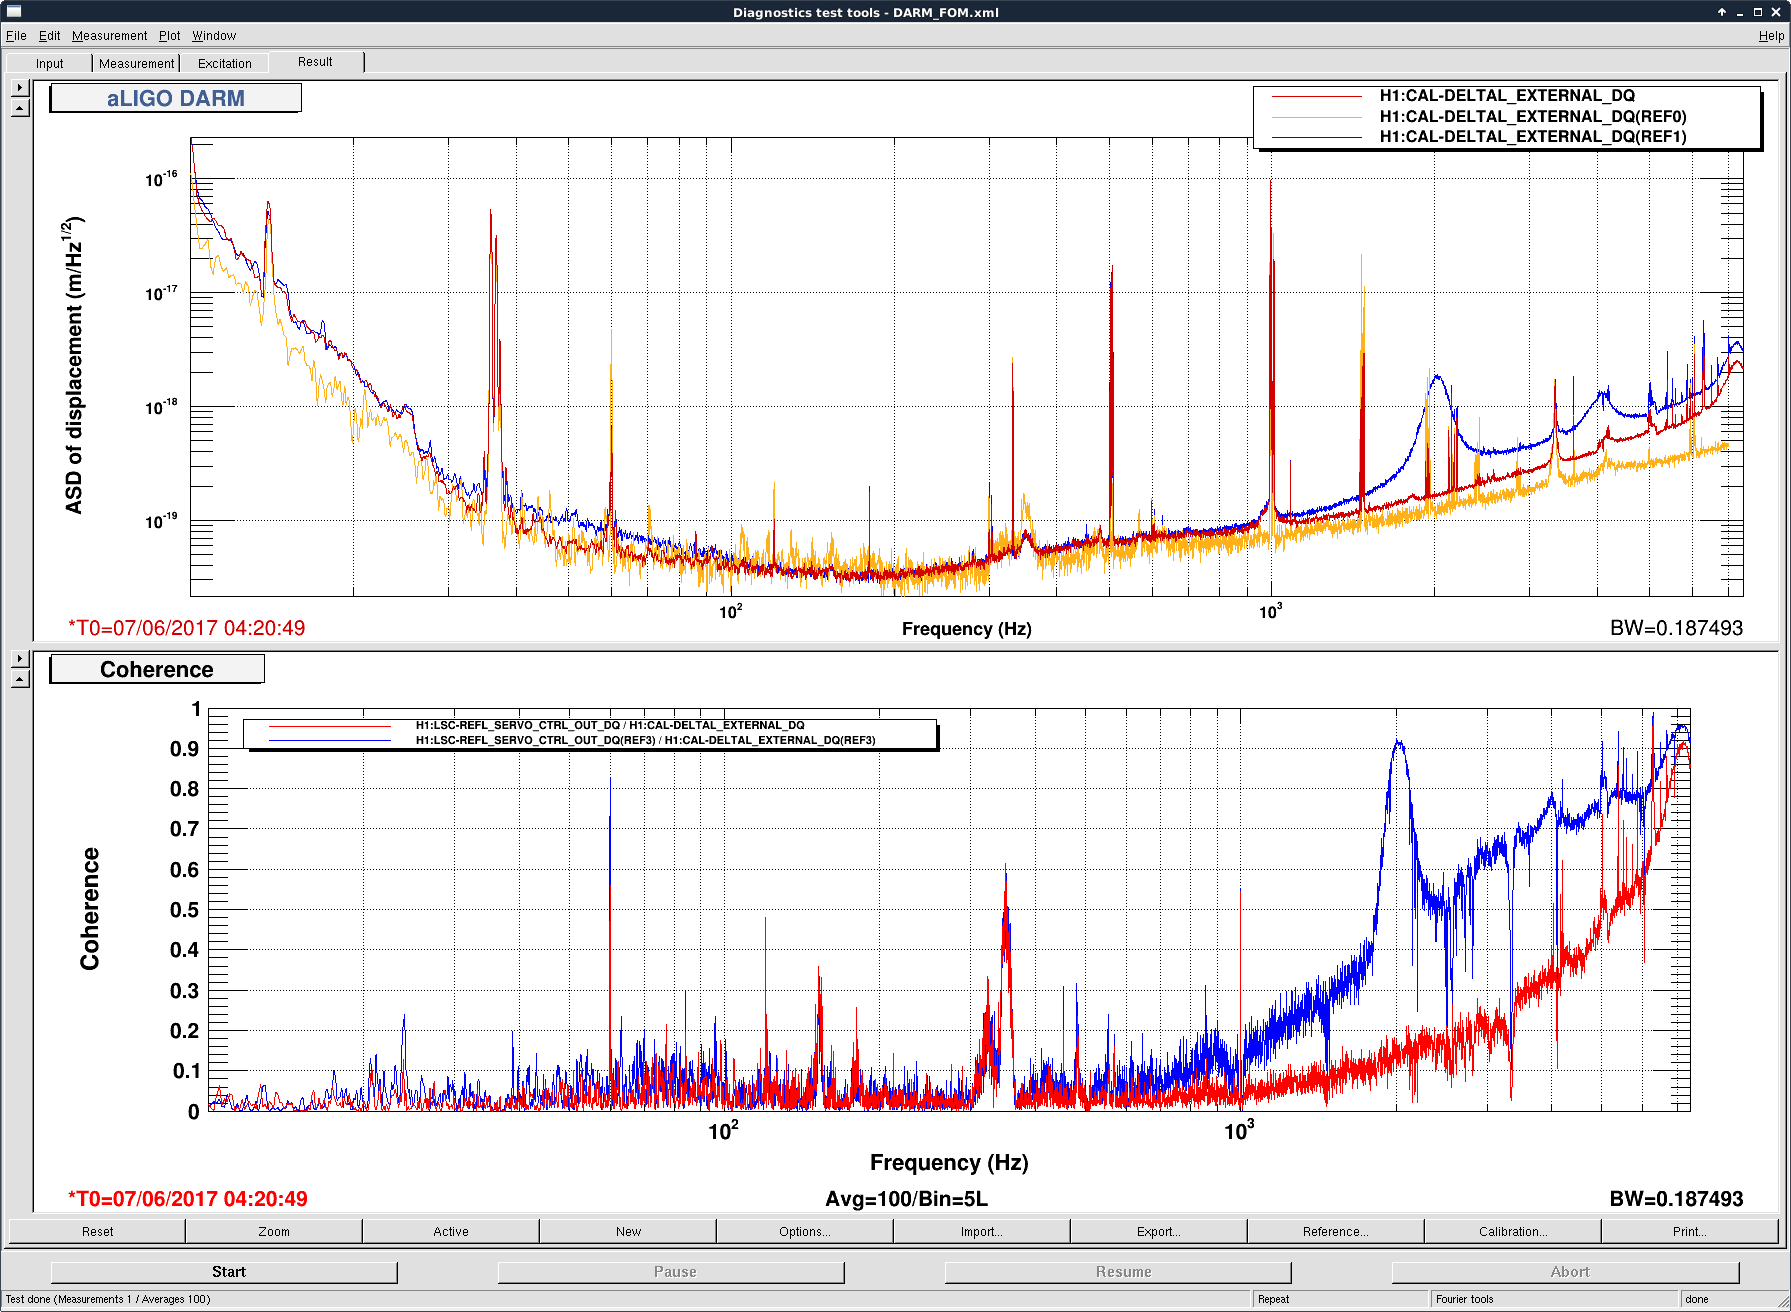
Summary: Tonight we are able to lock reliably and stay locked with 60 Mpc range.
The noise lump that is coherent with the PSL Bullseye sensor is back. We hadn't seen this since the vent, and I am wondering if it could be related to the PSL work today.
Notes for whomever next locks:
The guardian can be used as is to get to REDUCE_RF9_MODULATION_DEPTH. For now we need to manually skip SRM_ASC_HIGHPOWER, do NOISE_TUNNINGS as it is written in the guardian, and skip CLOSE_BEAM_DIVERTERS. The next things I would try are to explore a little more with POP spot position (usig PR3 spot move) and soft offsets to see if we can reduce the jitter lump, or improve the recycling gain. The 6dB increase in CARM (LSC-REFL_SERVO) IN1 gain is not in the guardian, it could be done manually about 20 minutes after locking. It might be necessary to run an initial alignment after all the alignment changes I have tried.
I have crashed 3 computers in a row tonight. Is this because of sometime that happened during maintence day?
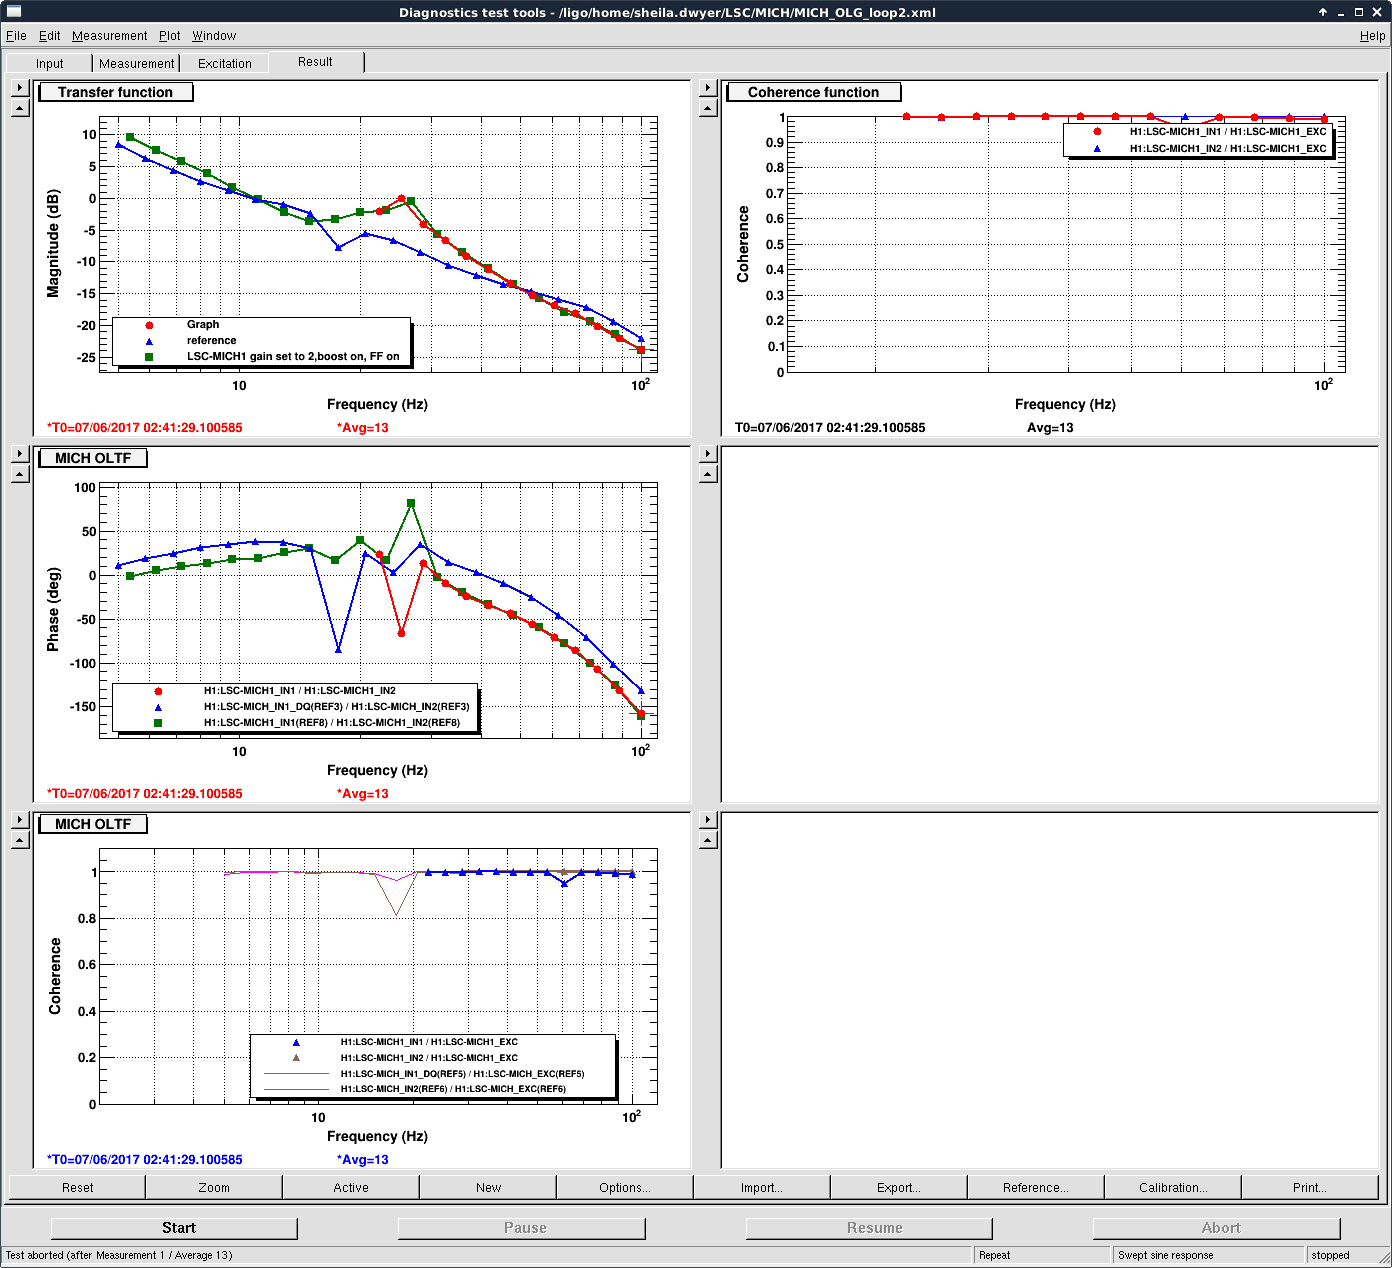
Sheila, Jim
We had some issues with one of the PI modes tonight. Mode 26 rang up and took some careful wrangling to get damped back down. The first issue we found was that the BP and PLL frequency were both off, so we selected the 15009hz (FM1) and tuned the PLL frequency appropriately. However, the mode was still unresponsive to the normal phase tweaking and broke the first lock. When we got back up, we missed waiting at DC readout for the PI to settle back down, so we ended up having to damp 2 or 3 modes simultaneously. Fortunately everyone but mode 26 were easy customers. Mode 26 required careful tweaking of the phase and Sheila eventually increased the gain to 15000 from 4000. The mode was also kind of slow to respond so zooming in on the rms strip tool helped differentiating good from bad phase tweaks.
[John, Chandra]
Closed WP 7021
We tested CP4's LN2 vaporizer for leaks by first blanking the exit of vaporizer with 15 psig pressure relief valve (works) and gauge. Pressure held at around 10 psi with LN2 bottom draw valve fully open. Then we connected the new flow meter at outlet and let LN2 flow freely for ~30 minutes. We tried to increase the flow rate by increasing Dewar pressure but realize this can take days. The highest flow rate we saw on meter was 5,000 SCFH, but it mostly ran closer to 2,000 SCFH. PSI procedure calls for 5,300 SCFH for regenerating short CPs. No cracks found in CP4 vaporizer. No visual cracks in CP3 vaporizer (not pressure tested yet). CP 5,6 do have cracks in the aluminum at inlet and outlet. Bubba thinks he can fix the welds: FRS 8282.
CP4 regeneration line now has a new flow meter and is properly reassembled.
Since last week, we have been applying 40-60 psi of GN2 through rotameter to the bottom sensing line on CP4 in an effort to "erode" the blockage. It appears we have a passage, but the blockage is not completely gone. Today John and I played around at the pump and found the differential pressure transducer reads back 100% on CDS (Beckhoff limit). The Magnehelic had been overpressurized, and wasn't matching CDS, so I swapped it with a new one. When valved in, it slowly creeps up to ~ 30 in. of water (38" = 92% full), along with CDS read back, but there is a leak in the fitting. So we left it valved out. When we combine the two sensing lines, CDS reads 0%. When we isolate them, it reads 100%, but the reading slowly increases from 0-100% rather than an instantaneous jump - even with Mag valved out, so we think we have a partial pathway across the blockage yielding poor conductance.
We canceled the auto overfill today and set the LLCV to 20% open for about six hours (nominal is 41%) hoping to see it come on scale. At around 5pm local we raised it to 38% to sustain over night. We will watch it periodically and revisit tomorrow. We may try to apply up to 200 psi of pressure on sensing line (bypass rotameter) to fully clear the clog.
CP4 was last overfilled yesterday at 11:16 am local.
I fixed the leak at Mag. It now reads 47" which correlates to 114% full. CDS reads 100% full (Beckhoff limit).
Leaving Mag valved in overnight.
J. Oberling, P. King, E. Merilh
Today we swapped Diode Box 1 (DB1) for the PSL HPO with a spare shipped up from LLO. The swap was relatively painless, although we did have a delay in attempting to extract a rounded screw from the lid of the "new" diode box. Once that was taken care of the DB was installed in the PSL LDR. We then turned only DB1 on with 20A of current. Using an IR camera we confirmed that none of the fiber connections were overheating (all were <23 °C). The PSL was then restarted.
For the new DB, we used an operating current of 49.3 A and set the temperature setpoints for the individual diodes to 29 °C. The HPO came up with zero issues. We then rotated each fiber connecter in the DB to maximize the power output by the HPO (unscrew the connector just enough so the fiber can rotate, rotate to maximize power, re-tighten connector). Once this was done DB1 was closed and we slid it into place in the rack. The 35W FE was restarted and injection locking engaged; the PSL was left to warm up in this configuration for ~1 hour.
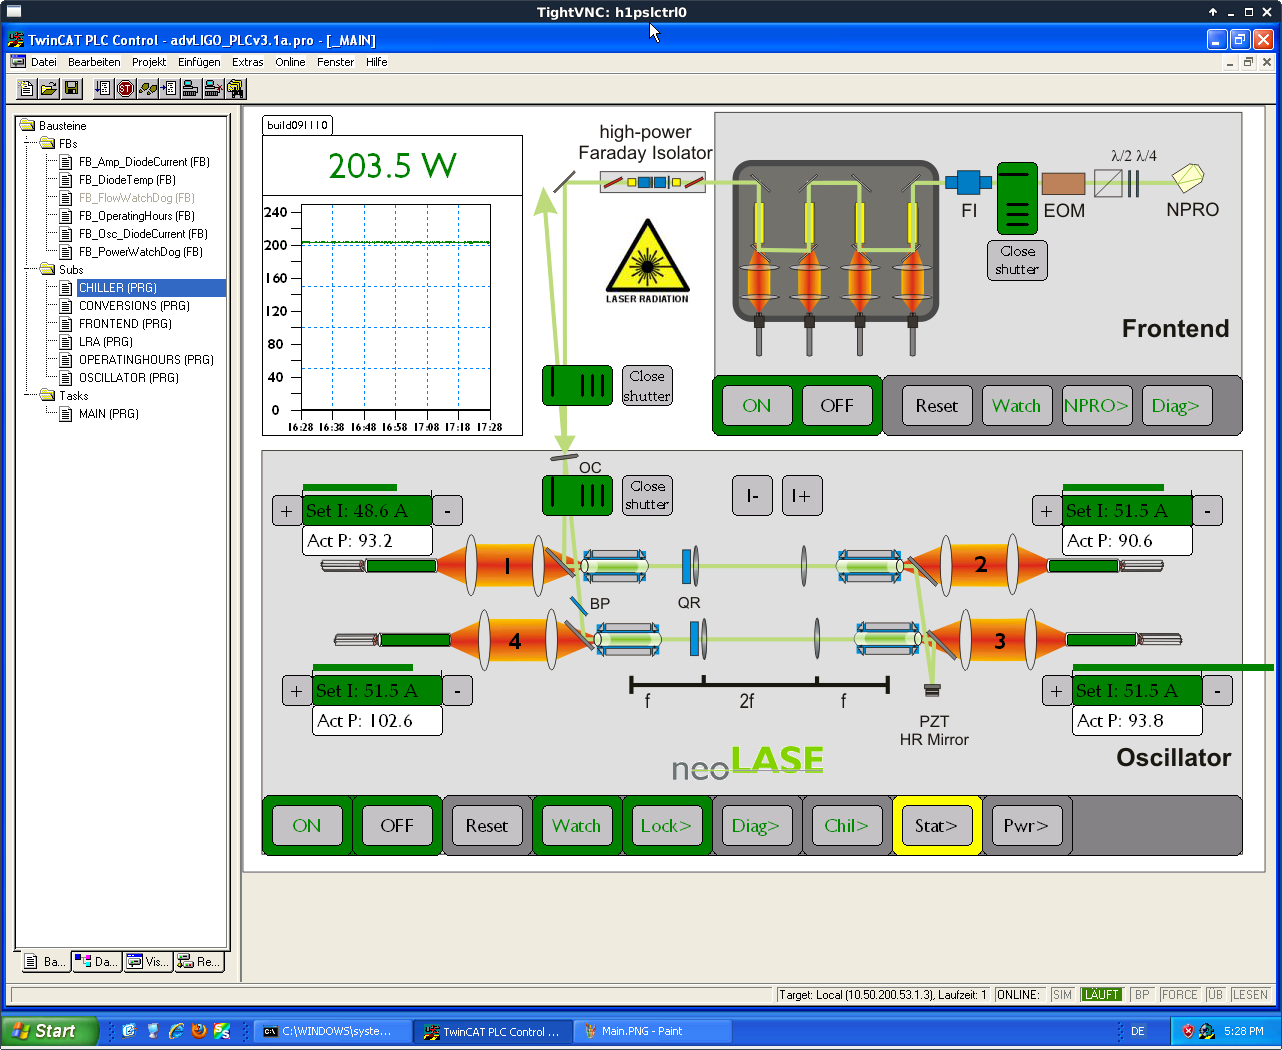
After the warm-up period, the pump diode operating current and temperatures were adjusted to incorporate the new DB. The temperatures of the diodes in DB2, DB3, & DB4 were unchanged; the temperatures of the diodes in DB1 were changed to 28 °C. The operating current of each of the 4 DBs is summarized below (a screenshot is attached for future reference):
The PSL is now outputting ~158 W, and the PMC is transmitting ~60 W. The PSL is now fully recovered from the DB swap and functioning as it was before work began. The SN of the old DB is OBS2-DB1, the SN of the new DB is OBS1-DB1.
This closes LHO WP 7019. Incidentally, this work also completes FAMIS 3653 (Weekly PSL Power Watchdog Reset) and FAMIS 8425 (PSL Weekly HPO Pump Diode Current Adjust).
TITLE: 06/06 Day Shift: 15:00-23:00 UTC (08:00-16:00 PST), all times posted in UTC
STATE of H1: Planned Engineering
INCOMING OPERATOR: Jim
SHIFT SUMMARY:
Maintenance Day went until about 22:00UTC (3pmPDT) with biggest activity was the PSL going down for HPO Diode swap out. See other activities below.
After Maintenance, ran an INITIAL ALIGNMENT and had no issues. Started locking and made it to DRMI with no issues (aligned PRMI first). Handed off to Jim & Sheila for evening commissioning.
LOG:
Notes:
WP 36629
This morning the ALS common mode spare chassis S1102633 was pulled and original chassis S1102632 was re-installed. Units were swapped last week to help with ALS glitch hunting. See alog 36622.
The IQ FET demodulator chassis S1000779 was pulled for repairs. Alog 36629 reported CH1 having a 5V offset on the I-signal output. Unit was repaired, AD829 IC's had to be replaced on both boards to remove offset.
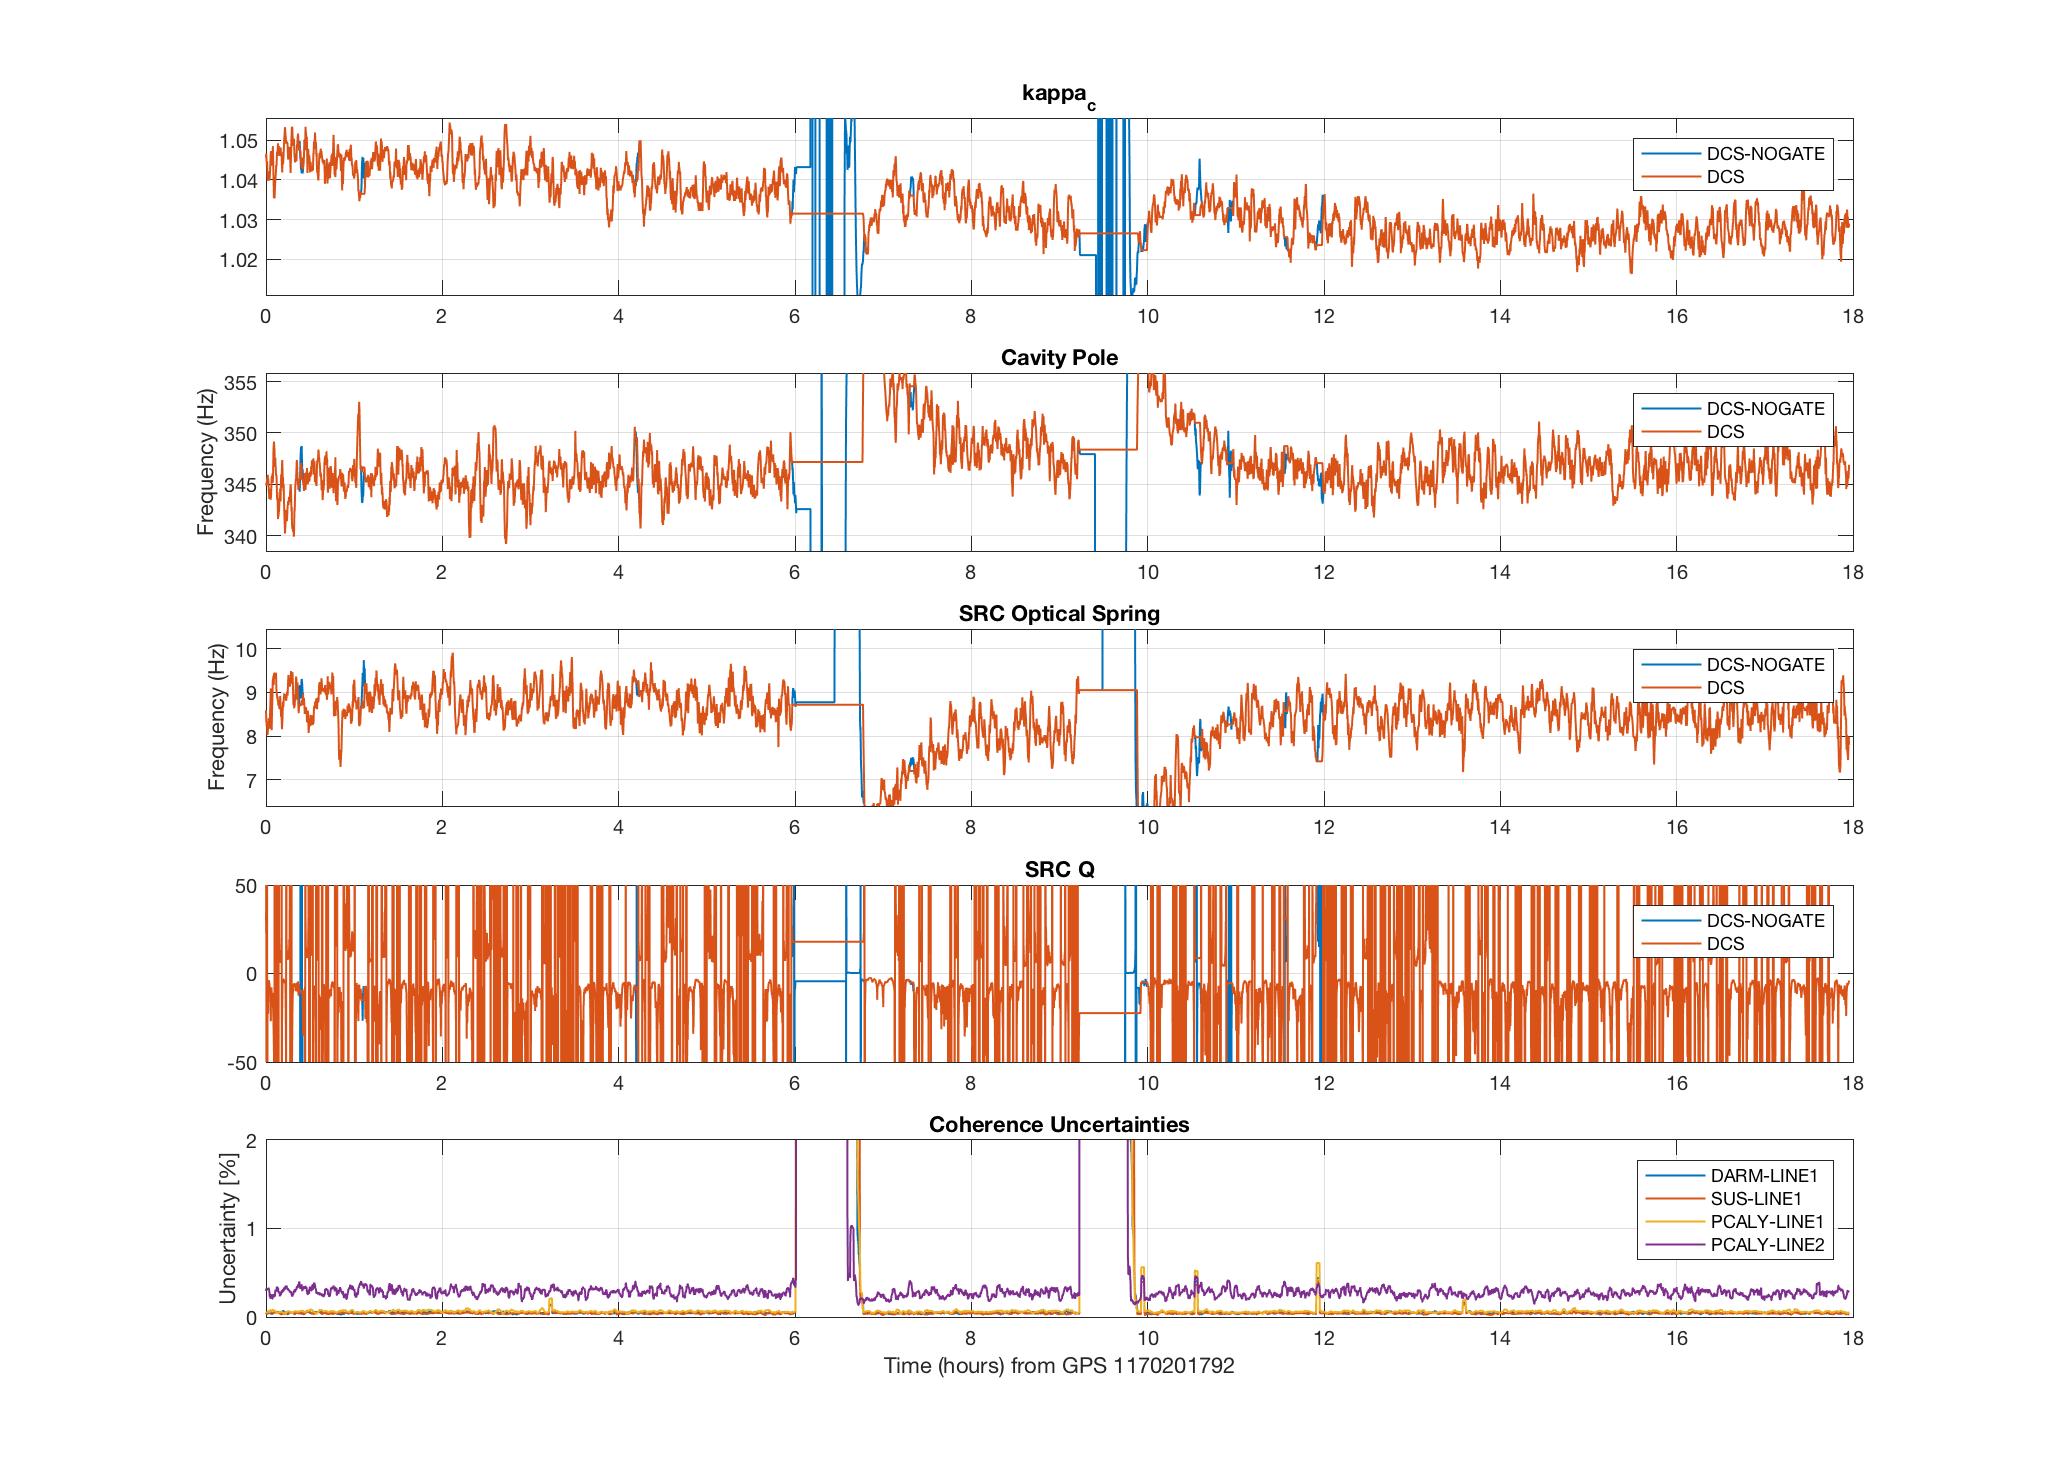
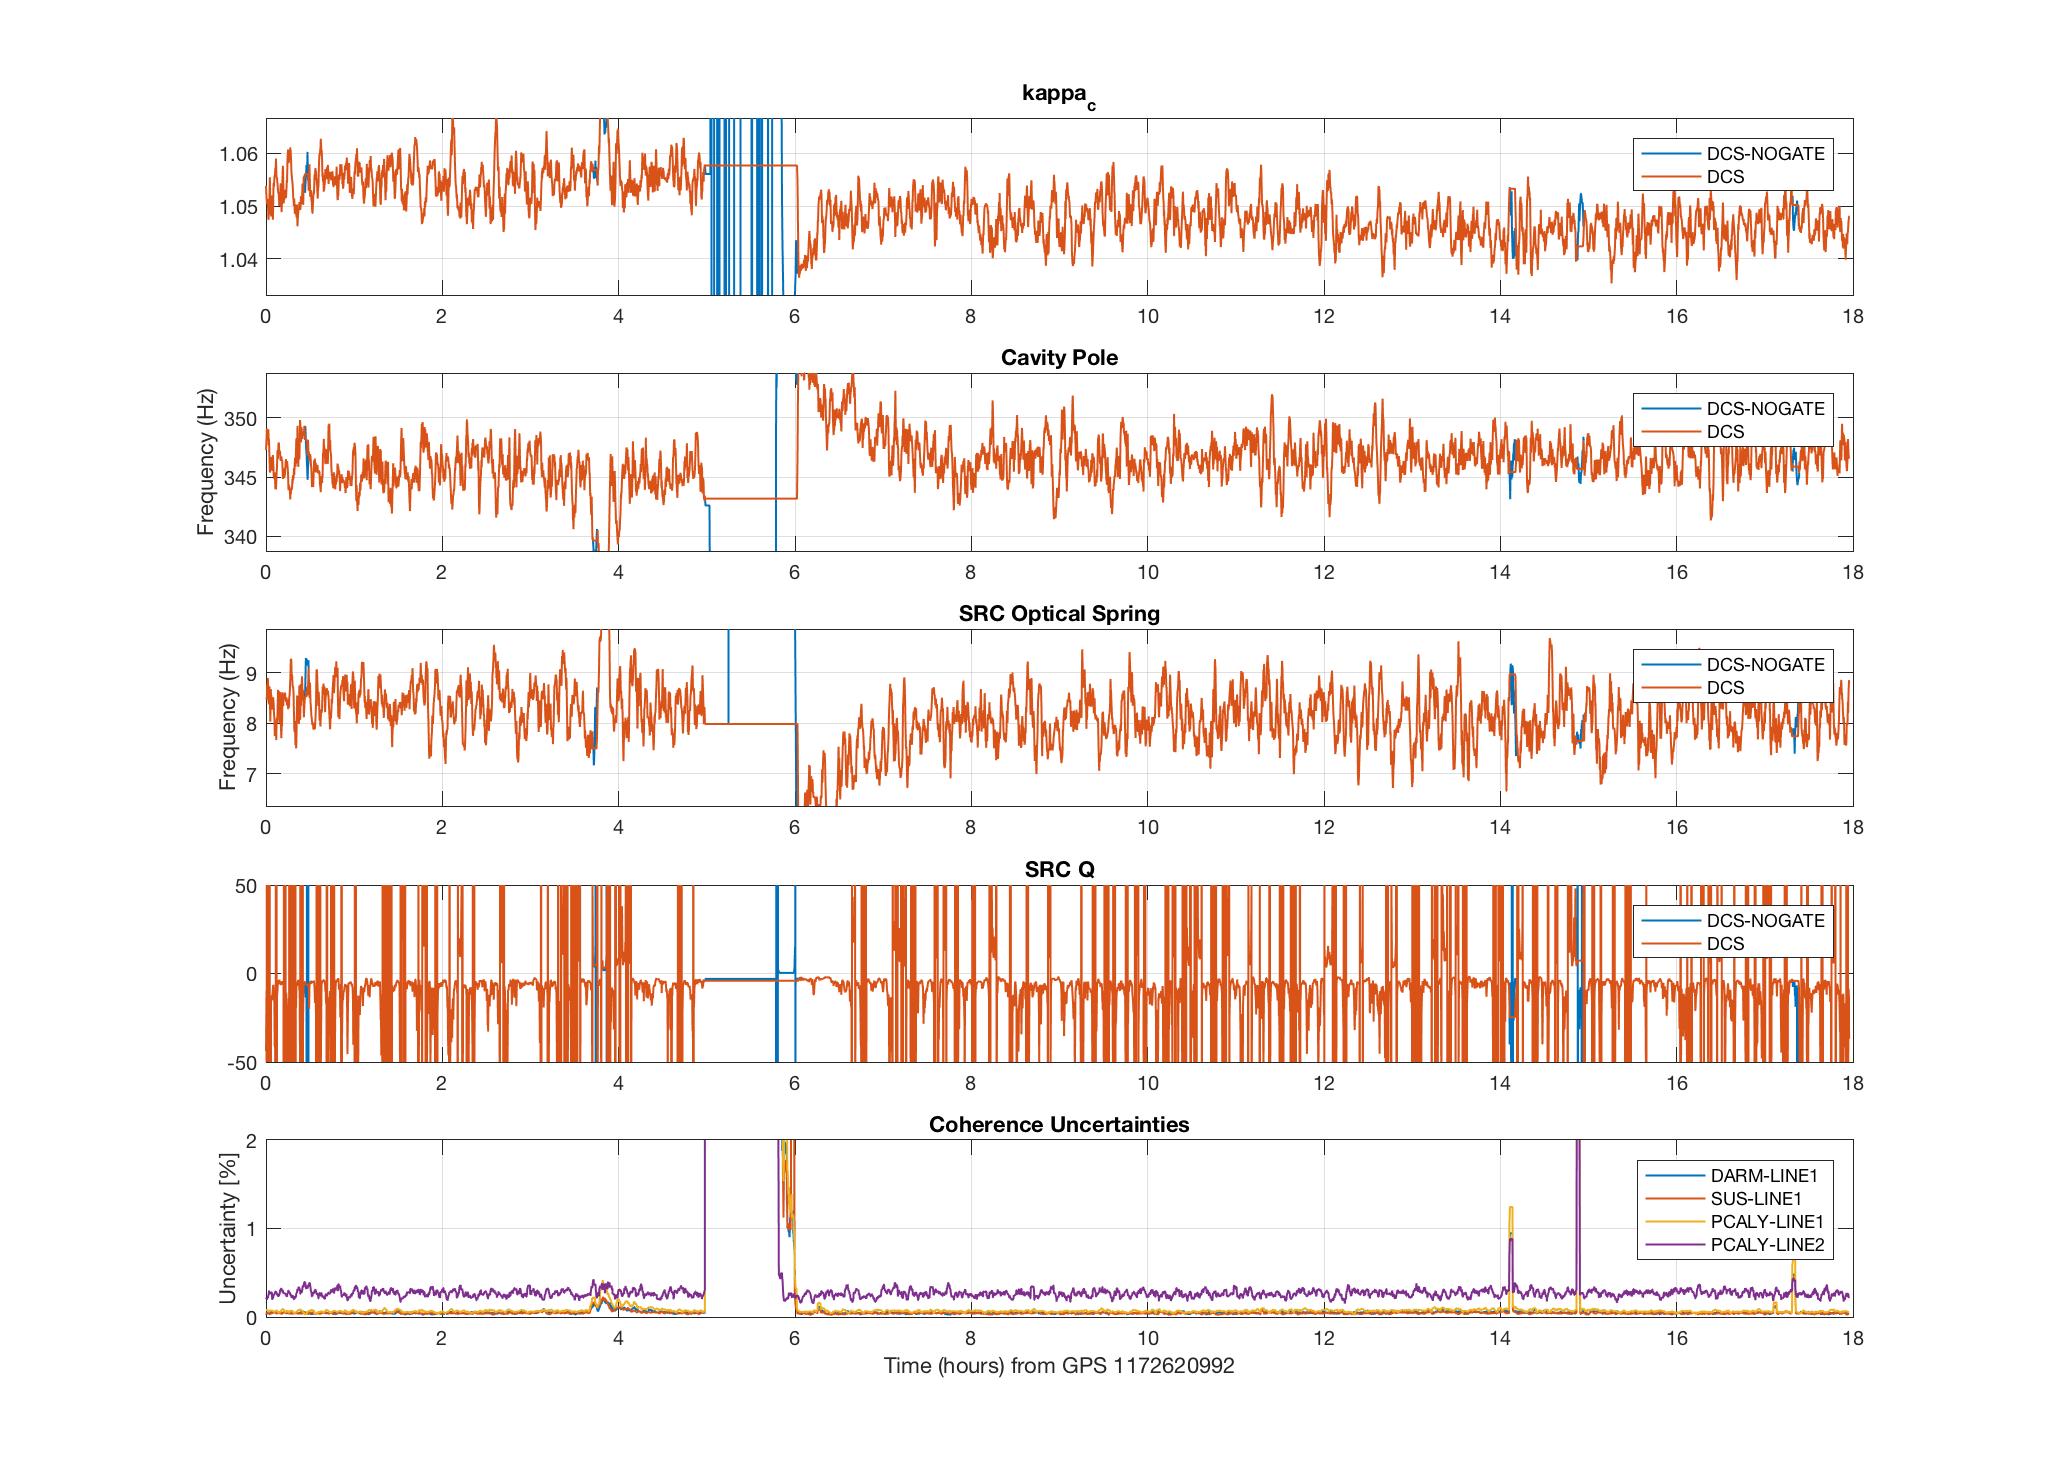
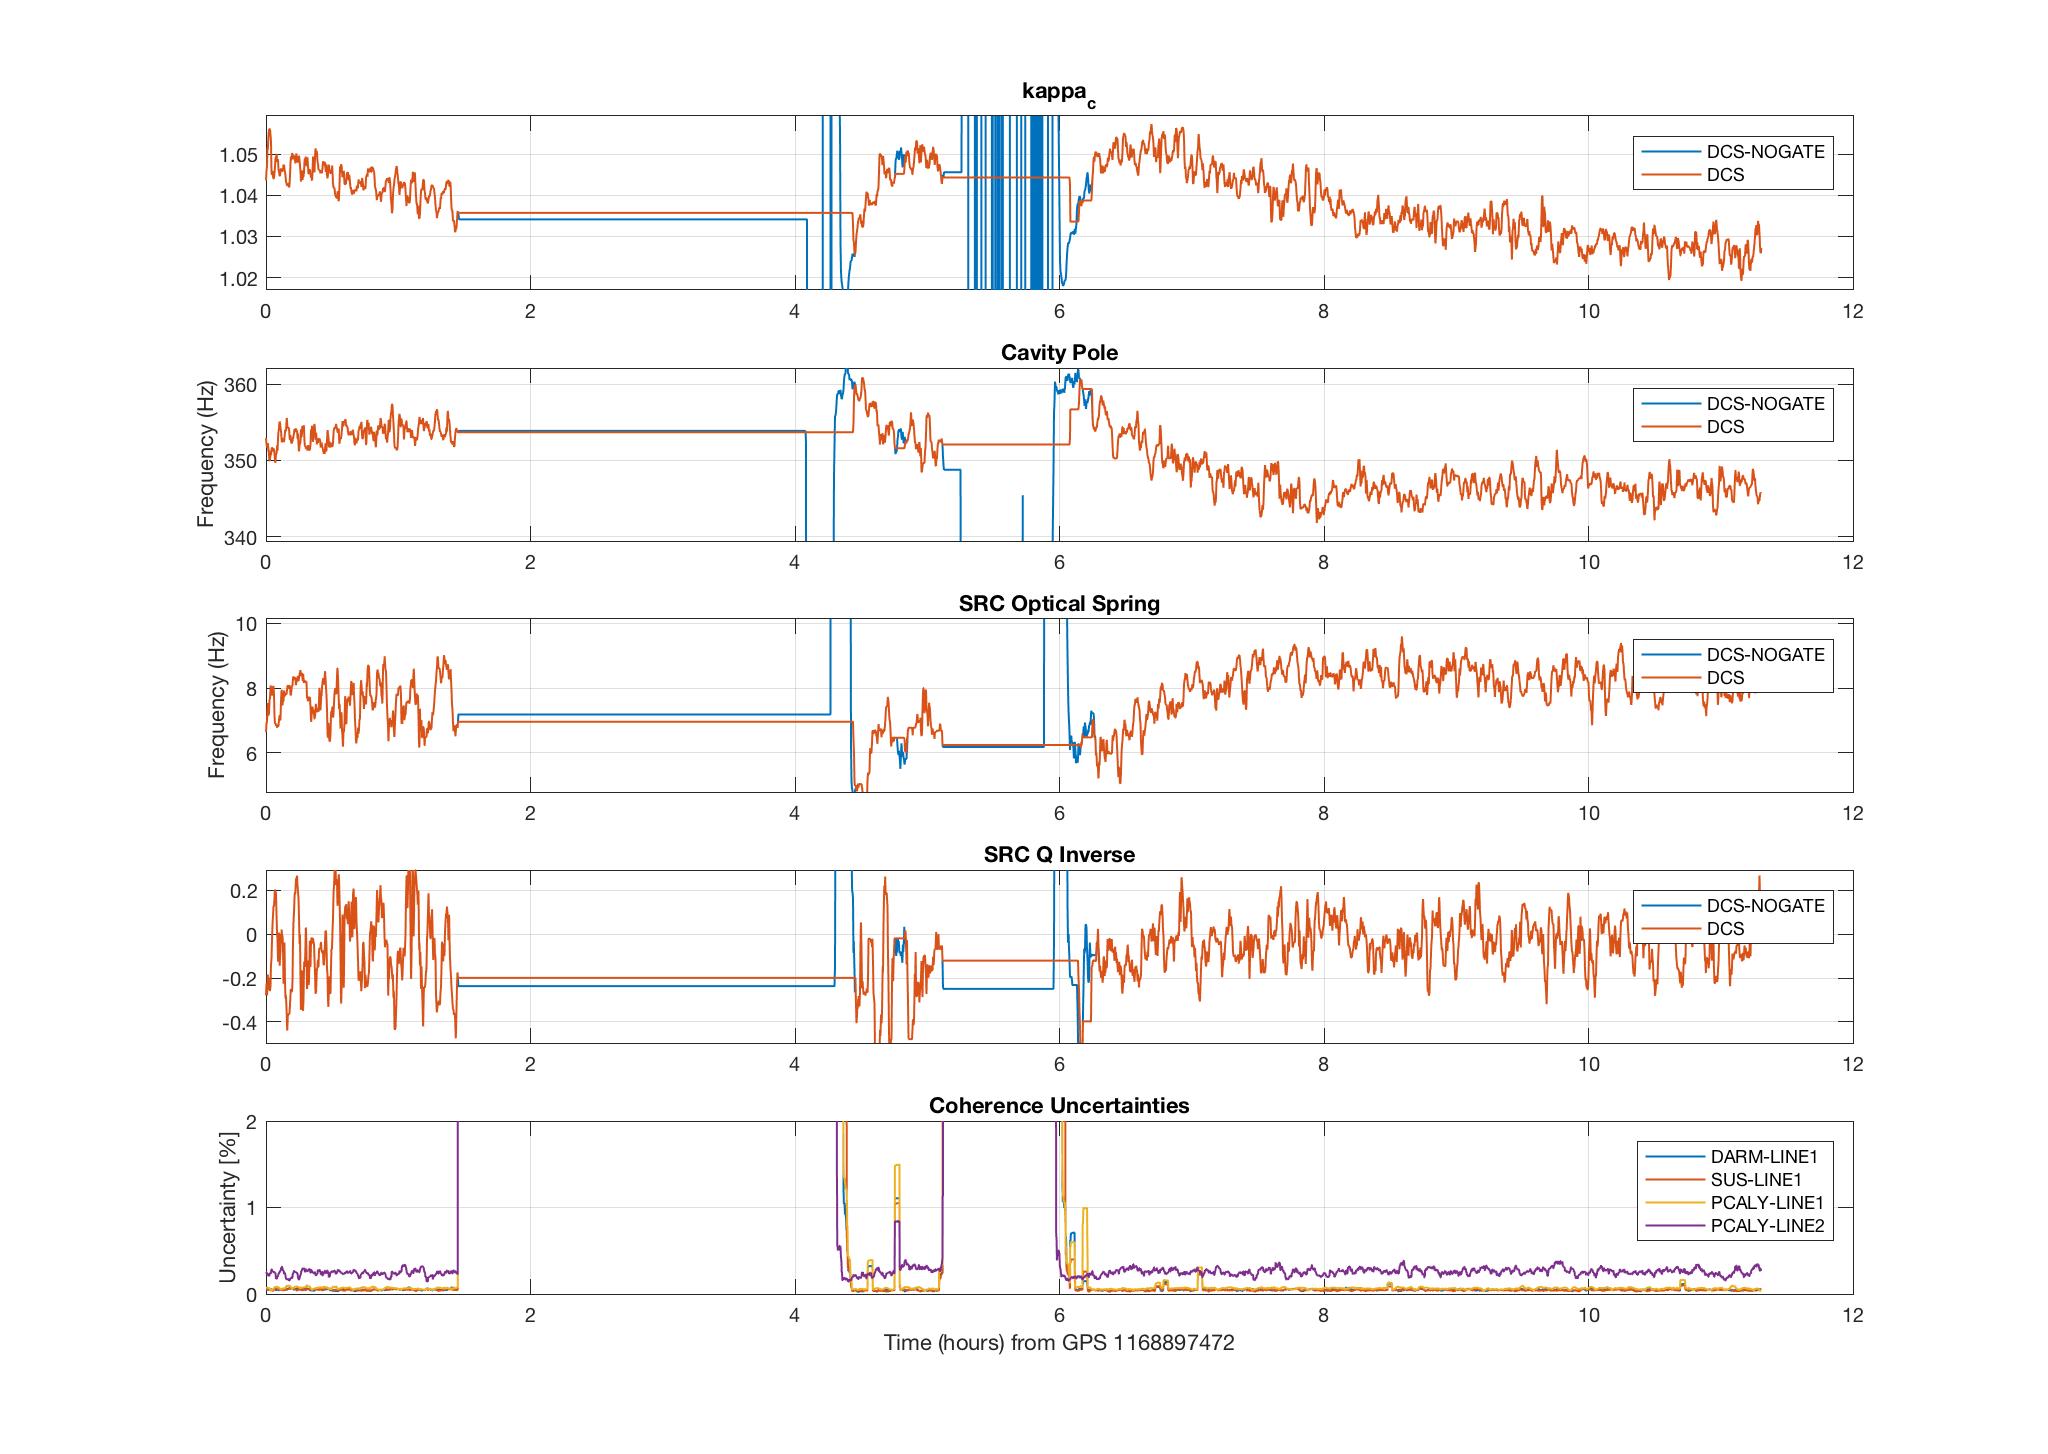
I have added an (unreleased) algorithm into the GDS/DCS pipeline to compute the SRC spring frequency and Q. This algorithm was used to collect 18 hours of data on February 4 (first plot) and 18 hours of data on March 4 (second plot). The plots include kappa_c, the cavity pole, the SRC spring frequency, the SRC Q, and 4 of the coherence uncertainties (uncertainty of the 7.93 Hz line is not yet available).

The derivation this algorithm was based on is similar to what Jeff has posted ( https://dcc.ligo.org/DocDB/0140/T1700106/001/T1700106-v1.pdf ), with differences noted below:
1) The approximation made at the bottom of p4 and top of p5 was only used in the calculation of kappa_c and the cavity pole. So SRC detuning effects were not accounted for in computing S_c. However, kappa_c and the computed cavity pole were used in the calculation of S_s.
2) In eq. 18, I have a minus (-) sign instead of a plus (+) sign before EP6. S_c = S(f_1, t) has been computed this way in GDS/DCS since the start of O2 (I assume during O1 as well).
3) Similarly, in eq. 20, I have a minus sign (-) before EP12.
4) In the lower two equations of 13, I have the terms under the square root subtracted in the opposite order, as suggested by Shivaraj. (Also, I noted that the expression for Q should only depend on S(f_2, t), with no dependence on S(f_1, t). )

The smoothing (128s running median + 10s average) was done on f_s and 1/Q, since that is the way they would be applied to h(t). Therefore, the zero-crossings of 1/Q show up as asymptotes in the plot of Q. I think it would be better to output 1/Q in a channel rather than Q for this reason.

There is a noticeable ramping up of f_s at the beginning of lock stretches, and the range of values agrees with what has been measured previously.

I've noted that it is quite difficult to resolve the value of Q with good accuracy. These are some reasons I suspect:
1) Higher uncertainty of calibration measurements at low frequency can add a systematic error to the EPICS values computed at 7.93 Hz. This may be why the Q is more often negative than positive ??
2) In the calculation of S_s, the actuation strength is subtracted from the ratio of pcal and DARM_ERR. Since this is such a low frequency, the subtracted values are close to the same value in magnitude and phase. Thus, subtracting magnifies both systematic error and uncertainty.
3) The imaginary part of S_s (see eq. 13, bottom equation) in the denominator, is very close to zero, so small fluctuations (about zero, as it turns out) in 1/Q cause large fluctuations in Q.

These reasons make it difficult to measure Q with this method. The effect of these measured-Q fluctuations on S_s, the factor we would actually apply to h(t) (see eq. 22), is not enormous, so long as we apply the smoothing to 1/Q, as I have done here.
First attachment is a hand written note containing derivation of the equations 13 in DCC document T1700106. As Aaron mentioned above, in the derivation the order of the quantities in the sqrt function comes out to be in the opposite order (Re[S] - abs[S]^2 instead of abs[S]^2 - Re[S]). The second plot show the estimation of the four sensing function quantities for 2017-01-24 calibration sweep measurement done at LHO (a-log 33604). Instead of tracking across time here we track across sweep frequencies. The top two plots in the second figure show the estimation of optical gain and cavity pole frequency assuming no detuning. We see that above ~100 Hz we get almost constant values for optical gain and cavity pole frequency suggesting detuning doesn't affect the estimation of those quantities (currently we use 331.9 Hz line at LHO for estimating optical gain and cavity pole). Substituting back the optical gain and cavity pole calculated this way, we then calculated detuning frequency and Q. The bottom two plots of the second figure show those. We see that upto ~60 Hz we can use the lines to estimate detuning frequency (currently at LHO we are running the line at 7.83 Hz). However the Q is hard to estimate, the variation is pretty large (Evan's recent a-log also indicate this 34967; Aaron also finds this to be the case). Also in the 7-10 Hz region its value seems to be negative (need to look at more data to make sure that it not just a fluctuation). With the current set of calibration lines, it seems tracking of detuning frequency would easy but estimating Q might be a little difficult.
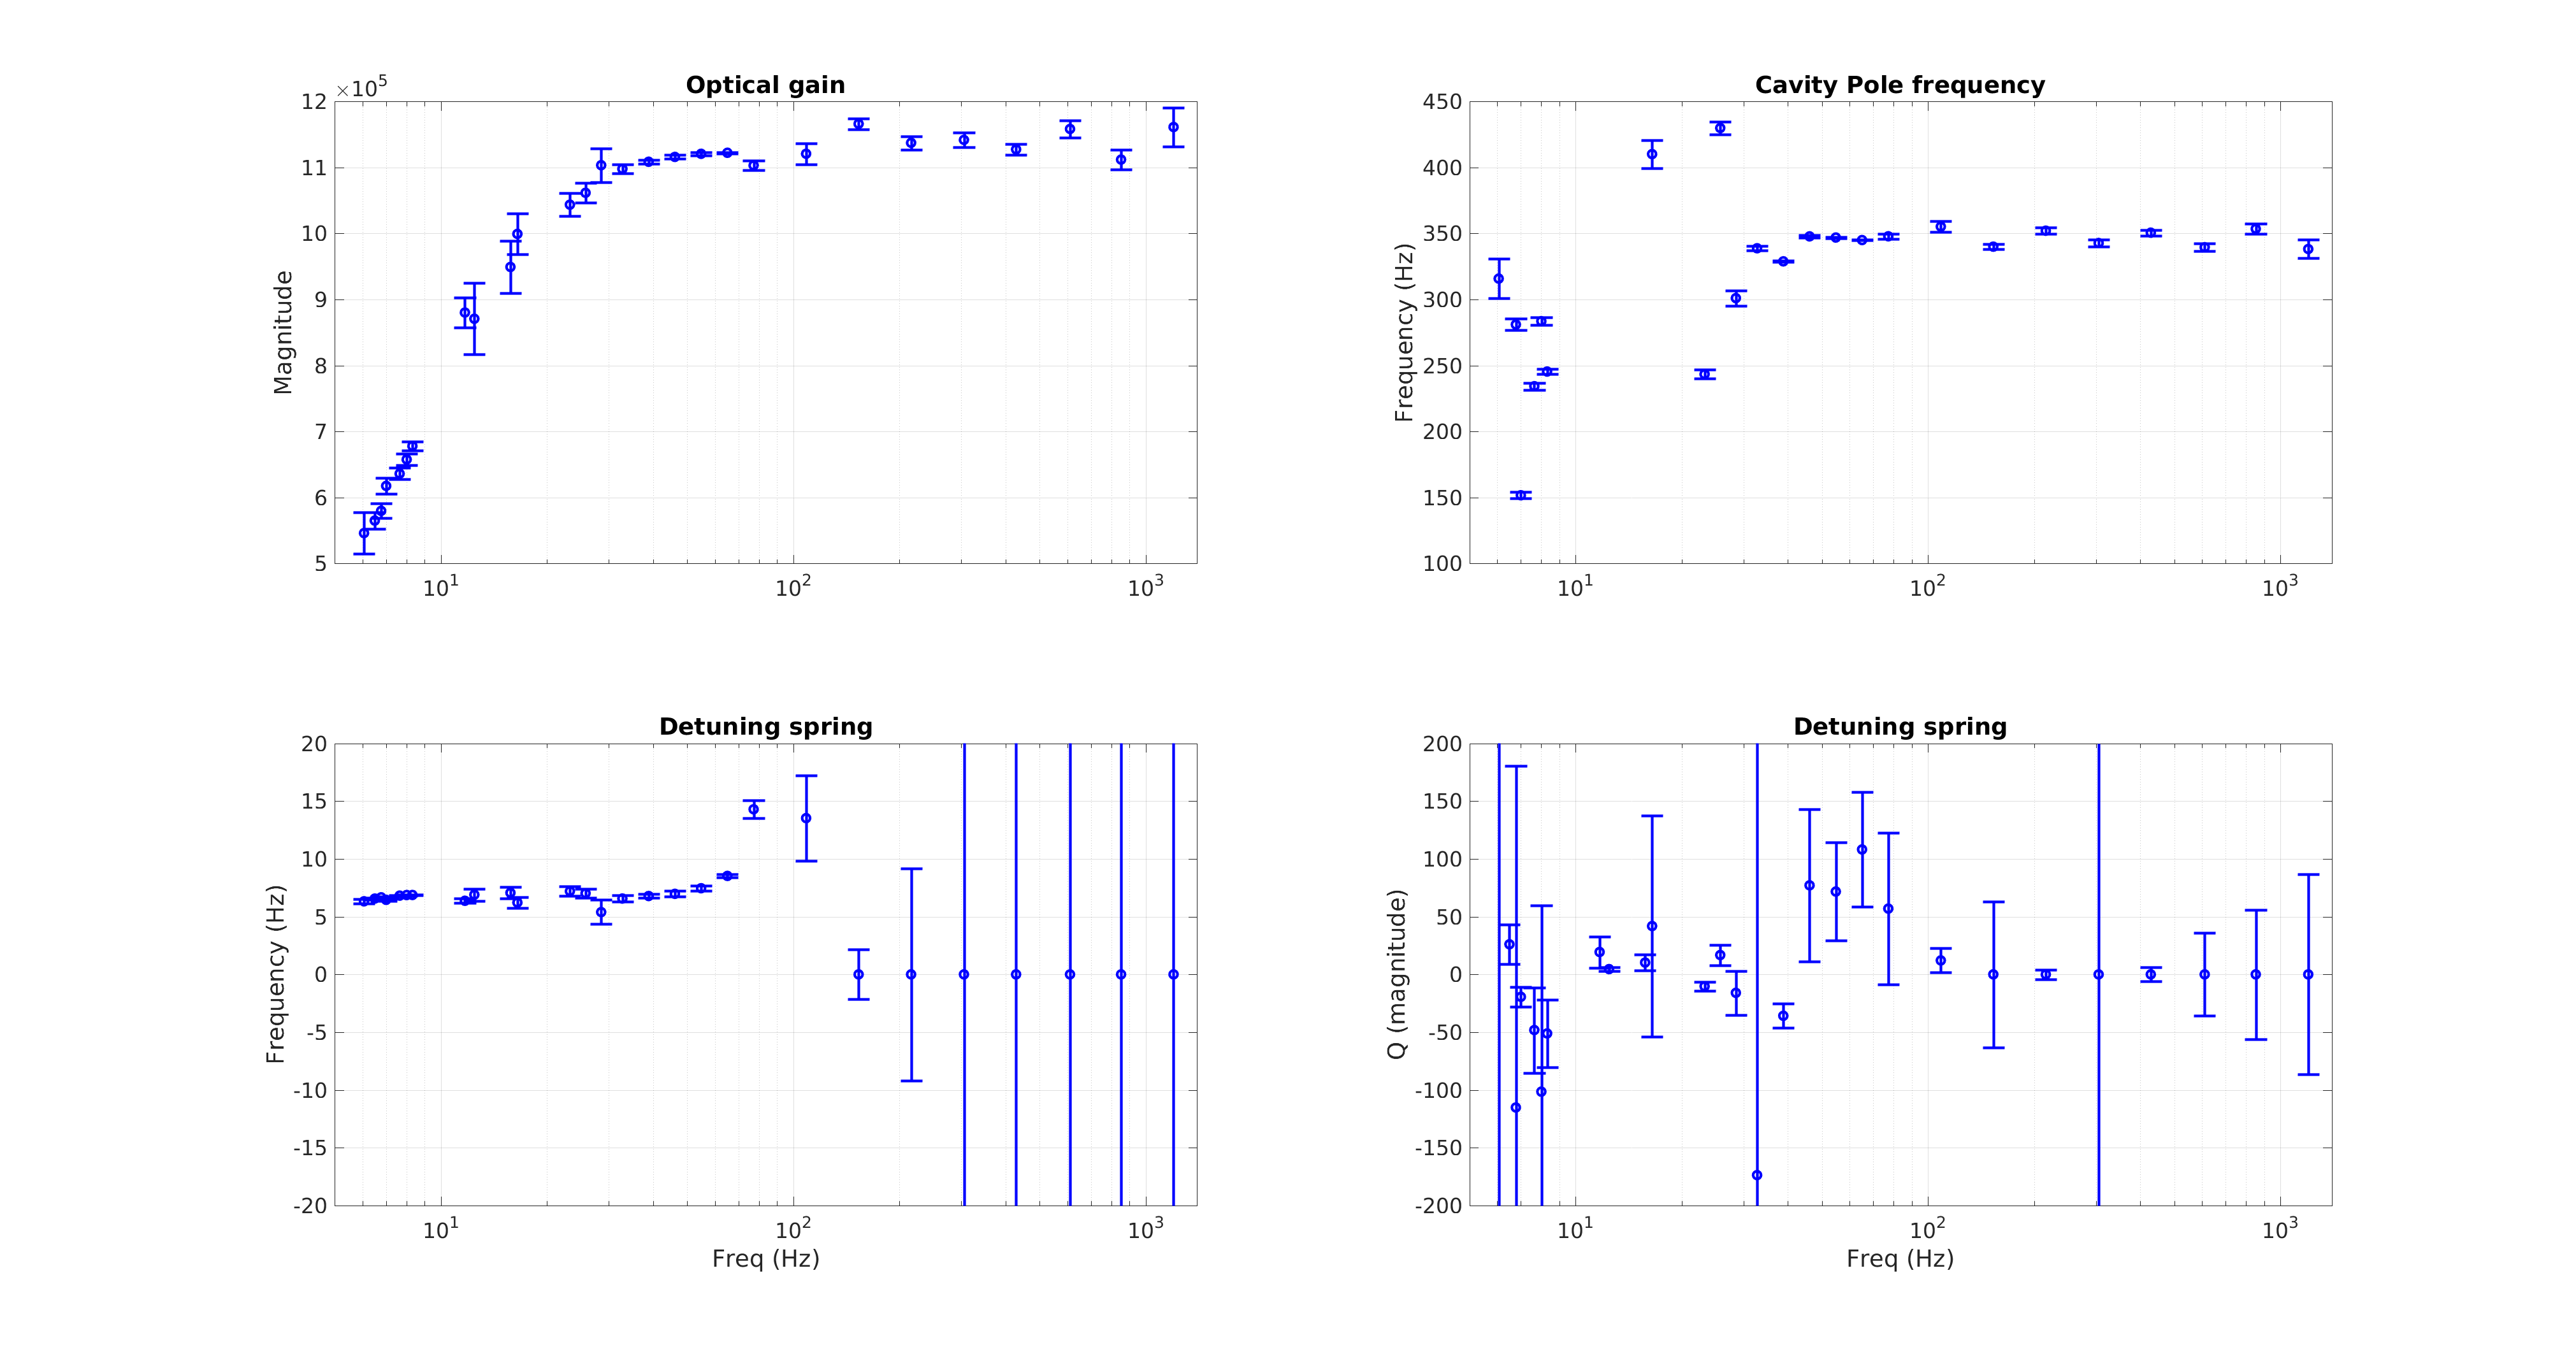
In the second page of the derivation, at the half way point I have unintentionally switched the notation from S_s to S_c (it should be S_s till the end of the page 2).
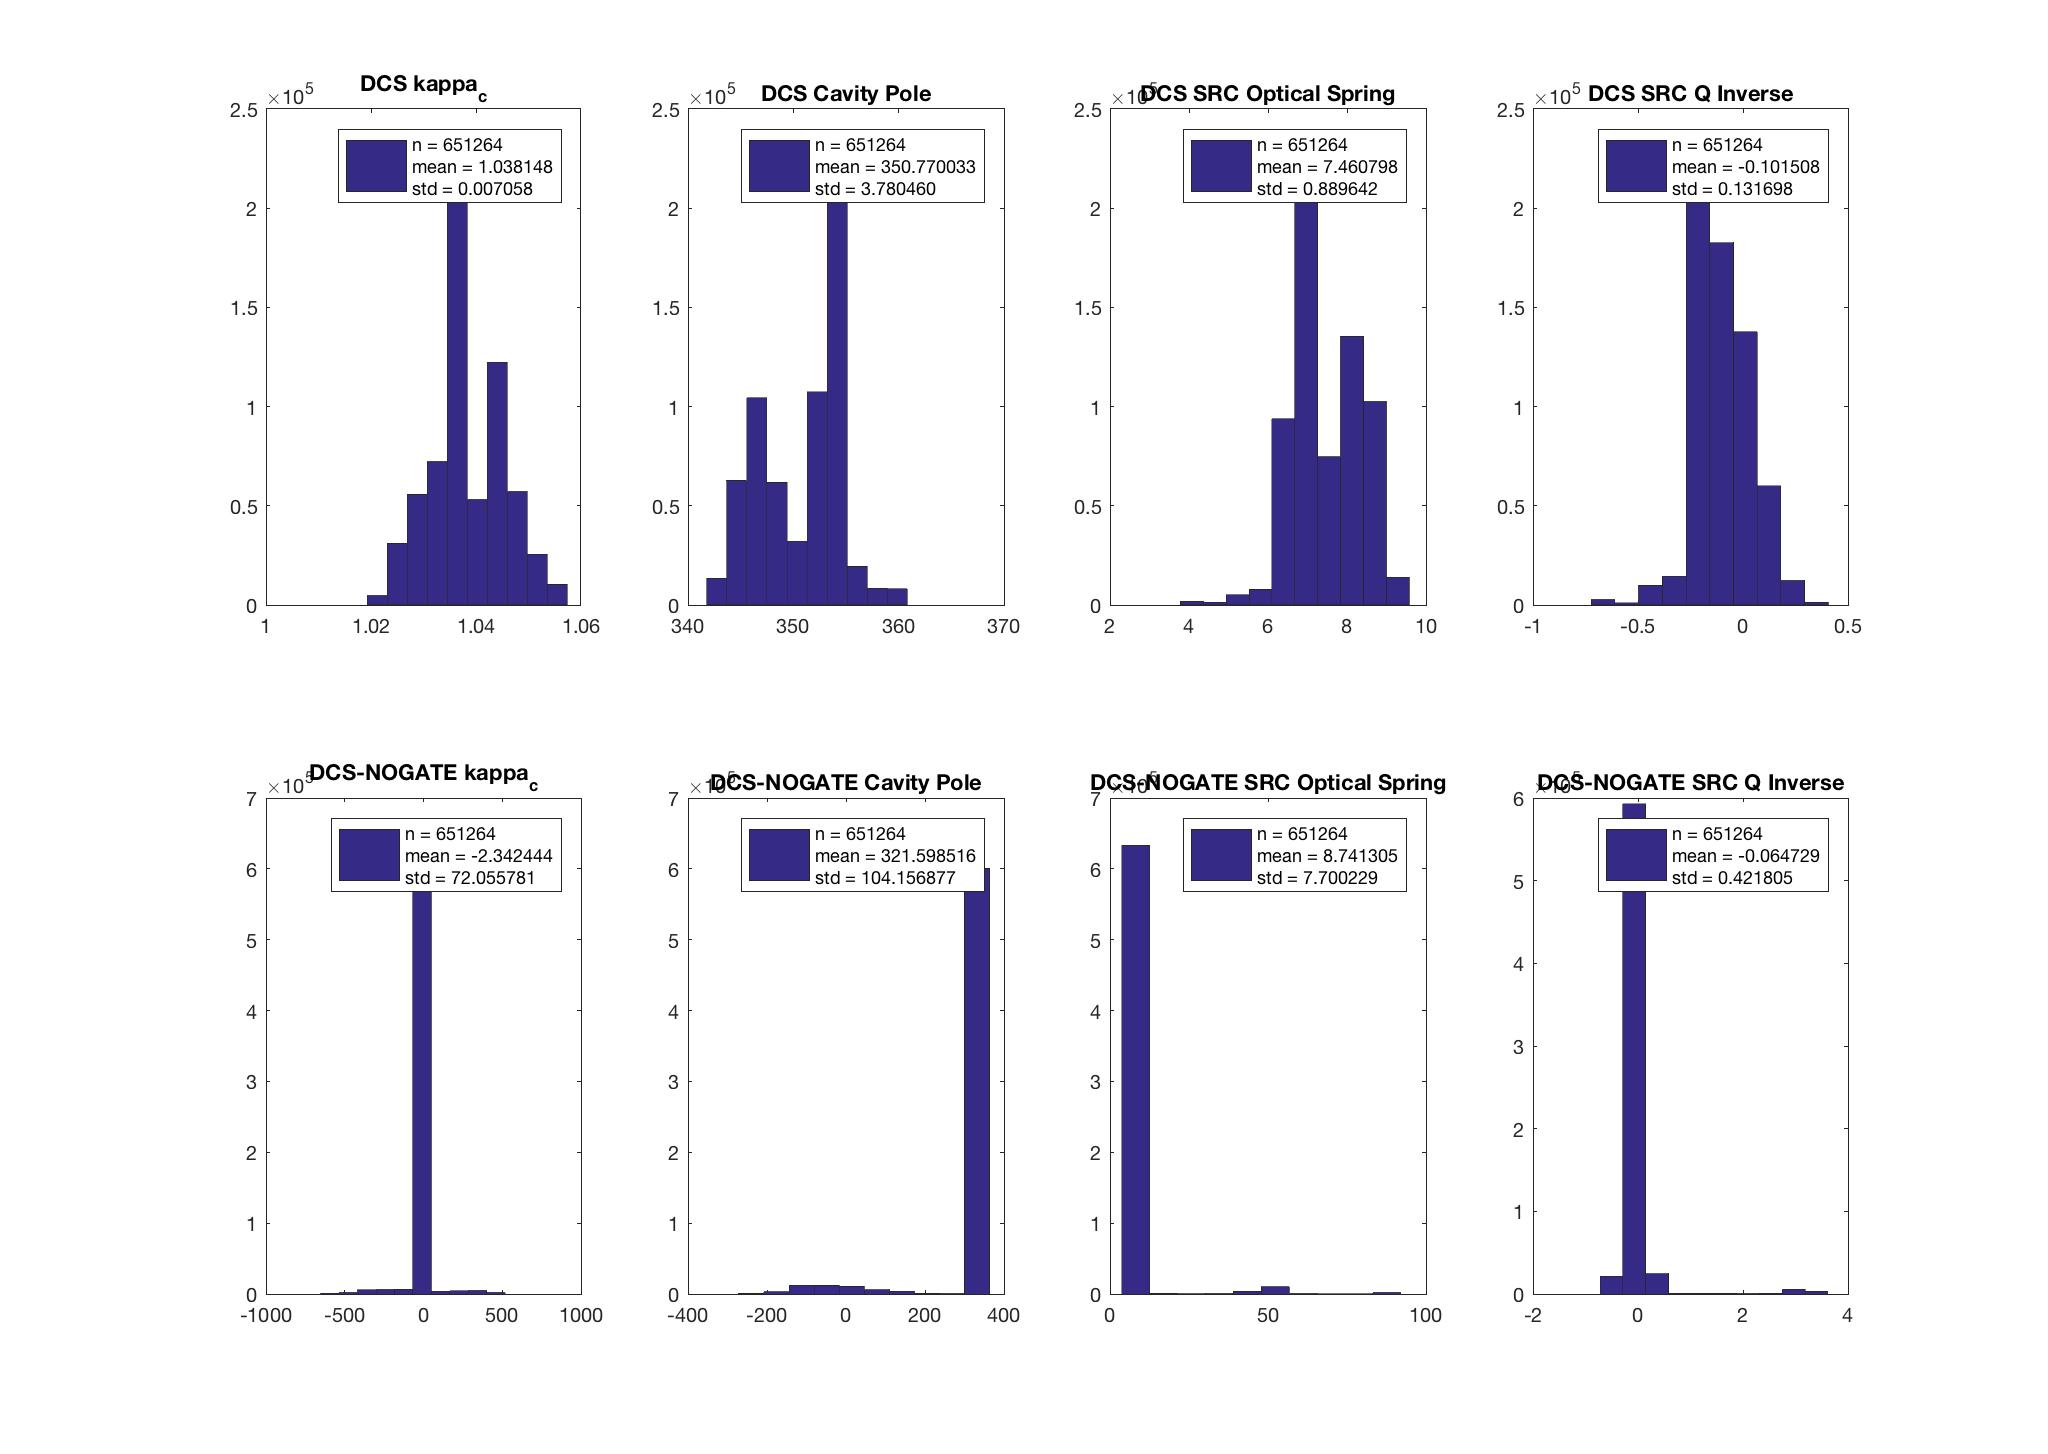
[Daniel Finstad, Aaron Viets]

The time series and histograms attached show additional data collected using the DCS calibration pipeline from Jan 19, 2017 at 21:44:14 UTC (GPS 1168897472) until Jan 20, 2017 at 09:02:38 UTC (GPS 1168938176).


images:
ITMY ROLL MODE - not damping with just +60deg phase - snapshot attached
ITMY ROLL MODE - damping with +90deg phase