jeffrey.bartlett@LIGO.ORG - posted 14:29, Monday 22 May 2017 (36324)
Add 250ml to Crystal Chiller
Added 250ml water to Crystal Chiller to silence low water alarm.
Added 250ml water to Crystal Chiller to silence low water alarm.
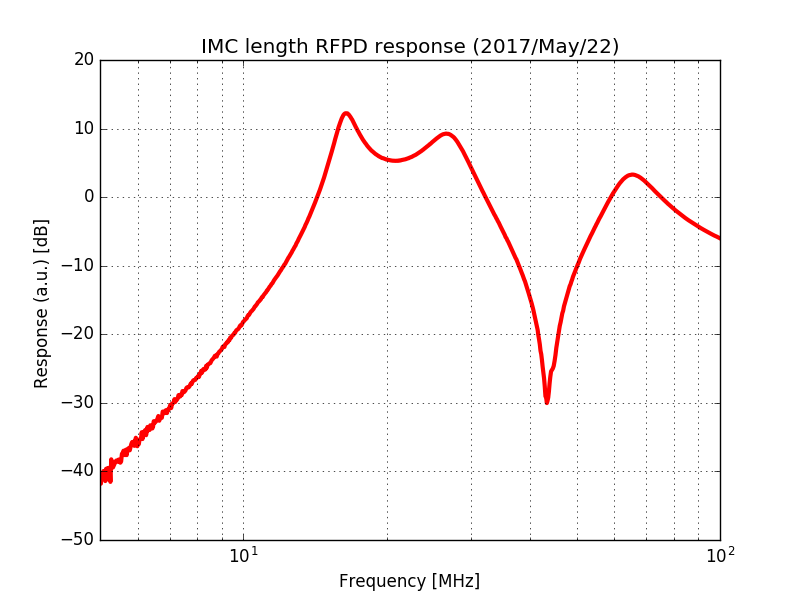
Richard told (or reminded) us this morning that the resonant circuit of the RFPD for locking the IMC had been adjusted for 21 MHz rather than the actual modulation frequency of 24 MHz. So I went ahead to the IOT2L optical table and measured the RFPD response using the AM diode laser. As shown in the attached figure, the RFPD is indeed configured for 21 MHz. Because the resonance at around 21 MHz is so broad, 24 MHz is well within the resonance with a slightly bigger response than 21 MHz by a few dB. The notch seems to be adjusted to 42 MHz. The ratio of the response at 48 MHz over 24 MHz was found to be about -20dB.
The raw data is also attached.
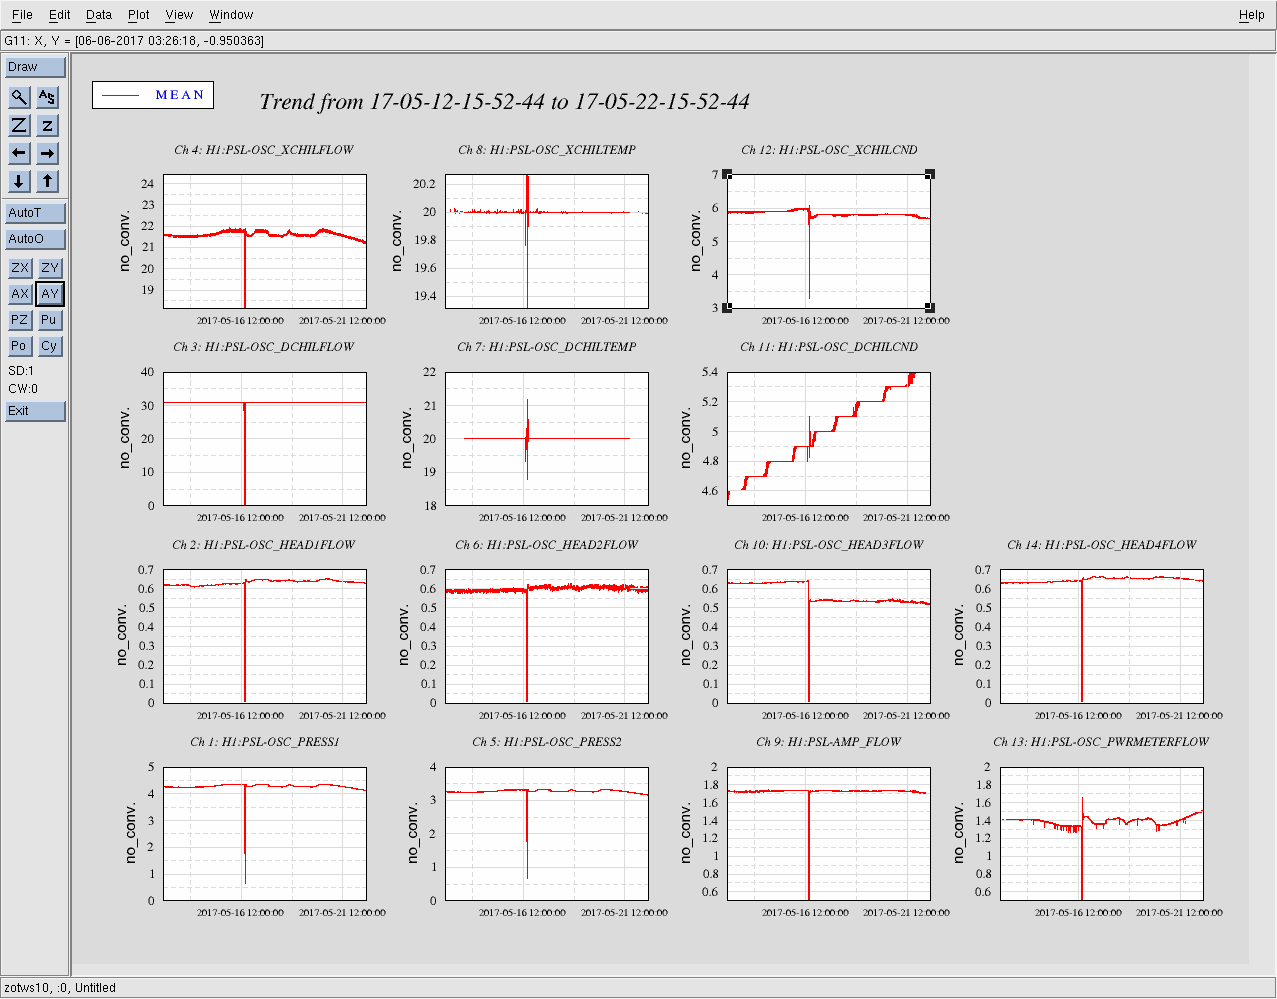
We are working several issues at the moment, here is an executive summary:
bogus second trend data: Some vacuum channels were showing bogus data in their second trends if data over Thursday lunchtime's DAQ restart is requested. Work around is to ask for data up to and beyond the restart time.
BACnet EPICS FMCS data froze around 1pm Sunday (fixed by restarting code)
CP3 overfill did not proceed, thermocouples out of -20C to +40C range (mid 40C). Code will be changed to increase upper limit to 60C. WP6649
Air compressors were turned off at both end stations, Alarm system reconfigured to ignore these channels (WP 6647)
Jeff K. reported that the FMCS channels at end Y had flatlined. I restarted the IOC and they seem to be updating again. I do not yet know why. I burtrestored to 6 AM local on May 20.
Restarted again to enable logging. Burtrestored again. Apologies for the alarms.
Jonathan, Dave
The DAQ was restarted at 19:06 Thursday 5/18 UTC (for vacuum controls IP6 work). If an NDS1 request for second trend data for certain channels is sent which spans the restart time, then the data preceding the restart is correct, but post data is bogus. In the case of H0:VAC-EY_Y3_410_PIRANI_INTLK, data at the tail end of the 19:00-19:10 second trend file is a static 2.2, and from 19:10 onwards is a noisy 2.2
We conclude that only the second trend frame from 19:00-19:10 is suspect. Both framewriters wrote the same frame, both nds servers show the same issues if spanning this frame. Investigation continues. I've saved the frame and its md5 file under h1nds1 control's homedirectory (dave subdirectory).
-rw-r--r-- 1 controls controls 434M May 22 11:27 H-H1_T-1179169200-600.gwf
-rw-r--r-- 1 controls controls 33 May 22 11:27 H-H1_T-1179169200-600.md5
This may be similar to a known Dataviewer issue when getting trend data that spans a data gap. See LLO FRS 7239.
Possible answer to Thursday's second trend issues:
Patrick noted that the interlock channel looked like it was showing a different channel's second trend data after the DAQ restart. I then remembered that the original NDS code had a performance feature built into it. When asking for second trends, it read the full channel list from the first GWF file, and then applied those channel offsets for all subsequent files it opened. In the initial system second trend files were one minute in length.
To cover the case where the channels configuration was changed during the requested time span, the code looked for any missing second trend files. At one minute per file it was not possible to restart the DAQ and not have a missing file. The file following the gap was read for the channel configuration and that was used from that point onwards.
Fast forward to today, with 10 minute trend files. It is now highly unlikely for a second trend file to be missing when the DAQ is restarted, and so the channel data pointers will be incorrect after a DAQ reconfiguration. We seem to be seeing this, with the interlock channel being replaced with a cold-cathode raw voltage channel (value of about 2.2V).
After reviewing the nds1 server code it looks like Dave's assesment is correct. The nds1 server implements a nice optimization where it reads in the frame table of contents at the start of a span of contiguous frame files. It only reads a new copy of the table of contents in when there is a gap in the frame files (thus saving a large amount of processing time). Now we can restart the daq fast enough that there need not be gaps in the trend frame files, so the nds1 server will not catch a restart of the daq (and thus the need to read a new copy of the table of contents in). I will work on correcting this on the DTS today.
After making sure all the view ports on HAM1,2, and 3 are covered (all the ones that Robert could have used), I opened the PSL light pipe for commissioning work. The LVEA is still LASER SAFE.
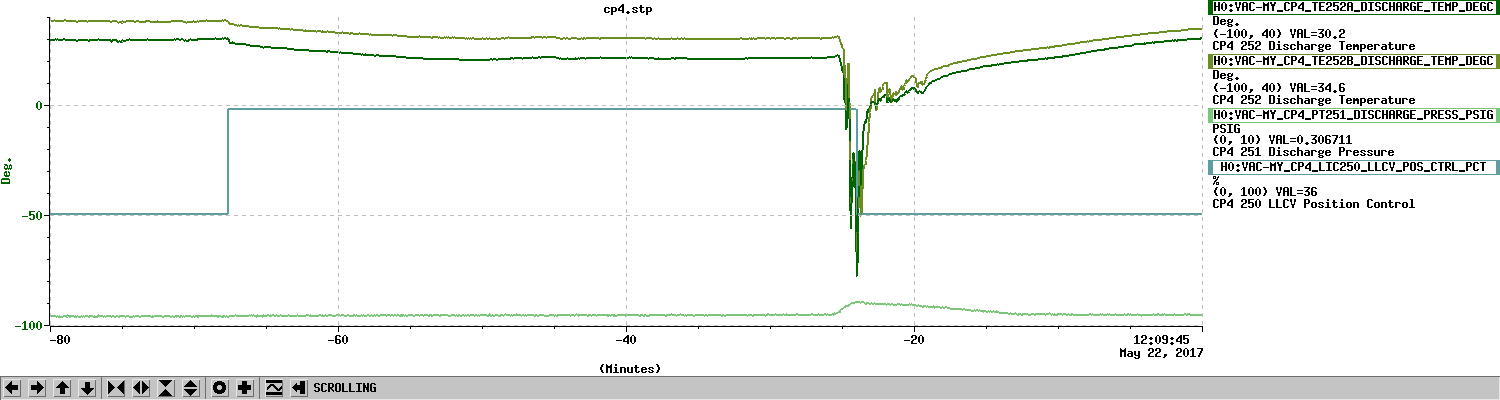
Starting CP3 fill. TC A error. TC B error. Fill aborted.
Starting CP4 fill. LLCV enabled. LLCV set to manual control. LLCV set to 70% open. Fill completed in 2620 seconds. TC B did not register fill. LLCV set back to 36.0% open.
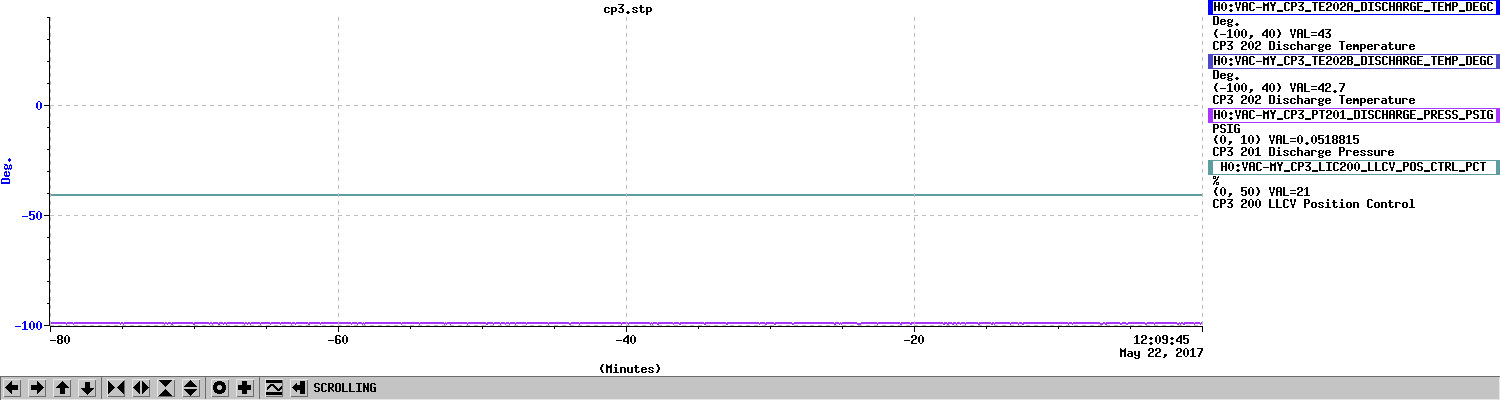
Dave, Patrick

It appears that the temperature of the CP3 thermocouples started above 40 deg C which the script to perform this fill takes as an error. That is, the script takes any reading from the thermocouples above 40 deg C as an indication that the thermocouple is not working correctly. We have created WP 6649 to increase this upper limit.
Thanks!
Increased CP4's manual LLCV %open value from 36% to 37%.

Will let new script run before altering CP3's value.
First run of updated script did not complete after an hour:

Starting CP3 fill. LLCV enabled. LLCV set to manual control. LLCV set to 50% open. Fill not completed after 3600 seconds. LLCV set back to 21.0% open.

Dave is rerunning it.
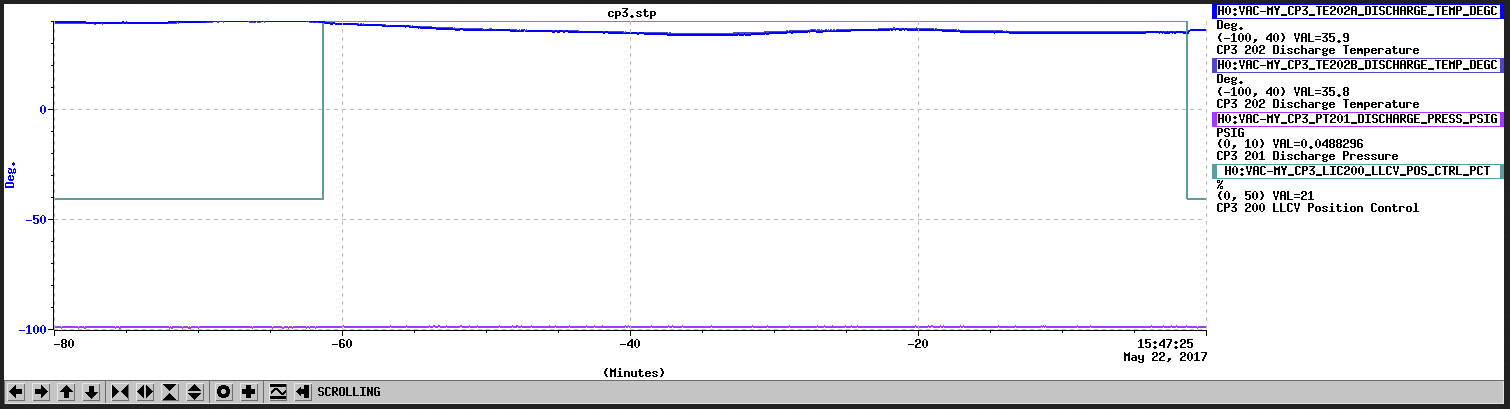
Fill completed:

Starting CP3 fill. LLCV enabled. LLCV set to manual control. LLCV set to 50% open. Fill completed in 384 seconds. TC B did not register fill. LLCV set back to 21.0% open.
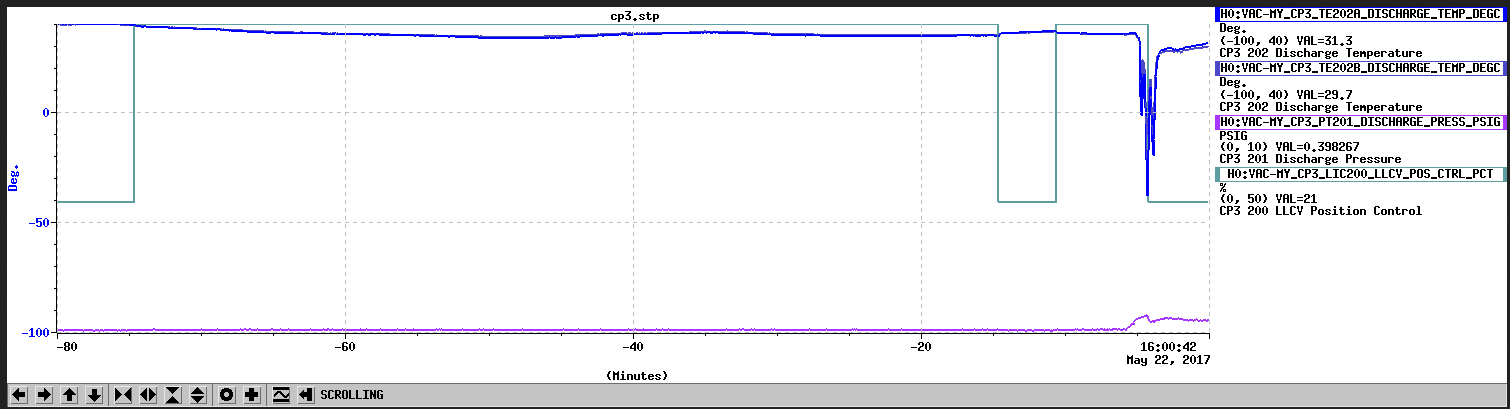
I looked at CP3's exhaust discharge pressure and am convinced that it did overfill following the second running of the new script. I increased CP3's LLCV %open to 22% up from 21%. It is getting warmer this might be too conservative?
WP6647
Bubba, Dave:
The end station instrument compressed air signals from both EX and EY were removed from the cell phone alarm system. Two channels per building, the signal channel and its error channel. Alarm system was restarted at 11:24 PDT.
Kyle

(Tasks part of WP #6644)

~1015 hrs local -> I valved-in the Vertex RGA to the combined vacuum volumes of the Vertex+YBM+XBM while these volumes were being pumped by their respective turbo pumps.  PT120's response is attached (1 hour of second data).  "From my head" 10-9 torr/10-5 L = 10-4 torr/L of gas accumulated in the unpumped ~5L RGA volume in 14 days?  So, no significant air leaks in the RGA joints.

~1045 hrs. local -> I energized the Vertex RGA filament (note: I am confused with the Pfeiffer software's naming of my connect/scan session with the included phrase "Airdemo..".  The other versions of this software don't do this and I makes me question as to whether I am actually connected to the Vertex RGA (h0rgacs) or am I connected to their "Simulator" or virtual RGA in this connect/scan session?
Correction to this obvious typo error:

(10-9 Torr)(10+5 L) = 10-4 Torr*L of accumulated gas.
Laser Status: SysStat is good Front End Power is 33.98W (should be around 30 W)
HPO Output Power is 165.2W
Front End Watch is GREEN
HPO Watch is GREEN
PMC: It has been locked 5 days, 23 hr 12 minutes (should be days/weeks)
Reflected power = 16.97Watts
Transmitted power = 62.97Watts
PowerSum = 79.94Watts.
FSS: It has been locked for 3 days 18 hr and 40 min (should be days/weeks)
TPD[V] = 2.846V (min 0.9V)
ISS: The diffracted power is around 2.7% (should be 3-5%)
Last saturation event was 5 days 4 hours and 57 minutes ago (should be days/weeks)
Possible Issues:
Nothing unusual to report.
Concur with Ed, all looks normal.
The HVAC controls upgrade install has been completed at both end stations, therefore I have turned off the air compressors at both end stations. Sorry for all the alarms.
Note that the tour that I had scheduled (see WP #6641) is canceled.

At some point, I expect to be in the LVEA, the VPW, the Control Room and my office.  I expect to be here approximately 2 hours and will make a comment to this entry when I leave.
Turbo pressures at 1630 hrs. local -

Vertex inlet 7.0 x 10⁻⁸ fore line 4.1 x 10⁻³
XBM inlet 6.0 x 10⁻⁸ fore line 1.2 x 10⁻³
YBM inlet 1.0 x 10⁻⁷ fore line 2.2 x 10⁻³.

Also, I found that the Emergency Egress Door in the VPW was being held open via the positive room pressure so I closed it.  VBOD RGA turbo cooling fan was of due to a tripped GFCI wall receptacle - I reset it and it seems fine.

1900 hrs. local - > Kyle leaving site now.
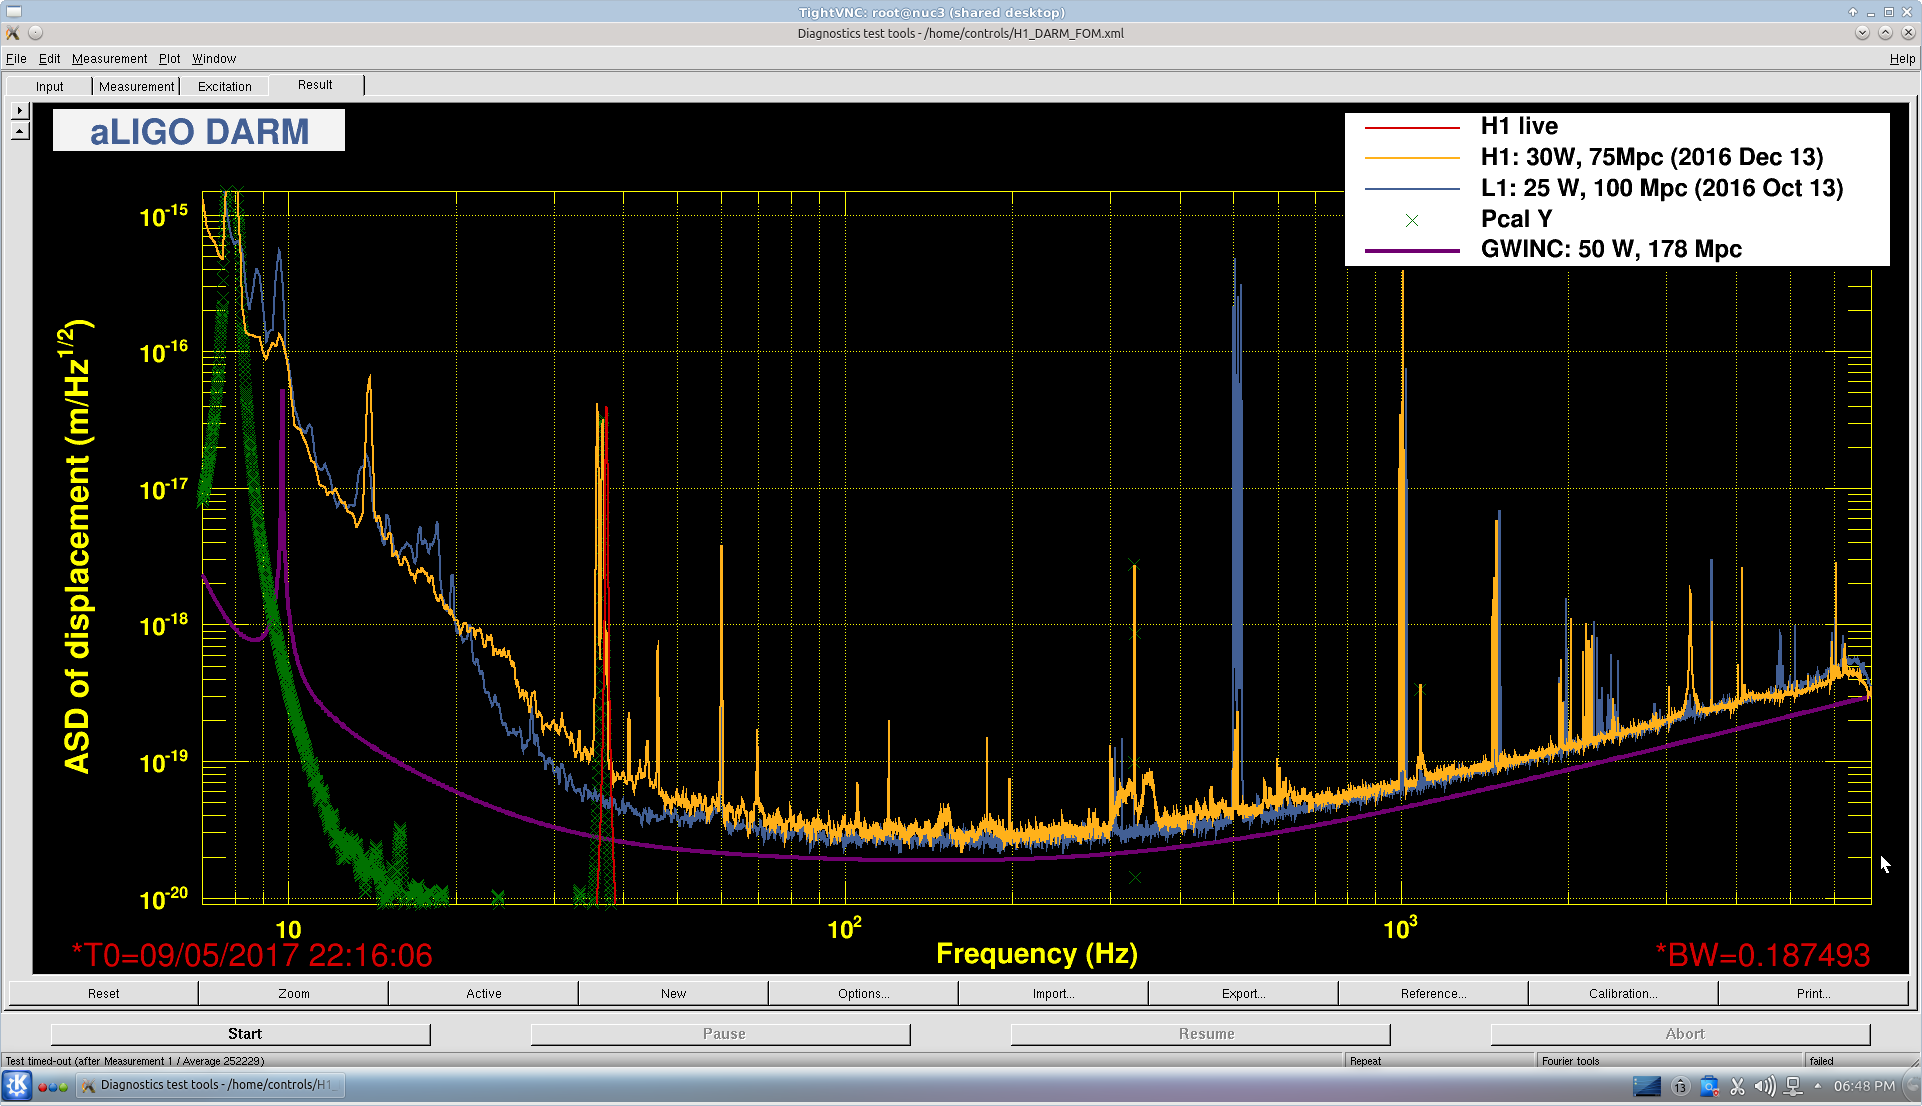
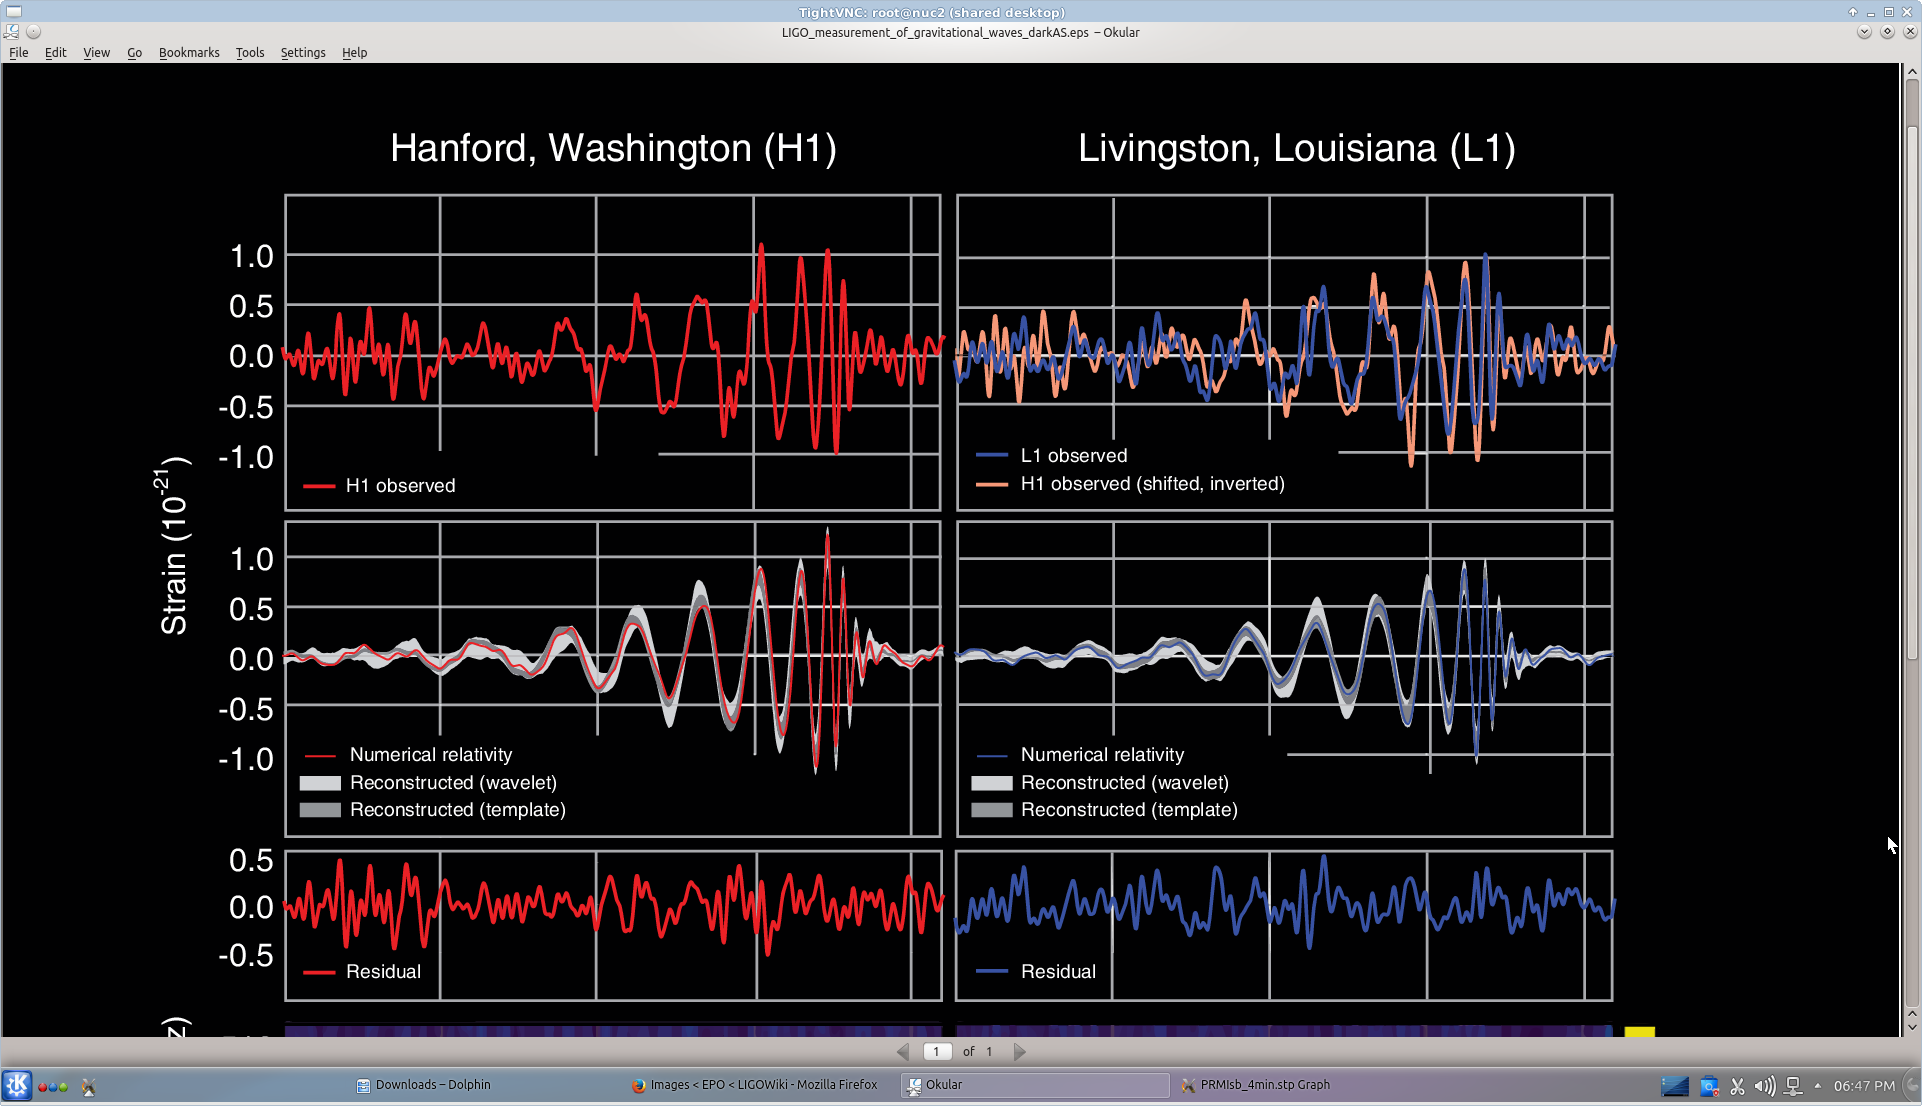
J. Kissel, NOVA Film Crew

I've modified the main displays on the front wall at the request of the NOVA film crew. The lower screen is displaying the GW150914 waveform and the background of the DTT session showing the Live Sensitivity on the Upper screen has been changed to black.

There is zero intention of this being permanent, but I figure there will be no harm in leaving it as such over the weekend since the content normally displayed on these screens only has meaning when we have light in the arms, no one is intending to commission the corner station over the weekend, and there'll be no operations specialists on shift over the weekend. So, it should just be the film crew, Dr. Levin, and their site liaison, and they all want it this way!

I'll restore the displays to normal Monday.
NUC2 and NUC3 configurations has been restored to O2 Observation Ready.

