We took open loop transfer functions for some suspensions today. Some were taken so we have 'before' OLG and loop suppression data before we switch out their satamps (ITMX, ITMY), and the rest were after the satamps were switched out (85463) so that we could confirm that they all looked good (PRM, PR3, SRM, SR3).
0.4:10 (old) satamp OLG TFs
ITMX M0
- Measurements taken with suspension in HEALTH_CHECK but with damping loops on
- optic align offsets off, L2->R0 damping off, etc
- We needed to adjust the excitation filters for V and Y, plus lower the amplitude by a factor of at least 5x to keep the suspension dac from overflowing and saturating. These excitation filters were originally matches to the ETM ones, but we had to adjust them.
Data: 2025-07-01_1645_H1SUSITMX_M0_WhiteNoise_{L,T,V,R,P,Y}_0p01to50Hz_OpenLoopGainTF.xml r12366
ITMY M0
- Measurements taken with suspension in HEALTH_CHECK but with damping loops on
- optic align offsets off, L2->R0 damping off, etc
- We needed to adjust the excitation filters for V and Y, plus lower the amplitude by a factor of at least 5x to keep the suspension dac from overflowing and saturating. These excitation filters were originally matches to the ETM ones, but we had to adjust them.
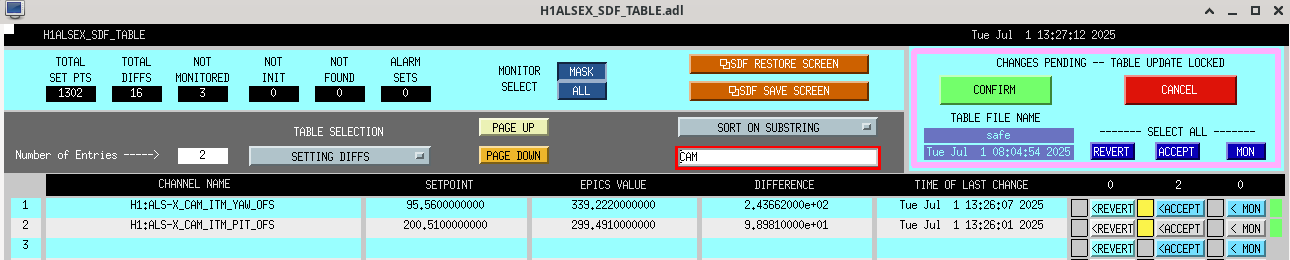
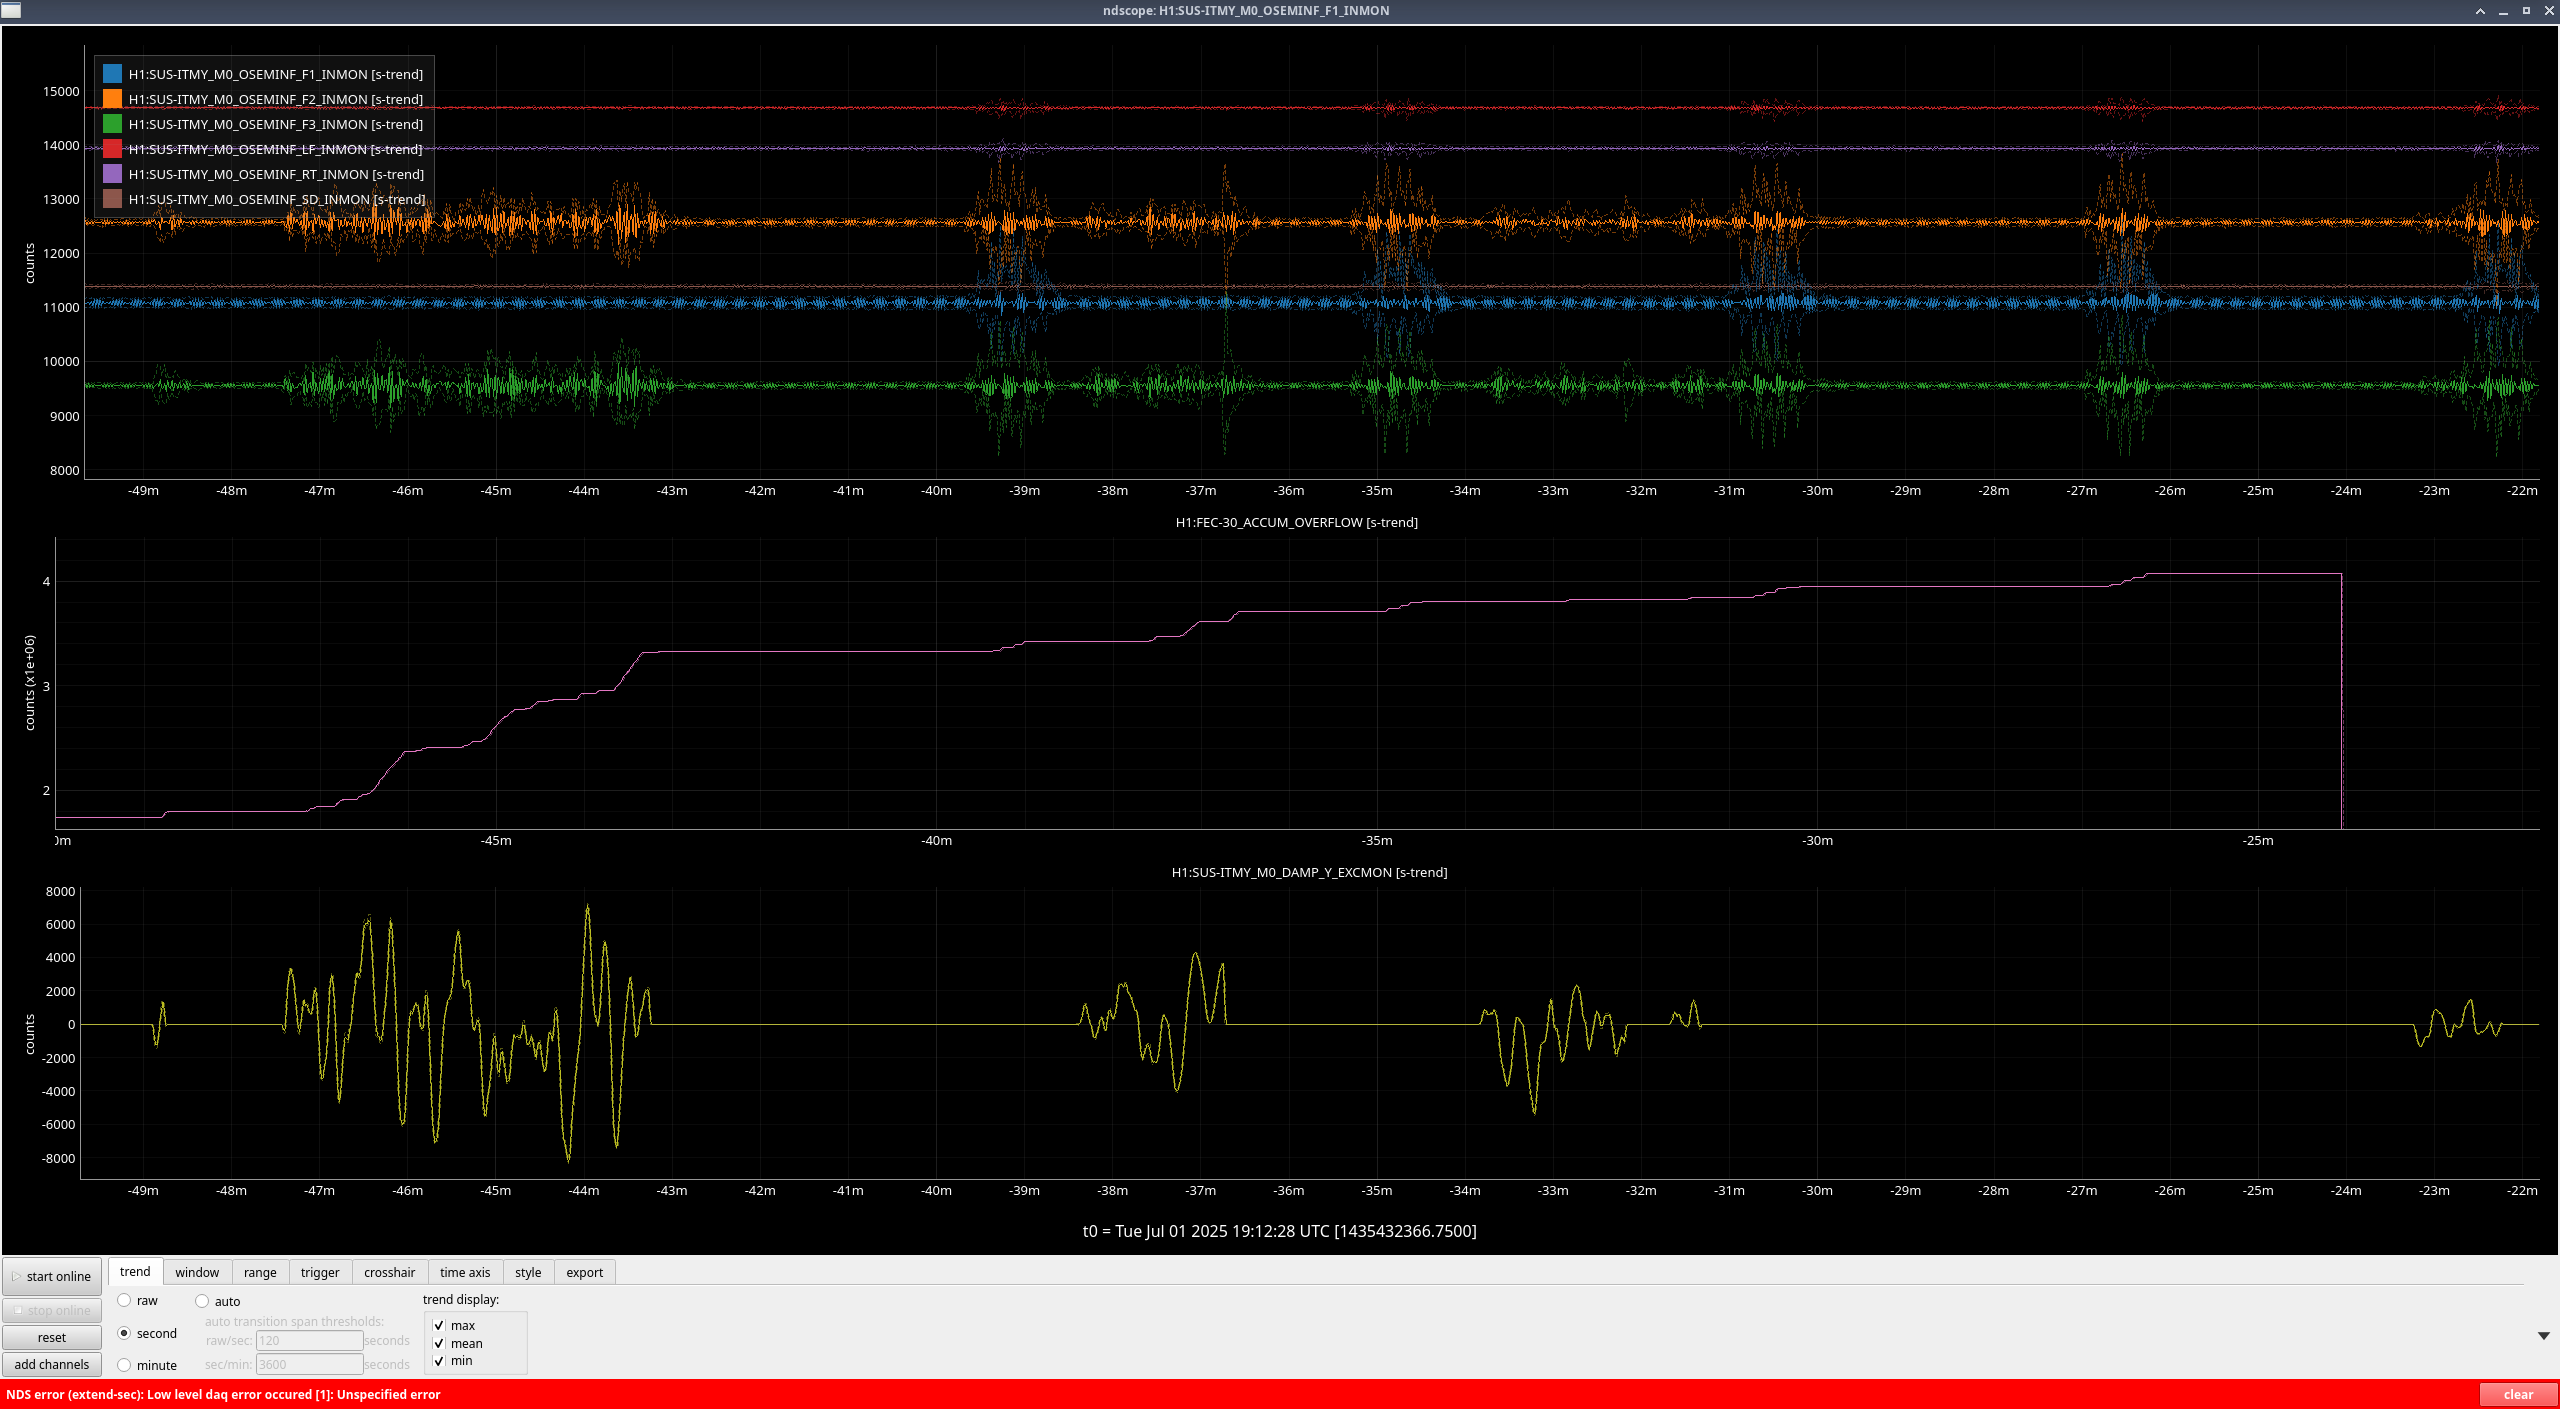
- When trying take Y, there was noise affecting mainly F1/F2/F3 (ndscope1, ndscope2) that was happening every ~4mins. Every time it happened it would cause overflows as well. This made it really hard to get a Y measurement, so the Y here looks pretty bad. We can try another time to get the data for Y. We don't know why this was happening but it stopped once we left HEALTH_CHECK (but it didn't start when we first entered HEALTH_CHECK)
Data: 2025-07-01_1700_H1SUSITMY_M0_WhiteNoise_{L,T,V,R,P,Y}_0p01to50Hz_OpenLoopGainTF.xml r12369
0.1:5 (new) satamp OLG TFs
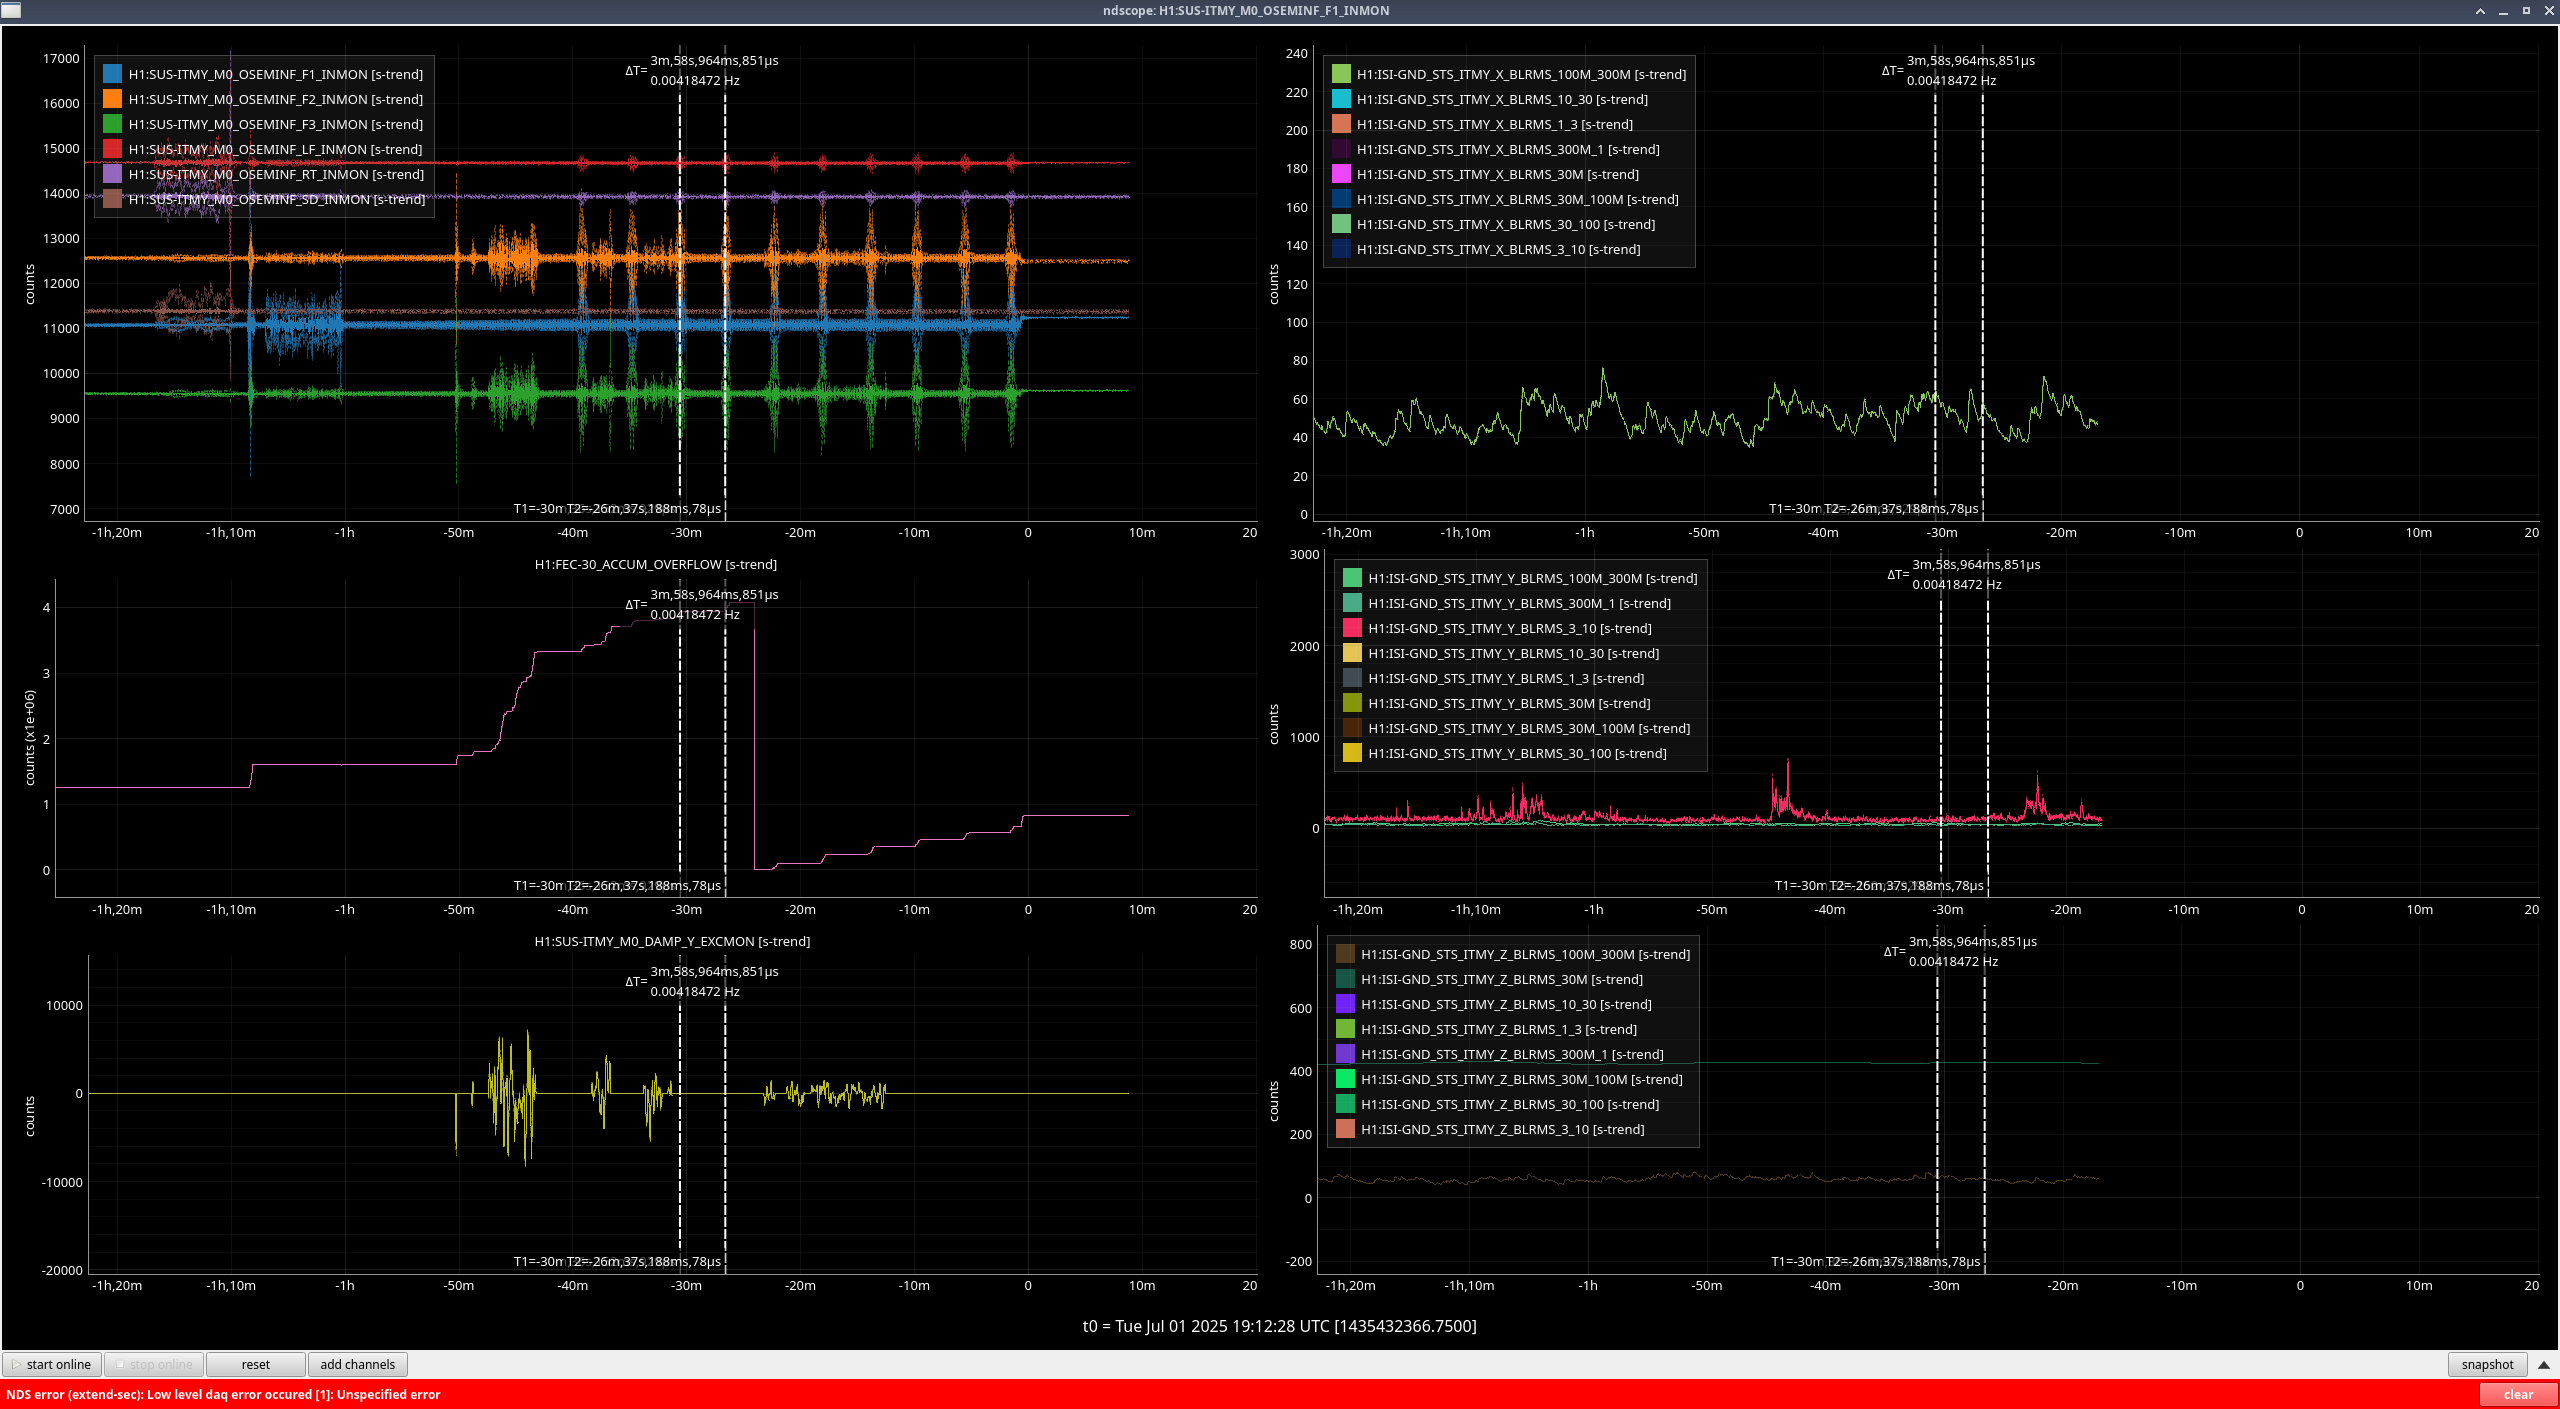
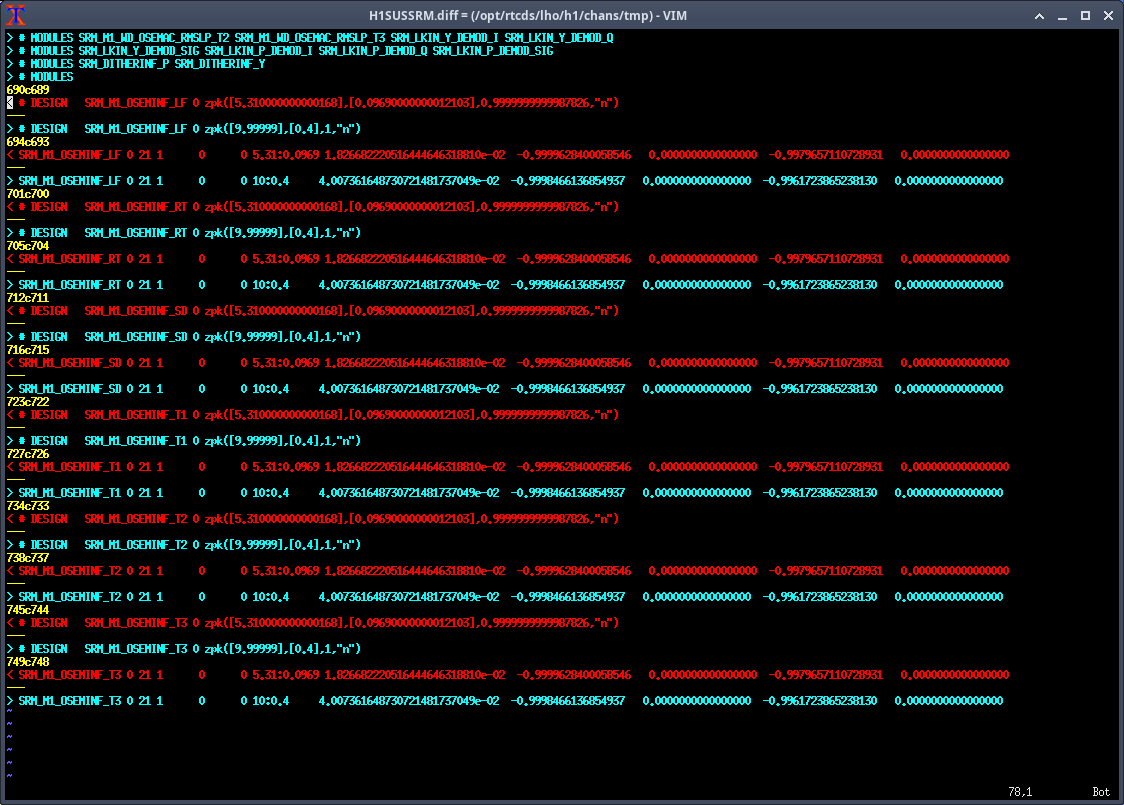
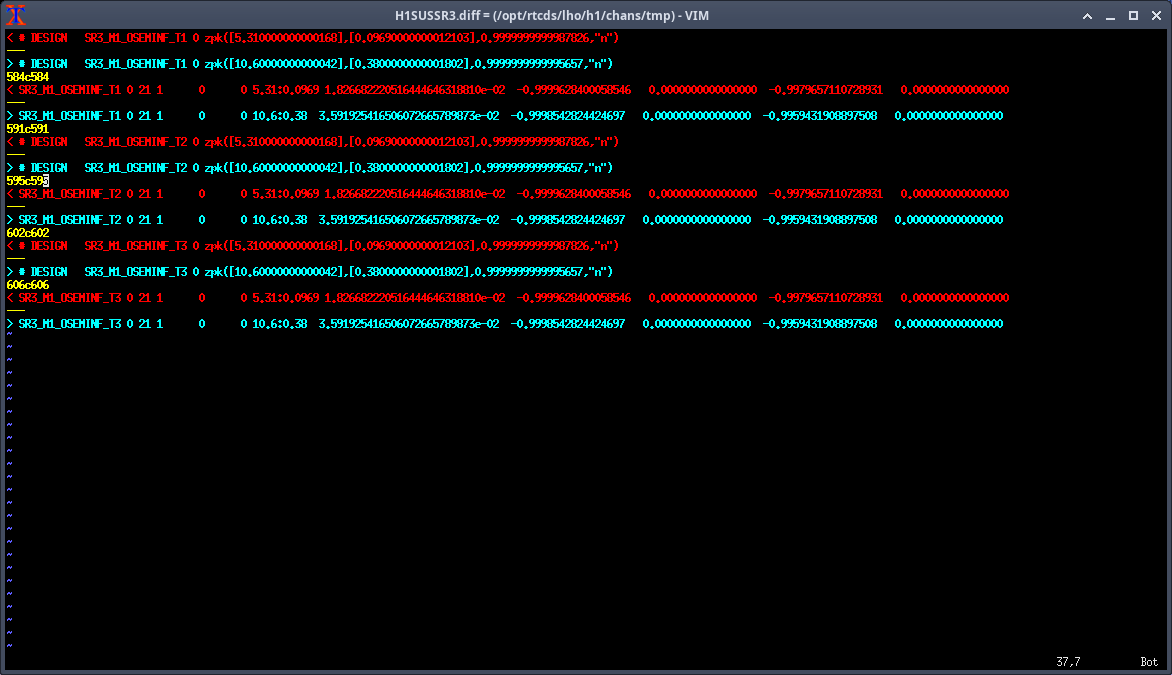
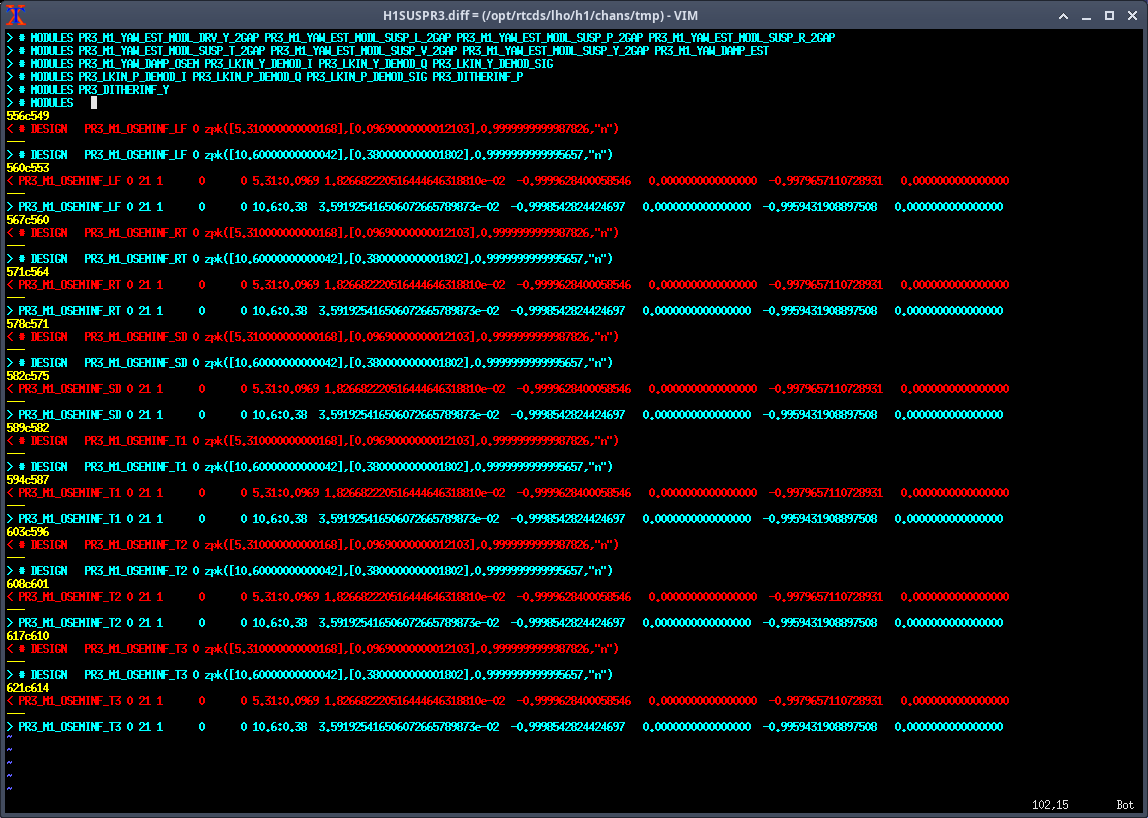
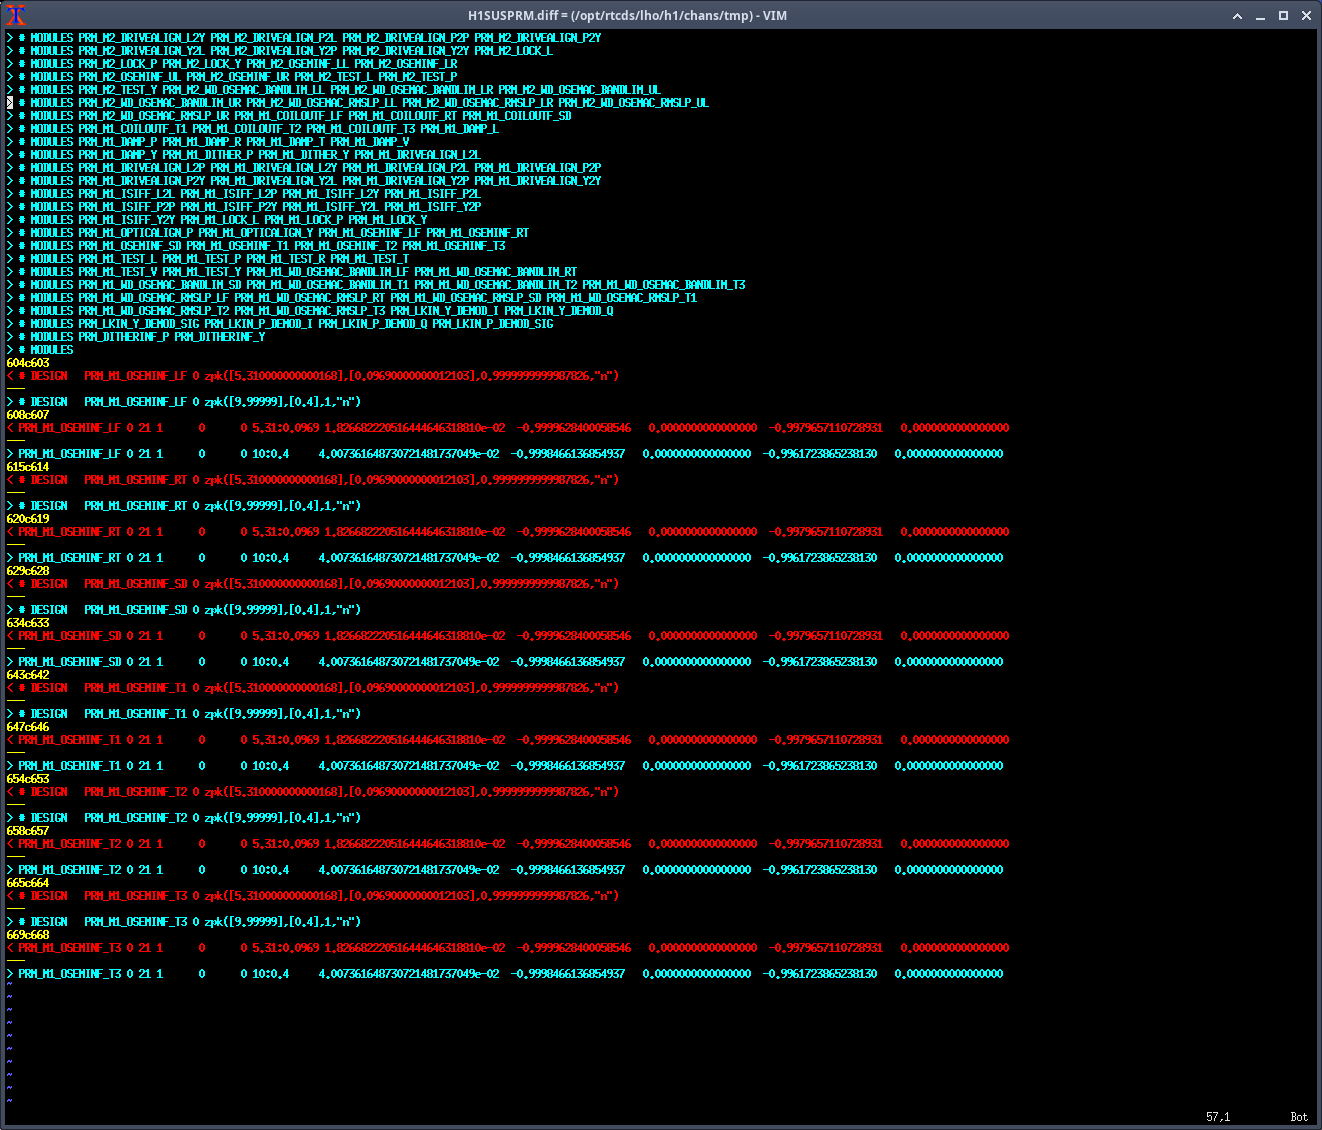
Note: for all of the following measurements, the OSEMINF FM1 filter had been updated from 10.4:0.38 to 5.31:0.0969 to match the new 0.0969:5.31 satamp (85471)
PRM M1
- Measurements taken with suspension in HEALTH_CHECK but with damping loops on
- optic align offsets off, etc
- We needed to increase the exc gain to match the decrease in damping loop gain (-0.5)
Data: 2025-07-01_1815_H1SUSPRM_M1_CDBIOState_1_WhiteNoise_{L,T,V,R,P,Y}_0p01to100Hz_OpenLoopGainTF.xml r12368
PR3 M1
- Measurements taken with suspension in HEALTH_CHECK but with damping loops on
- optic align offsets off, etc
- We found that some dofs were being very underdriven, so we upped the gain by 10 or 100x
Data: 2025-07-01_1820_H1SUSPR3_M1_WhiteNoise_{L,T,V,R,P,Y}_0p02to50Hz_OpenLoopGainTF.xml r12367
SRM M1
- Measurements taken with suspension in HEALTH_CHECK but with damping loops on AND optic align offsets ON
- We needed to increase the exc gain to match the decrease in damping loop gain (-0.5)
Data: 2025-07-01_1900_H1SUSSRM_M1_WhiteNoise_{L,T,V,R,P,Y}_0p02to50Hz_OpenLoopGainTF.xml r12372
SR3 M1
- Measurements taken with suspension in HEALTH_CHECK but with damping loops on
- optic align offsets off, etc
- We found that some dofs were being very underdriven, so we upped the gain by 10 or 100x
Data: 2025-07-01_1830_H1SUSSR3_M1_WhiteNoise_Y_0p02to50Hz_OpenLoopGainTF.xml r12371
Main takeaways:
- ITMY Y was bad due to some strange mystery noise and needs to be retaken
- PRM, PR3, SRM, SR3 all had new satamps and updated OSEMINF FM1 filters to match
- SRM measurements were taken with optic align offsets ON