Aidan (remotely), Nutsinee, TJ (in spirit), Kiwamu,
The return beam of the Hartman system for ITMX (HWSX, alog 36332) was successfully found on the HWS table today after people performed the full initial alignment process once.
We then centered the HWSX return beam to the Hartman camera. We are ready to repeat the measurement of the hot spot (34853).
(some details)
We followed the procedure written in T1700101-v2.
Nutsinee and I went to the HWS table after the initial alignment had been done. First of all, looking at the Hartman beam with respect to the two irises on the table, we confirmed that the Hartman beam had stayed in a good shape. We then started checking the periscope mirrors to look for the green light down from the X arm. We immediately found the green light on the top periscope mirror. Carefully inspecting the spot position on the mirror, we determined that the beam was well centered with a precision of about 5mm or so.
We steered the top and bottom periscope mirrors to make the green light centered on both irises. Finally, we steered the steering mirror in front of the Hartman camera while watching the stream live image of the camera. We found the Hartman return beam on the stream image right away. We then touched the top periscope mirror and the steering mirror to fine-tune the beam/aperture locations.
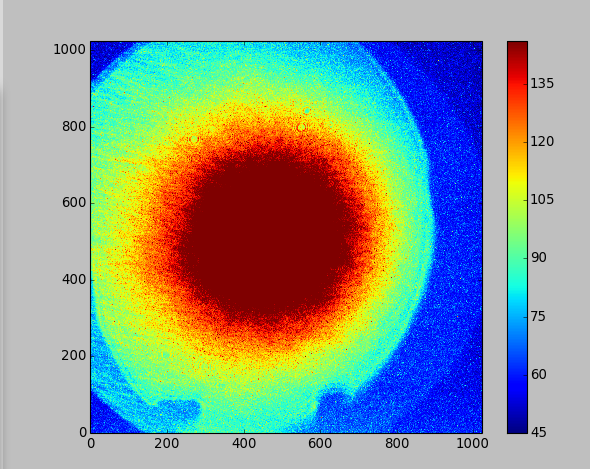
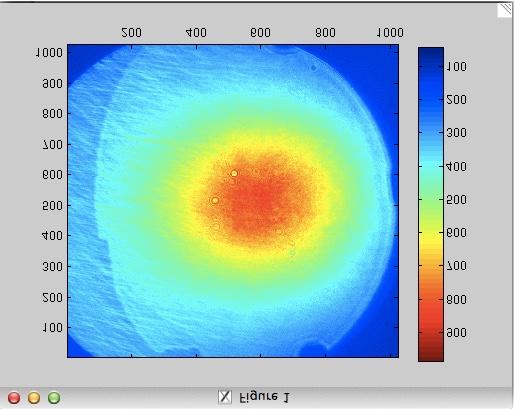
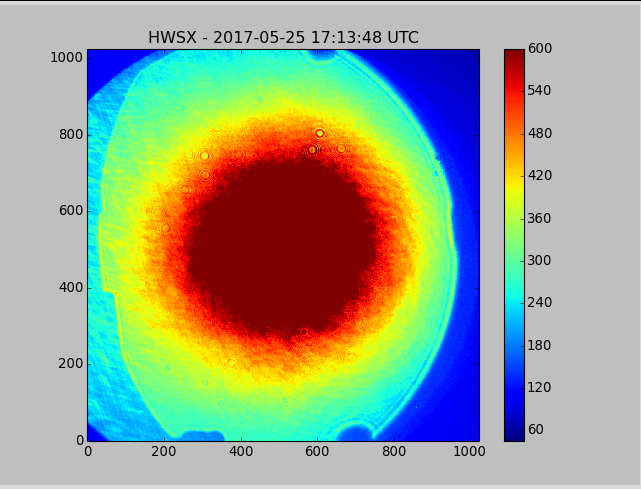
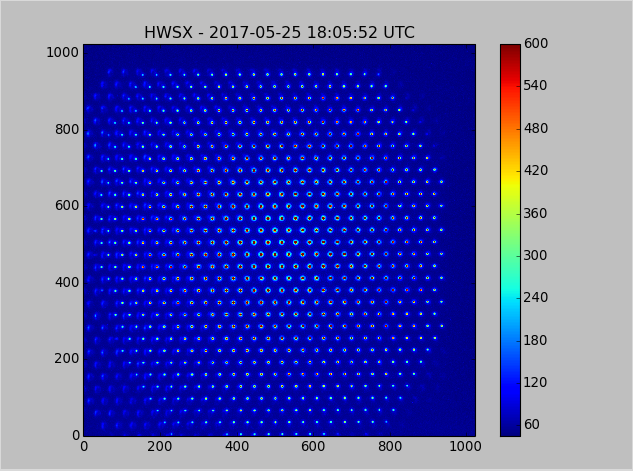
The attached are the images after we finished aligning the return beam to the camera with and without the Hartman plate.


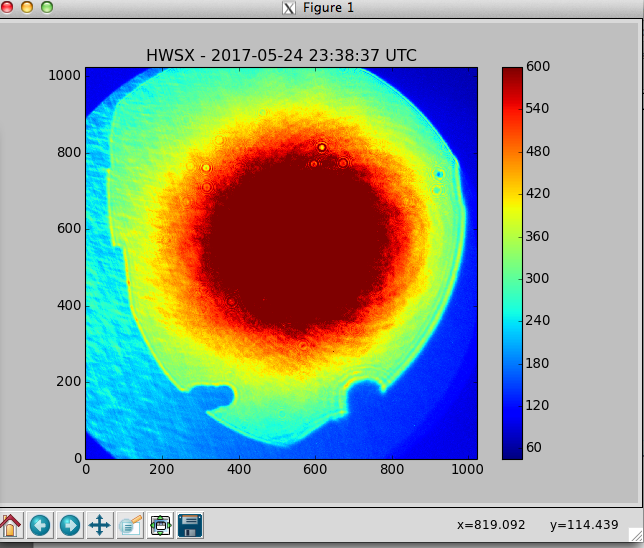
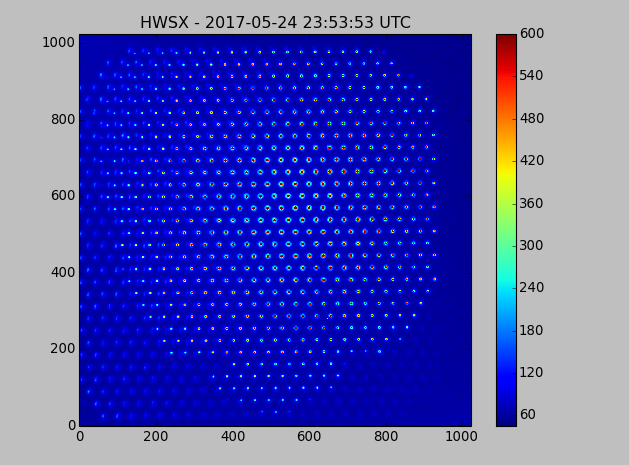
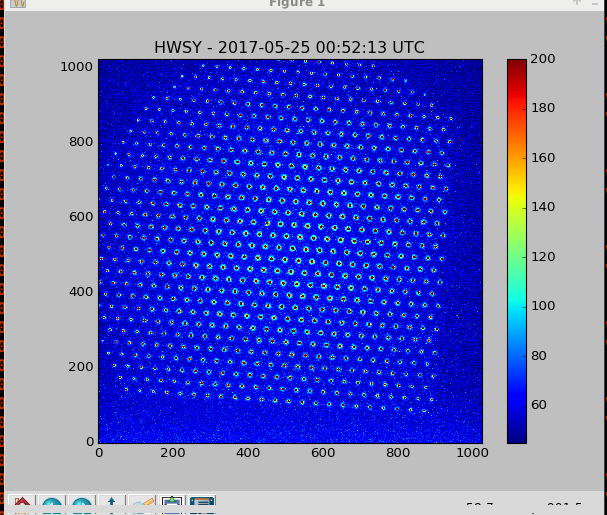
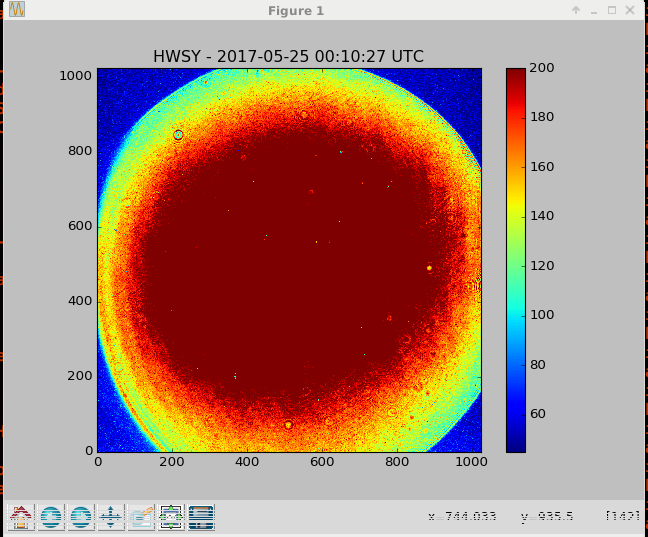
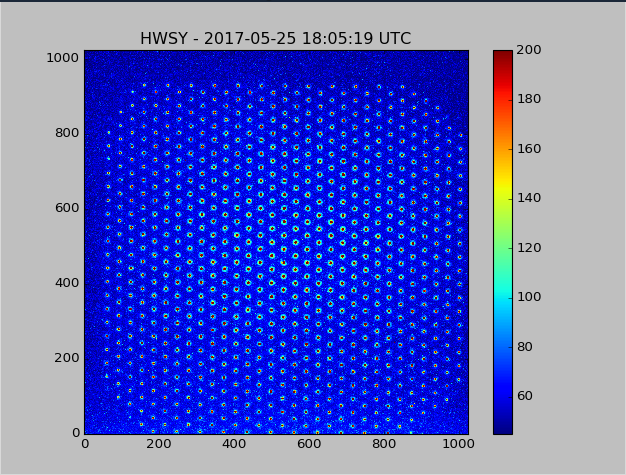

Subbing for TJ