travis.sadecki@LIGO.ORG - posted 14:02, Thursday 04 May 2017 (36028)
Observing at 21:01 UTC
OpLev laser swap is complete. Back to Observing.
OpLev laser swap is complete. Back to Observing.
For Jason to swap ITMy OpLev laser. WP#6616.
Shifter: Beverly Berger
LHO fellow: Evan Goetz
For full results see here.
We are back to being locked at NLN. Nutsinee is still running some measurements and the cleaning crew is still working on the cleanroom. We will remain in Commissioning mode until either the cleaning crew is done or LLO come back on line, which ever occurs first.
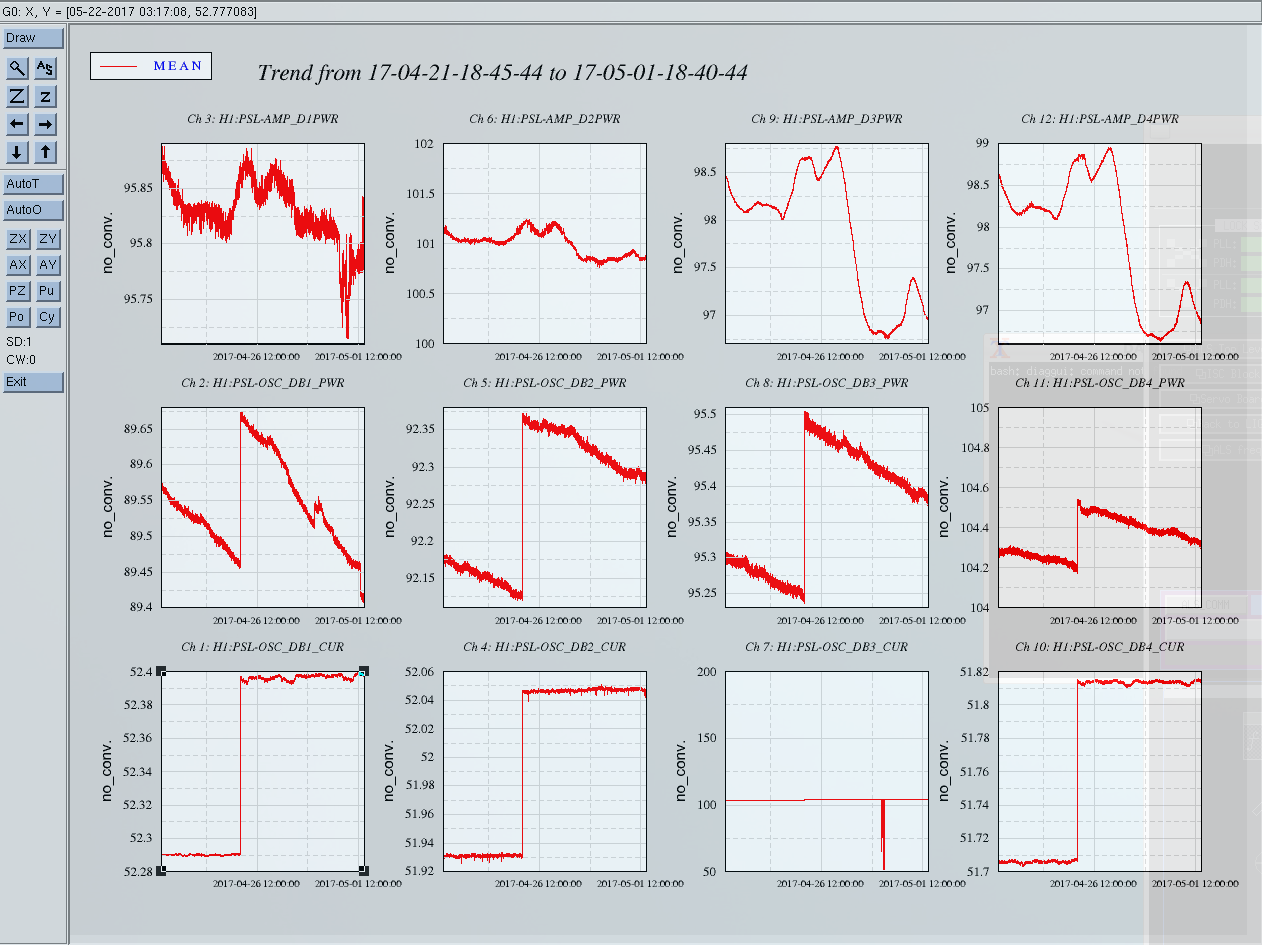
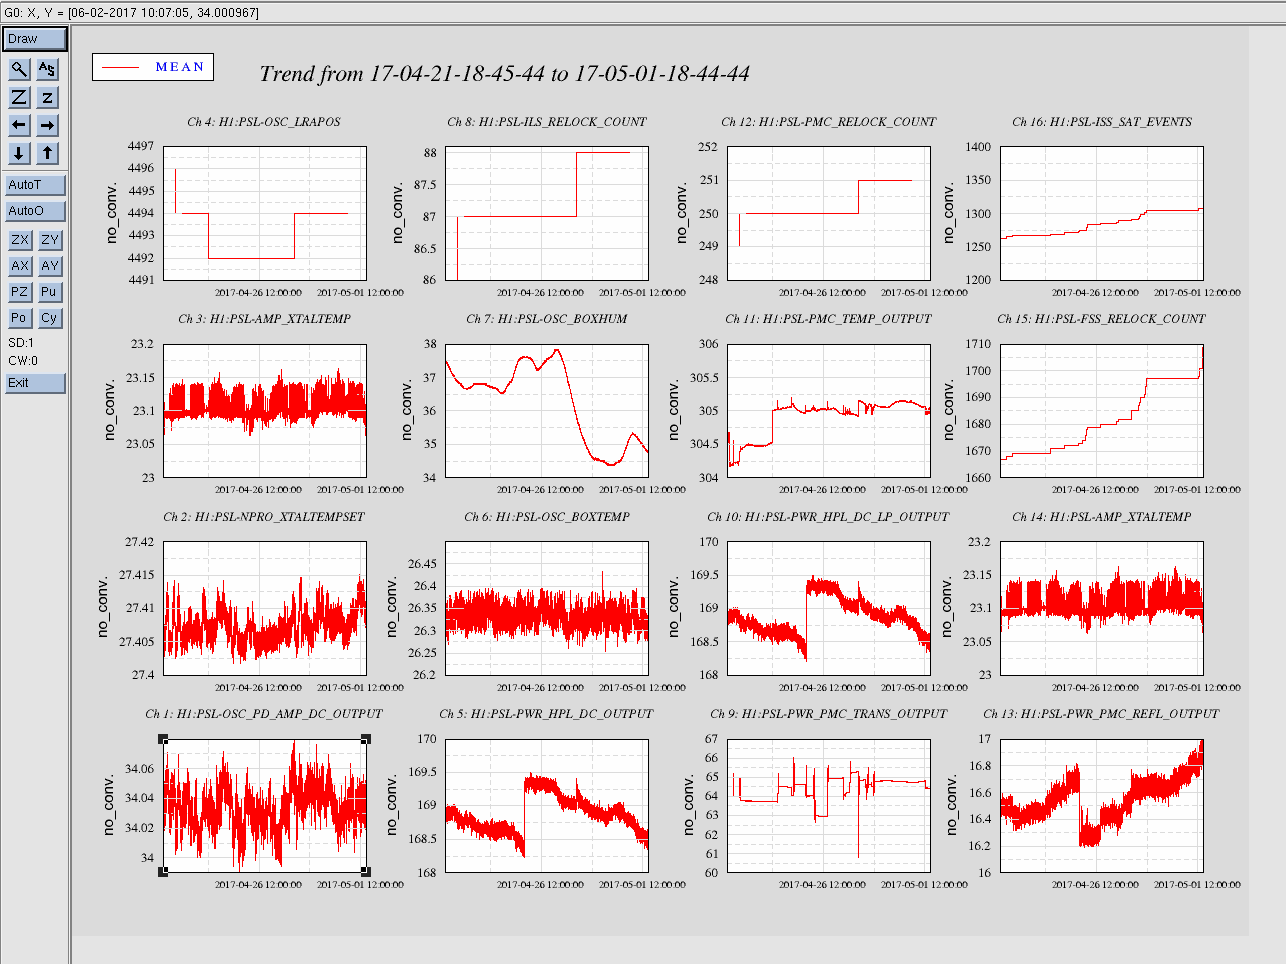
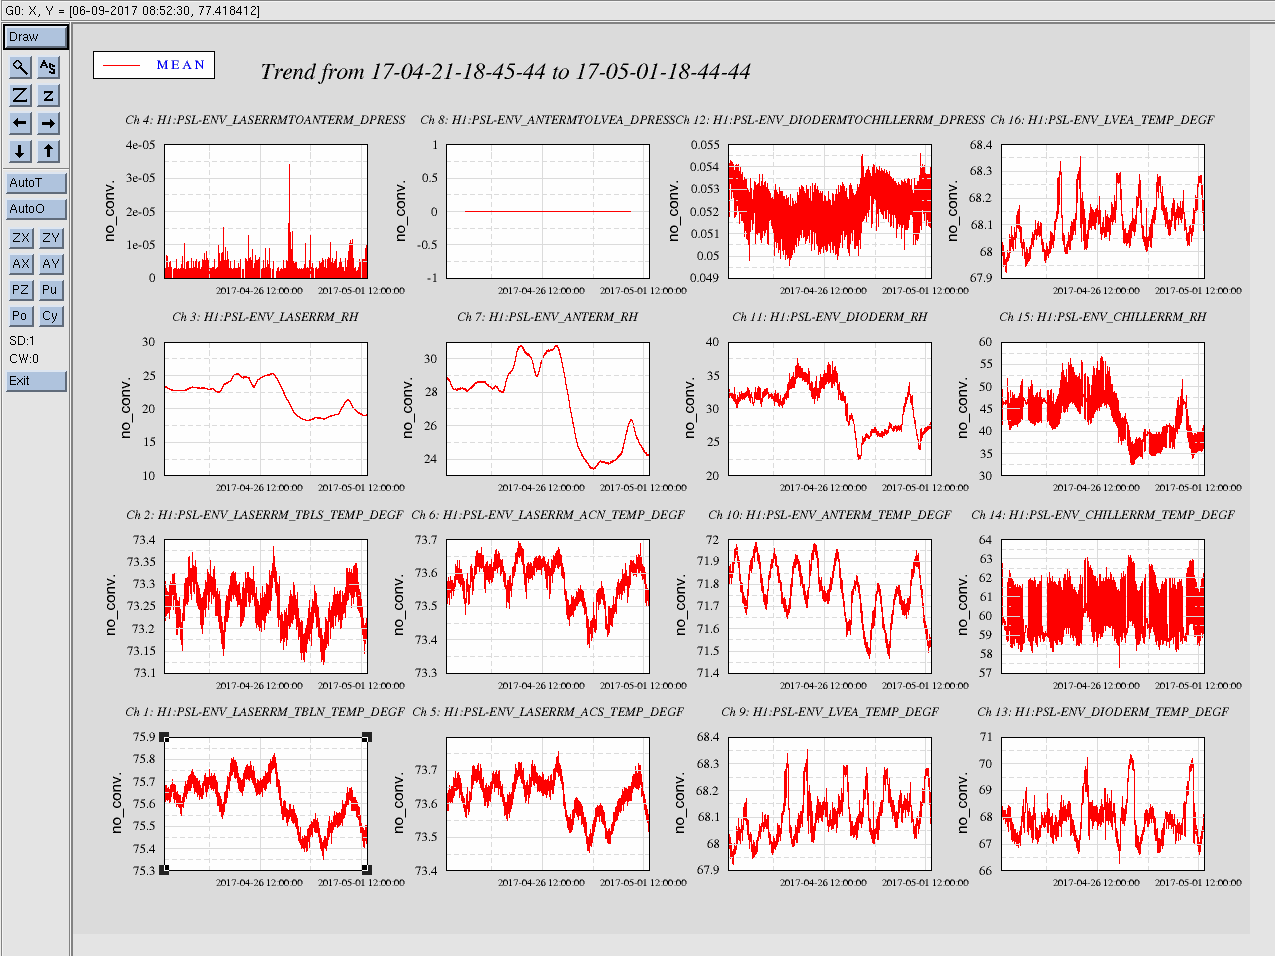
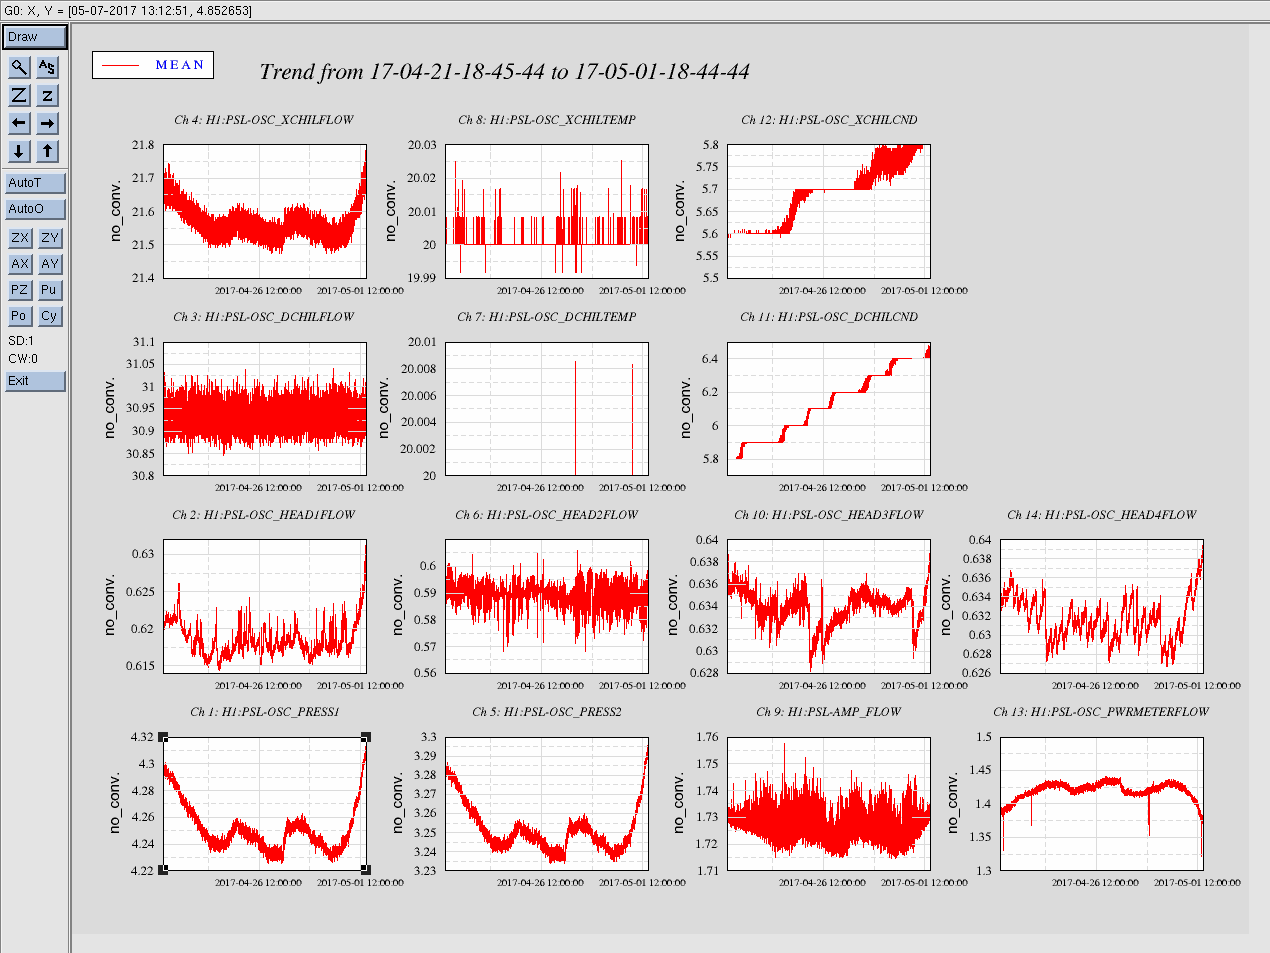
Attaching screenshot of plots. CLOSING out FAMIS #4726.
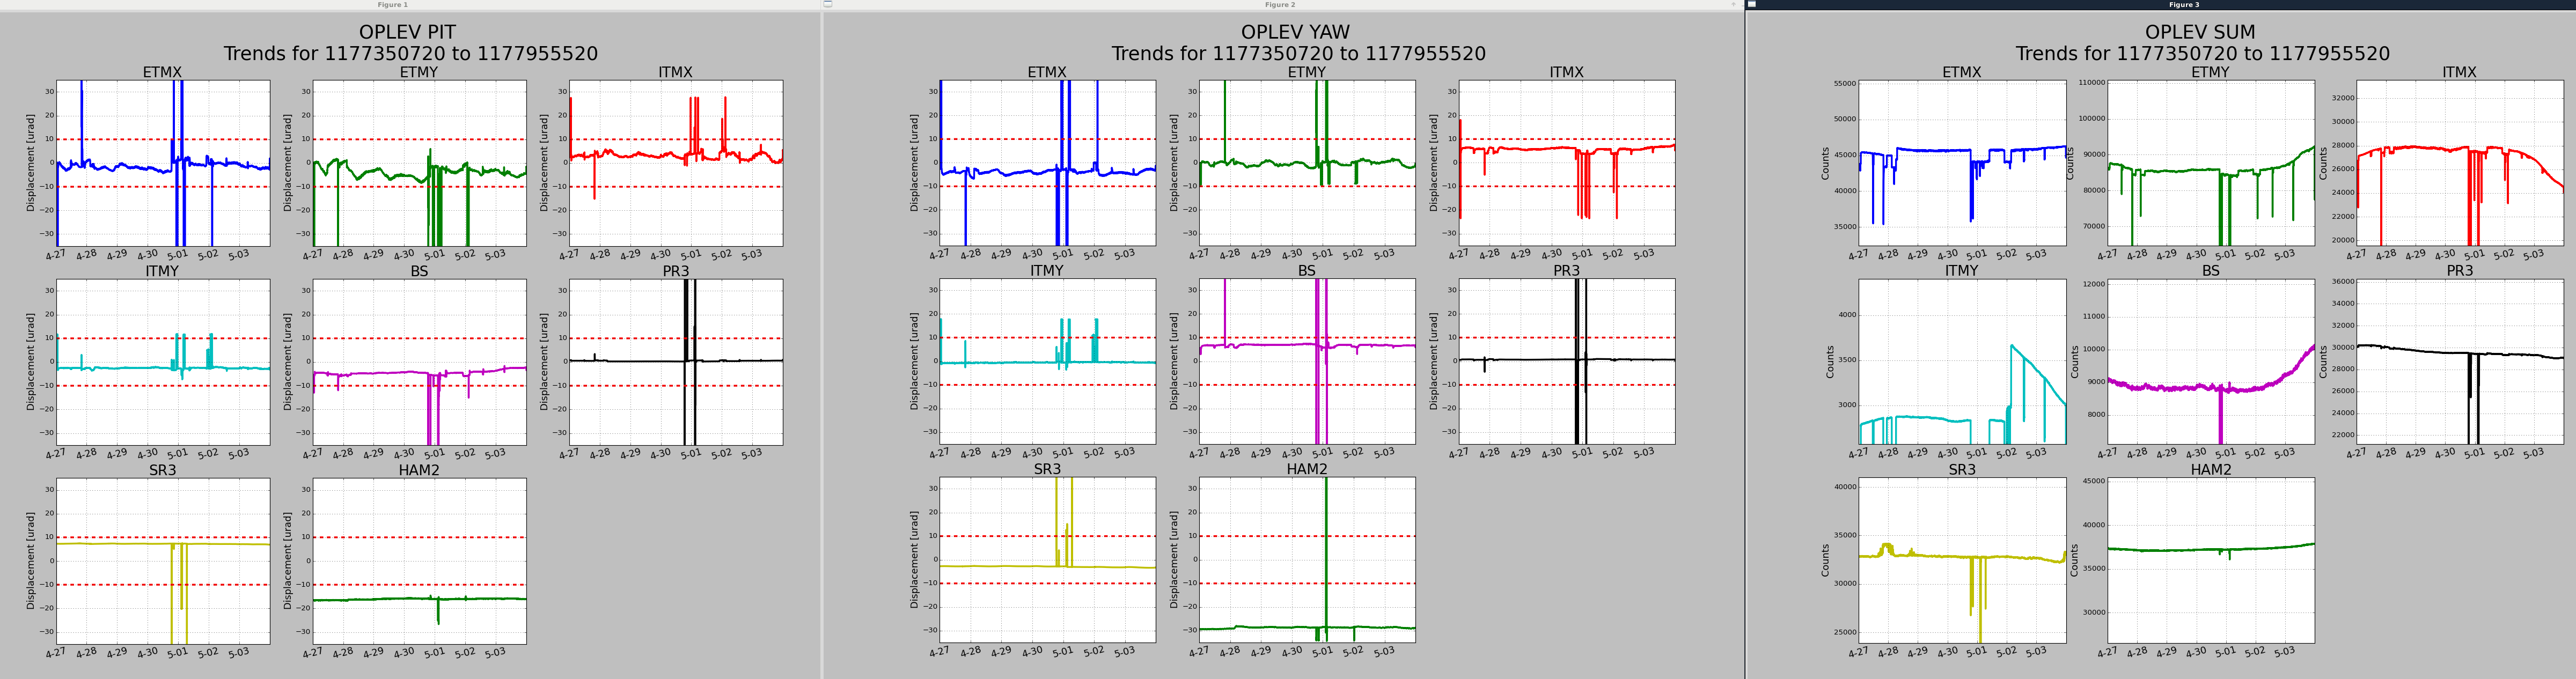
Everything with these trends looks normal, except for the ITMy SUM. This now appears to be a failing laser diode (previous issue reported here), so the oplev laser was swapped this afternoon while LLO was down.
For the HAM2 oplev, this can likely be removed from the script as the HAM oplevs are now set for decomissioning (ECR E1700123 and ECR tracker 7884).
Possibly related to cleaning activities. Nutsinee is taking advantage of the coincident downtime to reinstall HWS plates at both end stations and take some measurements during relocking.
However, we are in Commissioning mode for the cleanroom cleaning and LLO is still down.:(
Sheila helped me sort out the issue from yesterday's attempt at these measurements. Today they were performed successfully while we were in Maintenance for cleaning for the upcoming vent. Results can be found in /ligo/home/sheila.dwyer/PEM/HPI_injections_fire_pump:
HPI_HAM2_X4May2017.xml
HPI_HAM2_Y4May2017.xml
HPI_HAM2_Z4May2017.xml
Note these are NOT HEPI injections as the titles may have you believe. They are ISI injections. I'll leave it to Sheila to move and rename them appropriately.
Out of Observing at 15:52 UTC to let the cleaning crew get started on the second (first?) cleaning of the cleanroom in the beer garden. Set OPS_OBSERVATORY_MODE to PREVENTATIVE MAINTENANCE since there is no obvious choice for cleaning activities.
Added 250 mL H20 to Xtal chiller. Diode chiller is OK. Filter appear clean. This closes FAMIS 6521.
TITLE: 05/4 Day Shift: 15:00-23:00 UTC (08:00-16:00 PST), all times posted in UTC
STATE of H1: Observing
OUTGOING OPERATOR: Jeff
QUICK SUMMARY: No issues were handed off. Lock is just over 14 hours old.
Shift Summary: Run A2L check script. Pitch is OK; Yaw is up to 0.7. LLO is down, dropped out of Observing to run A2L repair script. Wind and seismic are starting to rise. Otherwise, good observing shift with no issues to report.
Locked and observing for past 10 hours. Wind, weather, and seismic are all OK. There have been a few glitches, but no other concerns at this time.
TITLE: 05/04 Eve Shift: 23:00-07:00 UTC (16:00-00:00 PST), all times posted in UTC
STATE of H1: Observing at 65Mpc
INCOMING OPERATOR: Jeff
SHIFT SUMMARY: LLO is down for the night with fast shutter problems and severe weather. Here, we have been very glitchy for the past ~8hrs, not sure why. Range is still okay and we have been locked for 6hrs.
LOG:
Not sure of the cause. TCS IMTY laser lock its lock point 15min prior, but quickly found it again so that doesnt seem to be the issue.
I could not get the lockloss tool to work, I got the error:
"RuntimeError: Low level daq error occured [13]: Requested data were not found.
There is a gap in H1:GRD-ISC_LOCK_STATE_N"
I will see if I can dig up anything on that error after locking.
Back to Observing at 00:53UTC. No issues coming back up.
TJ Massinger, Derek Davis, Laura Nuttall
Summary: the intervention on April 26th cleaned up the ETMY oplev glitching but the ETMX oplev is still causing problems. Both noise sources have been seen to cause loud background triggers for transient searches when they're glitching.
Since the end station oplev laser glitches have been seen to couple into h(t), we had to develop vetoes based on the BLRMS of the OPLEV_SUM channels to flag and remove these transients from CBC and Burst searches. Using the thresholds that capture the coupling into h(t), we were able to take some long trends of the impact of the oplev glitching using the veto evaluation toolkit (VET).
ETMY results: https://ldas-jobs.ligo-wa.caltech.edu/~tjmassin/detchar/VET/ETMY_OPLEV/1176422418-1177779618/65/
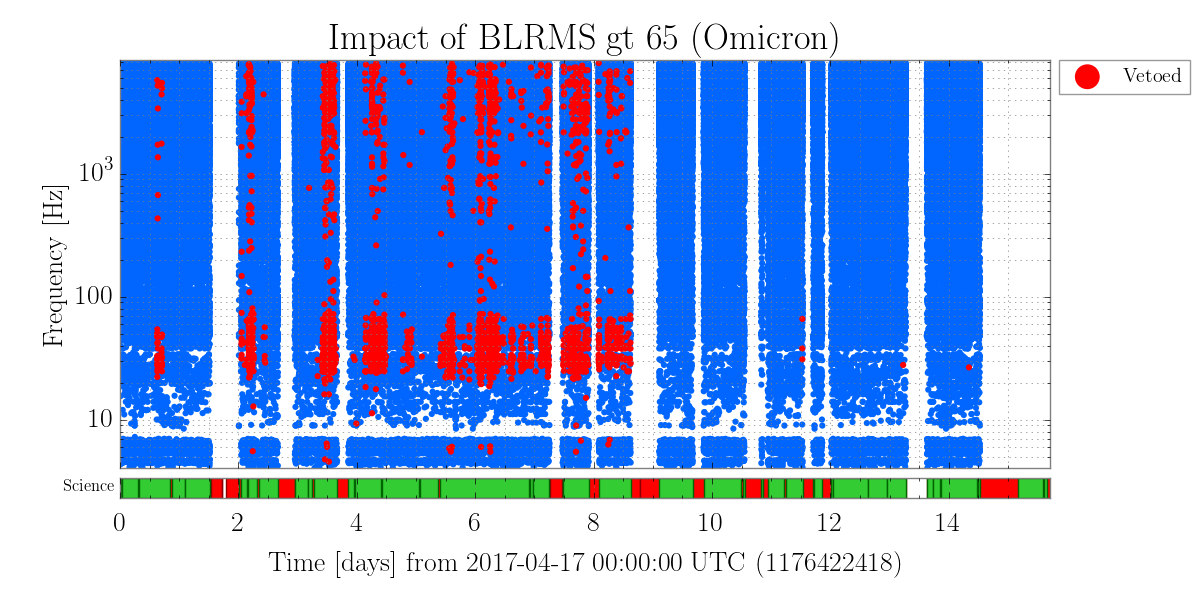
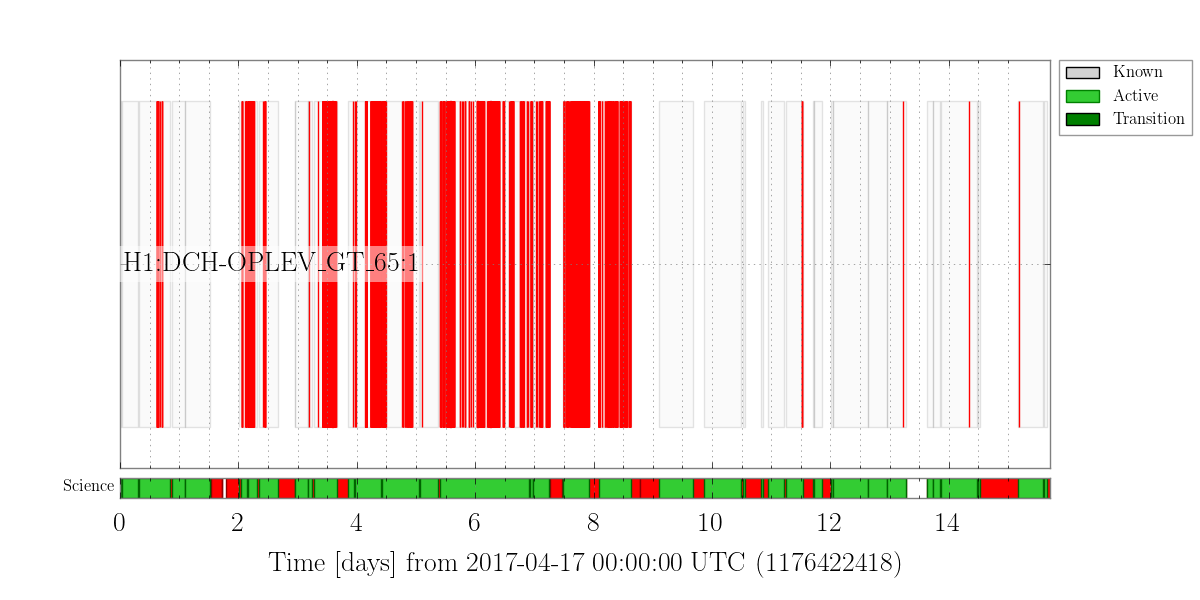
The take home message from this result page is the Omicron glitchgrams. In the first attached image, every blue point is an Omicron trigger. Those in red are triggers coincident with the ETMY L3 OPLEV SUM having a high 10-50 Hz BLRMS. This population of glitches in the bucket was severely damaging for transient searches, but the problem seems to have gone away since the intervention on April 26th (alog 35798). Looking at the segments where the OPLEV SUM BLRMS was high (attachment 2), we see that after April 26th there are few times when the flag is active, which indicates that there are fewer fluctuations in the OPLEV SUM readout.
ETMX results: https://ldas-jobs.ligo-wa.caltech.edu/~tjmassin/detchar/VET/ETMX_OPLEV/1176422418-1177779618/7_5/
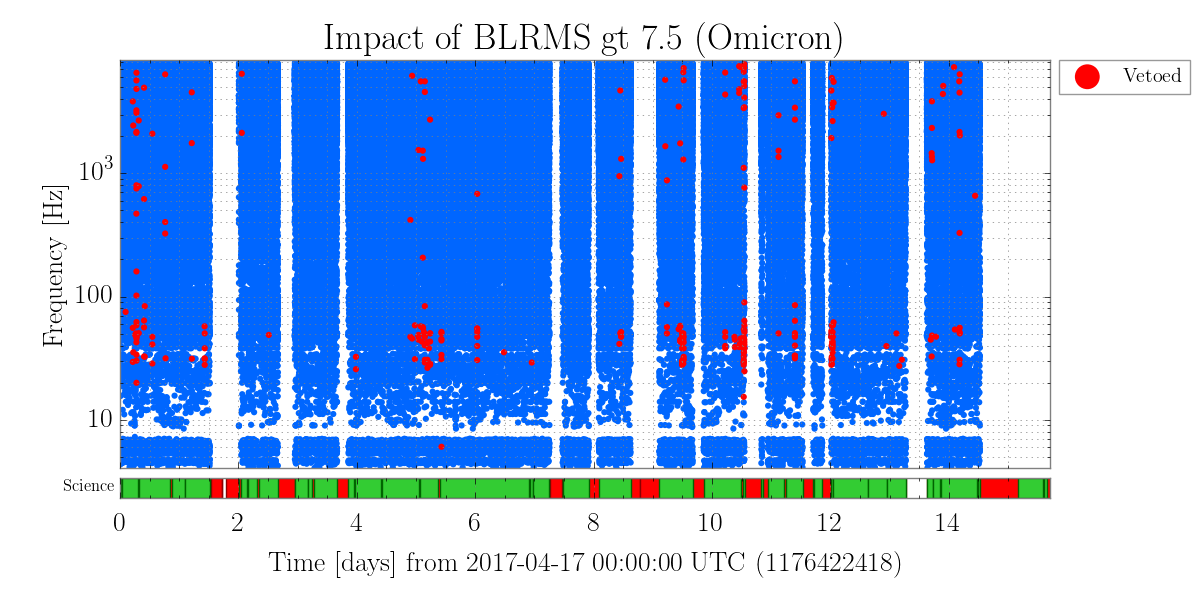
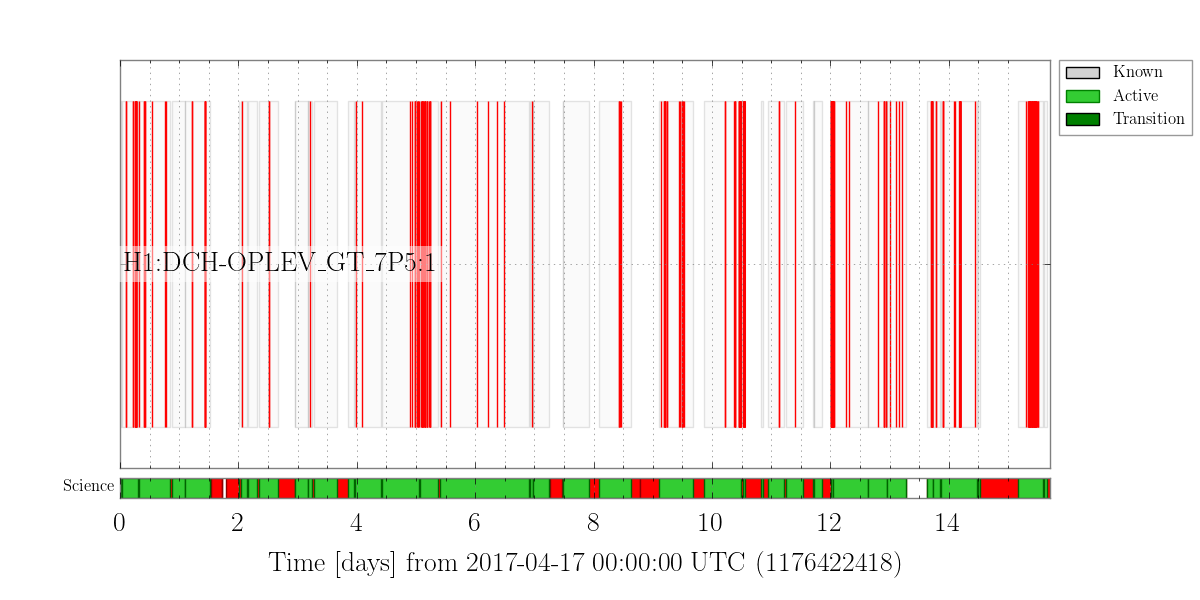
Once again, looking at the Omicron glitchgram (attachment 3), every blue point is an Omicron trigger. Those in red are trigger coincident with ETMX L3 OPLEV SUM having a high 45-100 Hz BLRMS (chosen to capture the power fluctuations in the oplev). The ETMX oplev glitches aren't quite as damaging as the ETMY oplev glitches, but they're still producing loud background triggers in the transient searches. Looking at the segments where this flag was active (attachment 4), we see that the ETMX oplev laser has been glitching on and off over the last two weeks and coupling into h(t).
I talked to Jason Oberling about this earlier, and it sounds like the same quick fix that worked for ETMY won't work for ETMX, since that laser is already operating near the high end of its power range and I turned up the power on friday (35887). Jason is working on tuning up the one other laser that he has to be ready to make a swap on Tuesday, but the ITMY oplev laser may also be failing so the new laser might be needed for that. If we need to fix the problem in hardware, the only immediate option we have is to turn off the oplev completely, which will mean that we loose our only independent reference of the optic angle. We're reluctant to loose this especially since we have had several computer crashes recently.
Is the message of the alog above that the veto is good enough until the laser can be fixed (probably not until the vent)?
Also, although Jason can probably fix this laser in a few weeks, these lasers fail frequently and we probably will continue to have problems like this throughout the rest of the run.
It would be interesting if detchar can also have a look at ITMs and L1. I'd like to know if similar glitches in oplev power causes similar glitches in DARM regardless of the test mass and IFO, which should be the case if it's radiation pressure.
Sheila: The OPLEV SUM channels are good witnesses for this, so we can monitor them and veto glitchy times from the searches. The deadtime from the ETMX glitches isn't much, VET shows 0.04% deadtime over the roughly two weeks I ran this for, so it's not damaging to the search in terms of analysis time if we need to continue to veto them.
Keita: I'm also curious about the ITMs and L1, they're next up on the list.
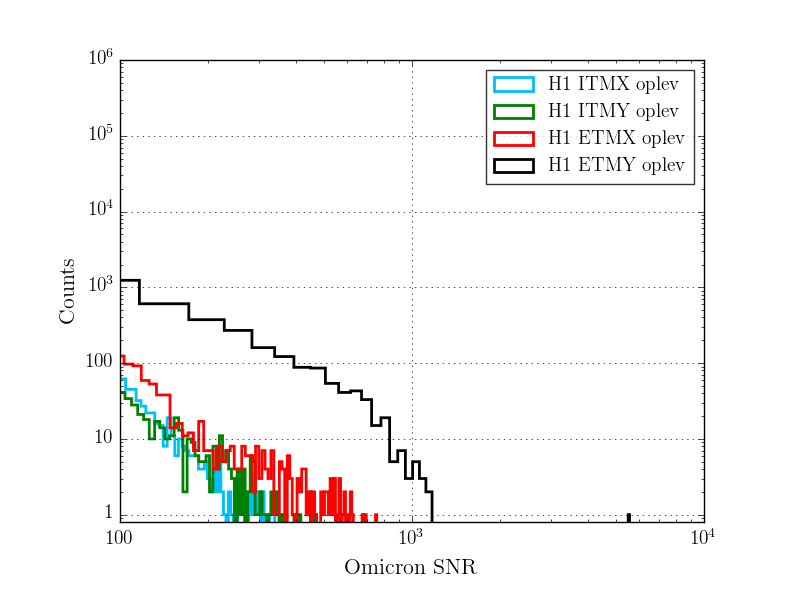
Keita: It looks like the glitches in the ITMs typically have a lower SNR than those in the ETMs. I mentioned this in LLO alog 33531, but will attach the relevant figure here as well.
The attached figure shows SNR histograms of Omicron triggers from the LHO test mass OPLEV_SUM channels with the x-axis restricted to show loud (SNR > 100) triggers. The loudest SNR Omicron triggers in the ITM OPLEV_SUM channels are 450 and 550 for ITMX and ITMY respectively and they're part of a sparse tail of loud triggers. For ETMX and ETMY, the loudest Omicron triggers have SNR 750 and 5500 for ETMX and ETMY respectively and both have a higher population of loud glitches (ETMY in particular).
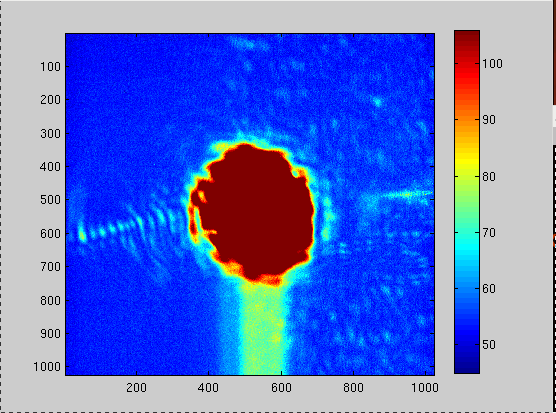
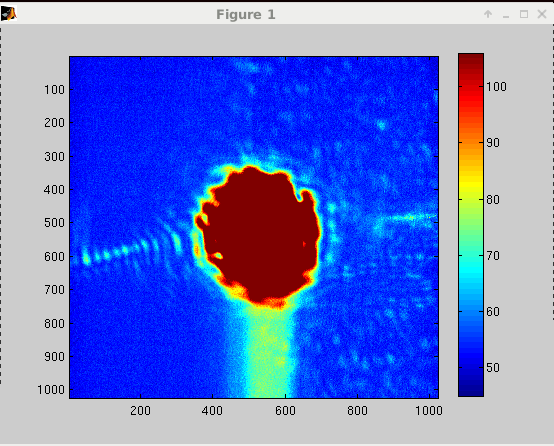
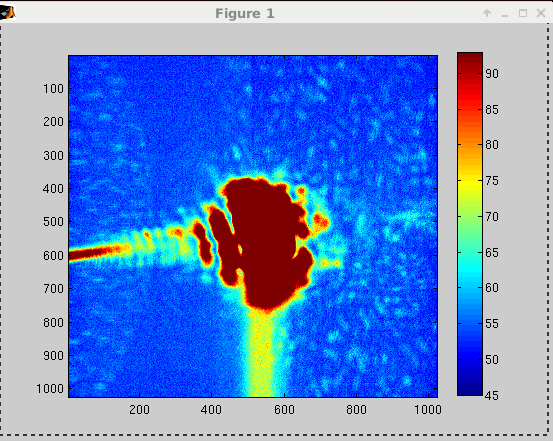
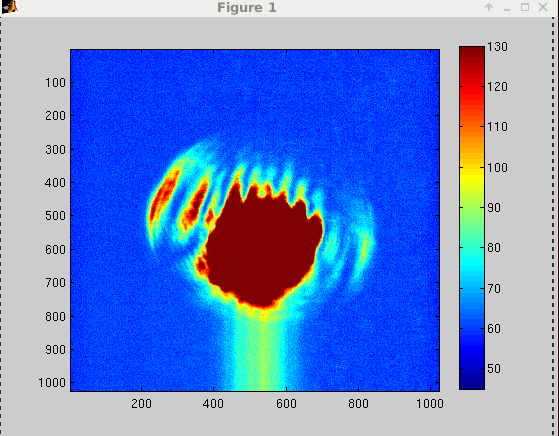
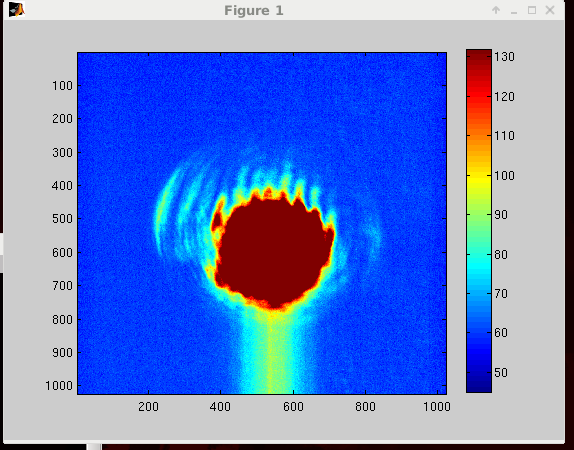
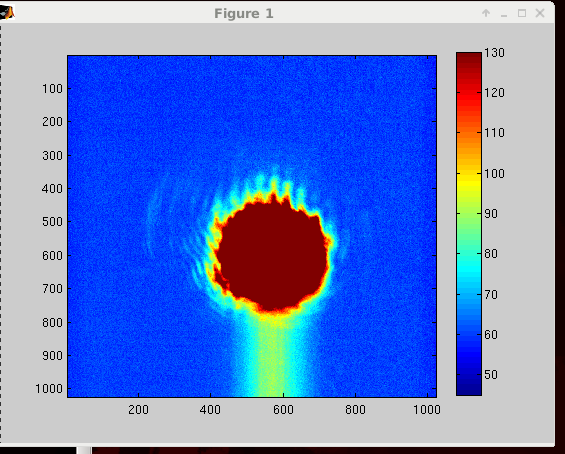
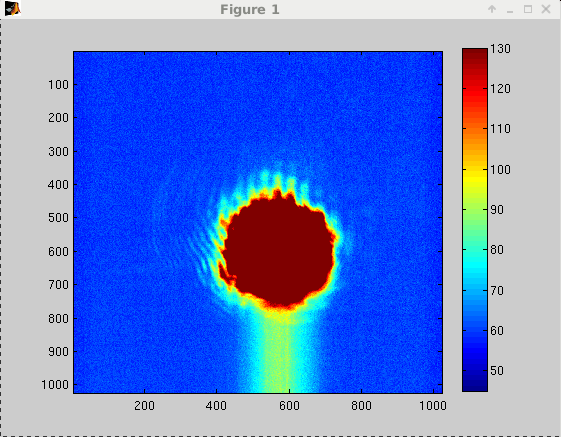
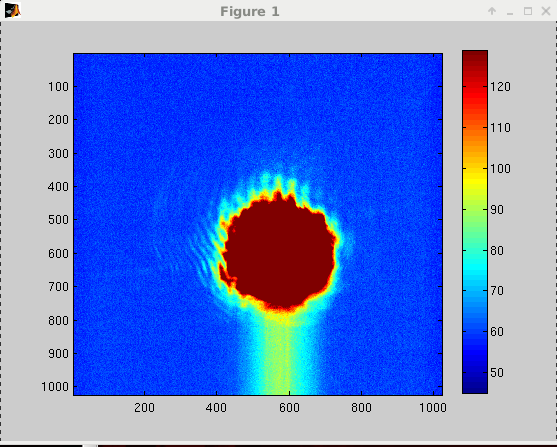
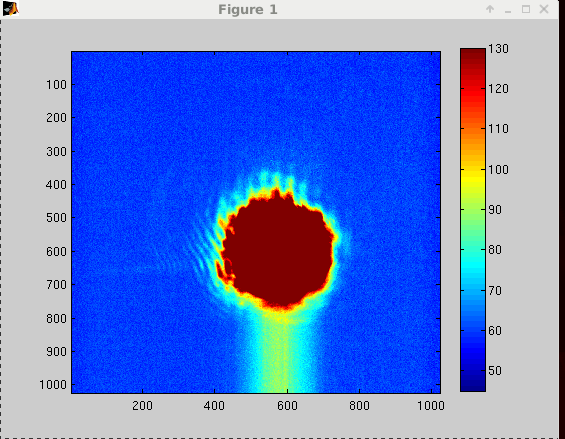
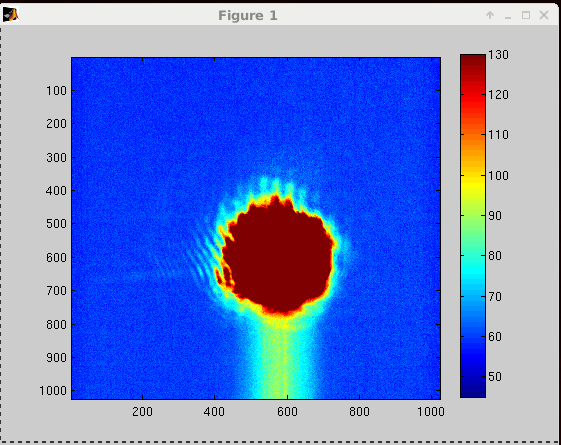
To be able to take measurement with HWS at the end stations we need a proper PZT offset for both EX and EY to get rid of the reflection coming off of the ITMs during full lock (when the arm is locked in RED). Today I tested Elli's EX PZT2 offset from 2 years ago (alog17860) while taken the past and current PZT2 YAW output into account. A quick conclusion is the sum of output + misalign bias that Elli figured out still gives goodish image on the HWSX camera, but needed fine tuning.
How to lock arms in red (one at a time, this is for X arm)
1) Request INITIAL_ALIGNMENT on the ISC_LOCK guardian, take ALIGN_IFO to DOWN then request XARM_IR_LOCKED
2) If ALIGN_IFO guardian stuck at LOCKING_XARM_IR, the arm is too misalign. Do INITIAL_ALIGNMENT for the arm that you want (or both)
Once the arms are locked in green, they are good for red too. Go back to LOCKING_XARM_IR
Guardian will misalign PRM, SRM, ITMY, and ETMY. Make sure no one else is using these.
Misaligning ALSX PZT2
1) Turn off H1:ALSX_PZT2_YAW_OUTEN. This is an ON/OFF switch. The switch can be found in SITEMAP>ALSX Overview, PZT2_YAW
Make sure you stream image so you can see the transition
2) Add YAW offset to H1:ALS-X_PZT2_YAW_MISALIGN_BIAS
3) Type of misalignment => make it SUM
4) Click Misalign.
To revert the configuration, make sure to watch out for the growing output before turning the OUTEN switch back on. If the number grows, turn the integrator off and bleed rate on. The counts will slowly ramp down.
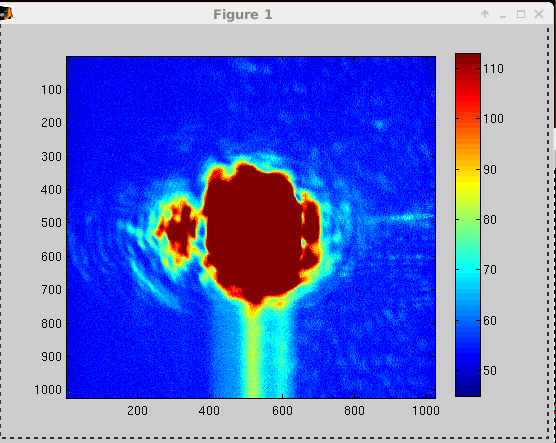
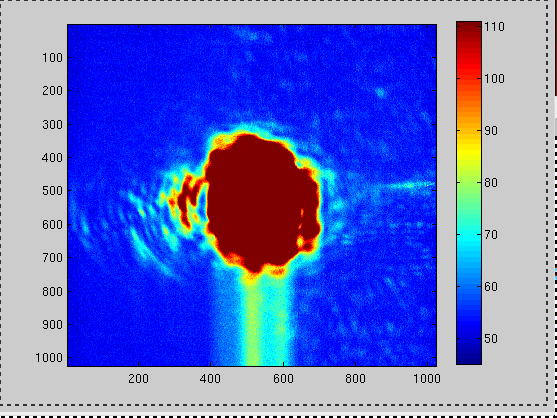
I compared my streamed images to Elli's using the same matlab script. But the images don't look quite the same (mine seem a bit more saturated). On April 24 I calculated the more recent offset to be -3381. This result in a very clipped-looking image on the HWSX so I went backward a little. -2400 seems to have given the best result. Today's PZT2 YAW output (~10340) + misalignment bias (-2400) sum up to be 7940, 321 counts different from Elli's sum (10919-3300 = 7619).
I'm afraid that ITMs alignment might also affect this offset. If there's no more commissioning time this week to take the data the offset should be checked again after the vent.
We had no problem going back to NLN later. If there was any hysteresis, it didn't case a problem.
HWS plates are currently off at both end stations.
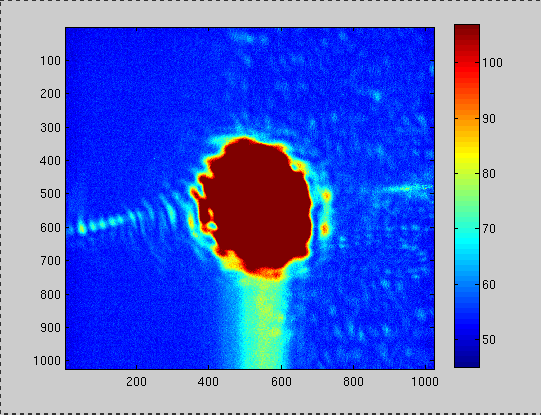
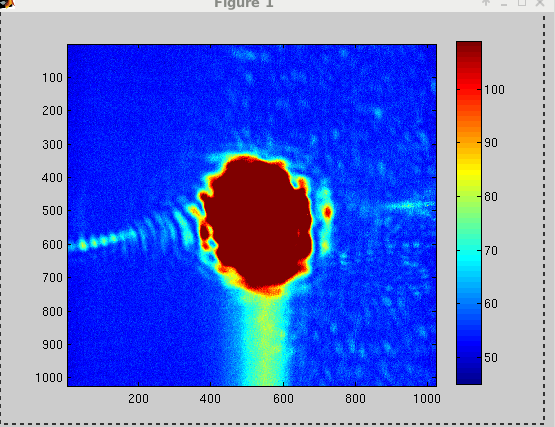
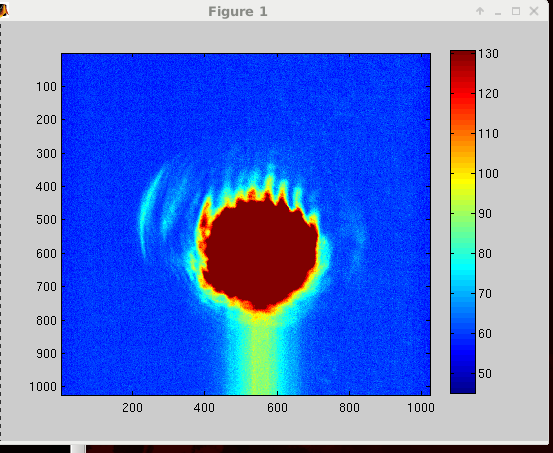
I had a chance to check EY PZT offset today. -3500 PZT2 YAW misalign bias worked best for H1:ALS-Y_PZT2_YAW_OUTPUT = 15233 (sum being 11733)
If there's a lockloss, we can take some data with End Stations HWS during the power up. Hartmann waveplates still have to be put back though. Waiting for an opportunistic down time.
Nothing unusual. There are obvious signs of diode current adjustments.
Concur with Ed, everything looks normal.