Added 250 mL H2O to the crystal chiller. No alarms on the diode chiller. The canister filters appear clear.
Added 250 mL H2O to the crystal chiller. No alarms on the diode chiller. The canister filters appear clear.
TITLE: 02/02 Owl Shift: 08:00-16:00 UTC (00:00-08:00 PST), all times posted in UTC
STATE of H1: Observing at 68Mpc
INCOMING OPERATOR: Corey
SHIFT SUMMARY: 4735 Hz started off high in the beginning of this lock but damped down very quickly. Locked and Observe the rest of the night.
TITLE: 02/02 Owl Shift: 08:00-16:00 UTC (00:00-08:00 PST), all times posted in UTC
STATE of H1: Observing at 66Mpc
OUTGOING OPERATOR: Jim
CURRENT ENVIRONMENT: Wind: 7mph Gusts, 6mph 5min avg Primary useism: 0.02 μm/s Secondary useism: 0.68 μm/s
QUICK SUMMARY: PI issue solved (alog33833). Back to Observe and hopefully stay there for the rest of the night.
TITLE: 02/02 Eve Shift: 00:00-08:00 UTC (16:00-00:00 PST), all times posted in UTC
STATE of H1: Observing at 66Mpc
INCOMING OPERATOR: Nutsinee
SHIFT SUMMARY: PI's bad, finally back to observing
LOG:
Couldn't stay locked because of PI. I made new band passes to deal with shifted modes. Didn't realize there is a PLL frequency that also needs to be adjusted when you change the band pass filter. It's kind of buried in the middle of another step on the PI wiki. The PLL shouldn't have locked with this frequency too mismatched (how close is close enough?), but I could have swore I saw the PLL lock light going green. Nutsinee found and adjusted it, seems good now.
This entry is a follow up of one of the reported issues on my last DQ Shift.
The single lockloss that took place on the 2017-01-28 16:43:45 (UTC) or 1169657043 as reported by the segment database under flag H1:DMT-DC_READOUT_LOCKED:1
The thing that called my attention of this lockloss is that it was preceded by a not very common overflow, of channels H1:ASC-AS_C_SEG#. These channels are the ADC values of the 4 segments of a QPD located on the antisymmetric port for aligment sensing and control of signal recycling mirrors SRM and SR2.
A closer look of the lockloss pointed to several issues:
1) DMT Segment DMT-DC_READOUT_LOCKED:1 flags that inform when the detector is locked seems to be off. DMT segment generation should round the first sample of lock up to the next GPS second, and down for the end of a segment. So while the start second is included as locked, the stop second of the segment should not be included as locked. It would be of the type: [startgps stopgps). Looking at this particular lockloss seems this is not right:
DMT-DC_READOUT_LOCKED:1 --> 1169596818 1169657043
That means that the detector was locked up to GPS 1169657043, that corresponds to UTC 2017-01-28 16:43:45.
The way that flag is defined is: H1:DMT_DC_READOUT_LOCKED_s boolean "H1:DMT_DC_READOUT_s & H1:DMT_XARM_LOCK_s & H1:DMT_YARM_LOCK_s"
Where:
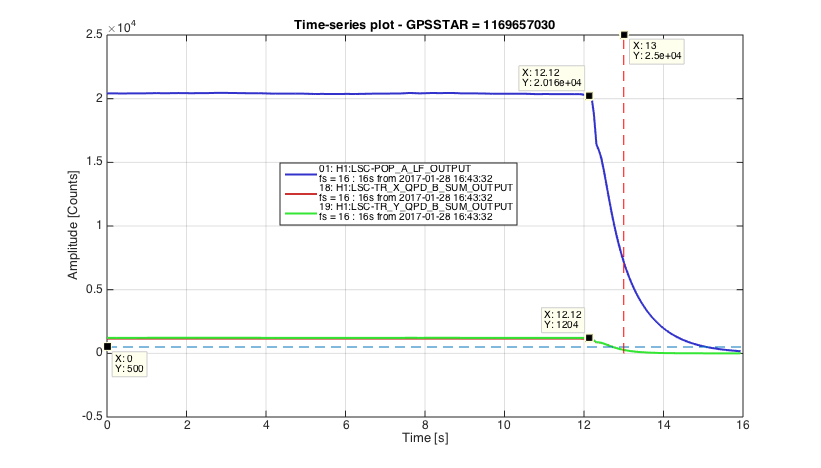
X-ARM Lock: H1:DMT_XARM_LOCK_s meanabove "H1:LSC-TR_X_QPD_B_SUM_OUTPUT" threshold=500
Y-ARM Lock: H1:DMT_YARM_LOCK_s meanabove "H1:LSC-TR_Y_QPD_B_SUM_OUTPUT" threshold=500
So I plot next these 2 channels, together with H1:LSC-POP_A_LF_OUTPUT which is an indication of the power built up on PR cavity so a good indication of having IFO locked. In dashed lines; blue is for the threshold=500 and red for the stop GPS of the lock segment. Clearly the detector was unlock before the stop GPS time of the flag:
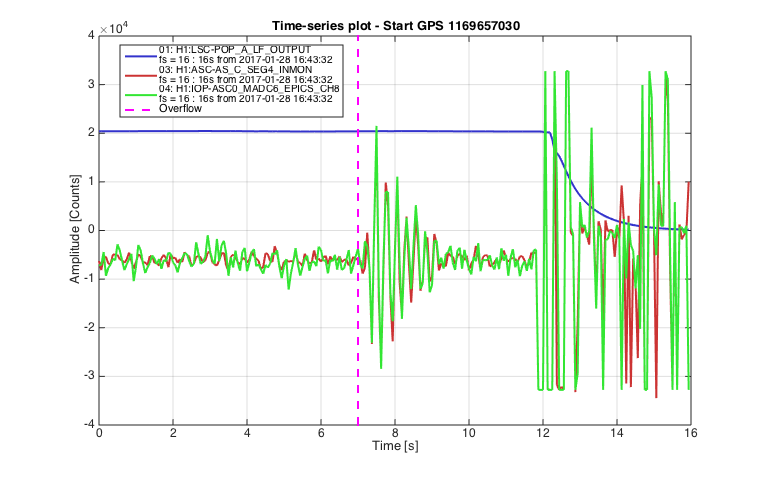
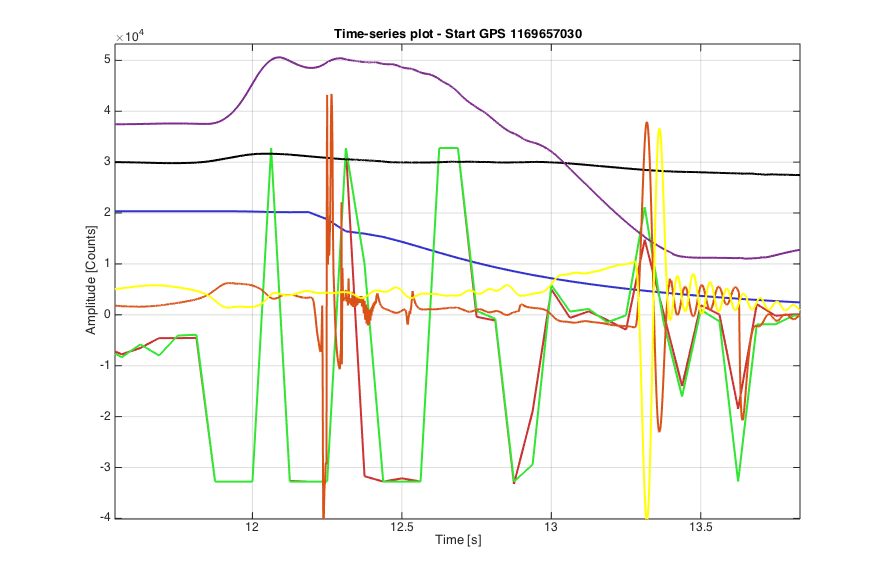
2) Now to the main issue of this post, the overflow of channels H1:ASC-AS_C_SEG# and the lockloss. I plot next the lockloss informaiton as indicated by H1:LSC-POP_A_LF_OUTPUT and I plot as well one of the saturating ADC channels H1:ASC-AS_C_SEG4 (from the H1ASC usermodel) together with the identical IOP model channels H1:IOP-ASC0_MADC6_EPICS_CH8, the first thing we notice is that they are not identical as they should. However notice that the usermodel channel is running at 2kHz while the IOP is running at 65kHz so while both channels are the same in principle to obtain H1:ASC-AS_C_SEG4 first we need to apply the downsampling filter to H1:IOP-ASC0_MADC6_EPICS_CH8 and then downsample it. In addition these plots are EPICS channels at 16Hz. Still there are considerable discrepancies. The vertical dashed magenta line represents the integer GPS time of the start of the overflow as given by the H1ASC usermodel Accumulative overflows: H1:FEC-19_ADC_OVERFLOW_ACC_4_8 (GPS 1169657037). Because the ADCs are 16 bits the overflow should happen at 2^15 = 32768. There are not such value in that second but notice that they are 16 bit downsampled channels so it must have been a very short duration overflow, they are more clear overflows of longer duration just before the lockloss but they were not reported on the Summary Pages maybe because it ignores 1 second before lockloss?:
Now to the interesting part.
It would be nice to look at the saturation channels at higher sampling rate but they are not stored in the frames. However what we have in the frames (at 2kHz which is the freq of the corresponding user model) is a combination of the 4 segment channels as the normalised sum (H1:ASC-AS_C_NSUM_OUT_DQ), this channel is then used to normalize also the combination used to generate Pitch and Yaw signals (for Yaw is H1:ASC-AS_C_YAW_OUT_DQ). I have scaled these 2 channels and overlap them with the previous plot as purple and black respectively:
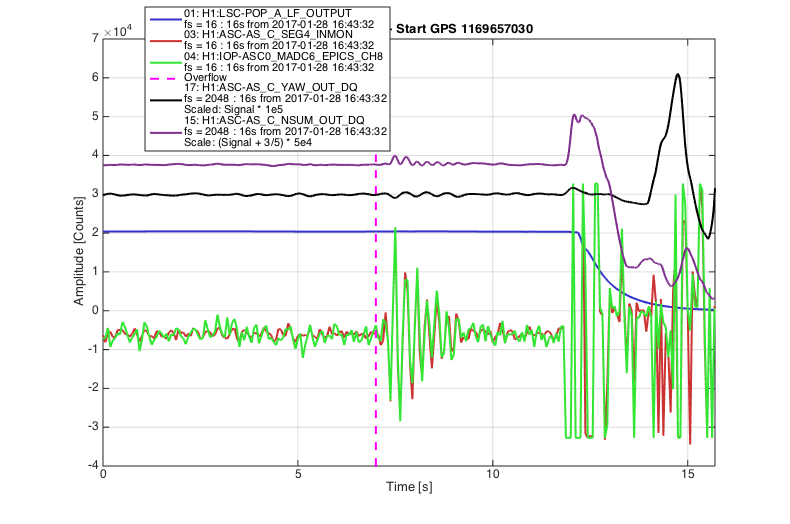
Notice how these NSUM and YAW channels oscillate after the overflows, as if it was a step response. In fact looking at the real time signals (with the help of David Barker) of the IOP channel H1:IOP-ASC0_MADC6_EPICS_CH8 and the equivalent usermodel channel H1:ASC-AS_C_SEG4, we observed that while the IOP saturated at 2^15 as expected, however the usermodel channel went above 50000 counts, the observation of these saturations are only possible when detector is unlocked as they happen often, it is not the case when the detector is locked. We then realised that this was due to the downsampling filters that are applied to the IOP channel (at 65kHz) to downsample it to the 2kHz frequency at which the usermodel runs, and sharp saturations of the IOP caused big step responses on H1:ASC-AS_C_SEG4. These step responses (as we can see above) perturbe the alignment signals that are later fed back to the control signals of the last stage of SR2 and SRM mirrors.
Jeff Kissel helped me to find the filter applied in the process and simulate the step response expected due to the downsampling filter used to go from 65kHz to 2kHz, and then apply the additional filter used to generate NSUM channel with a low pass filter at 1Hz (no additional filter is applied for the Pitch and Yaw channels but notice these are normalized by NSUM):
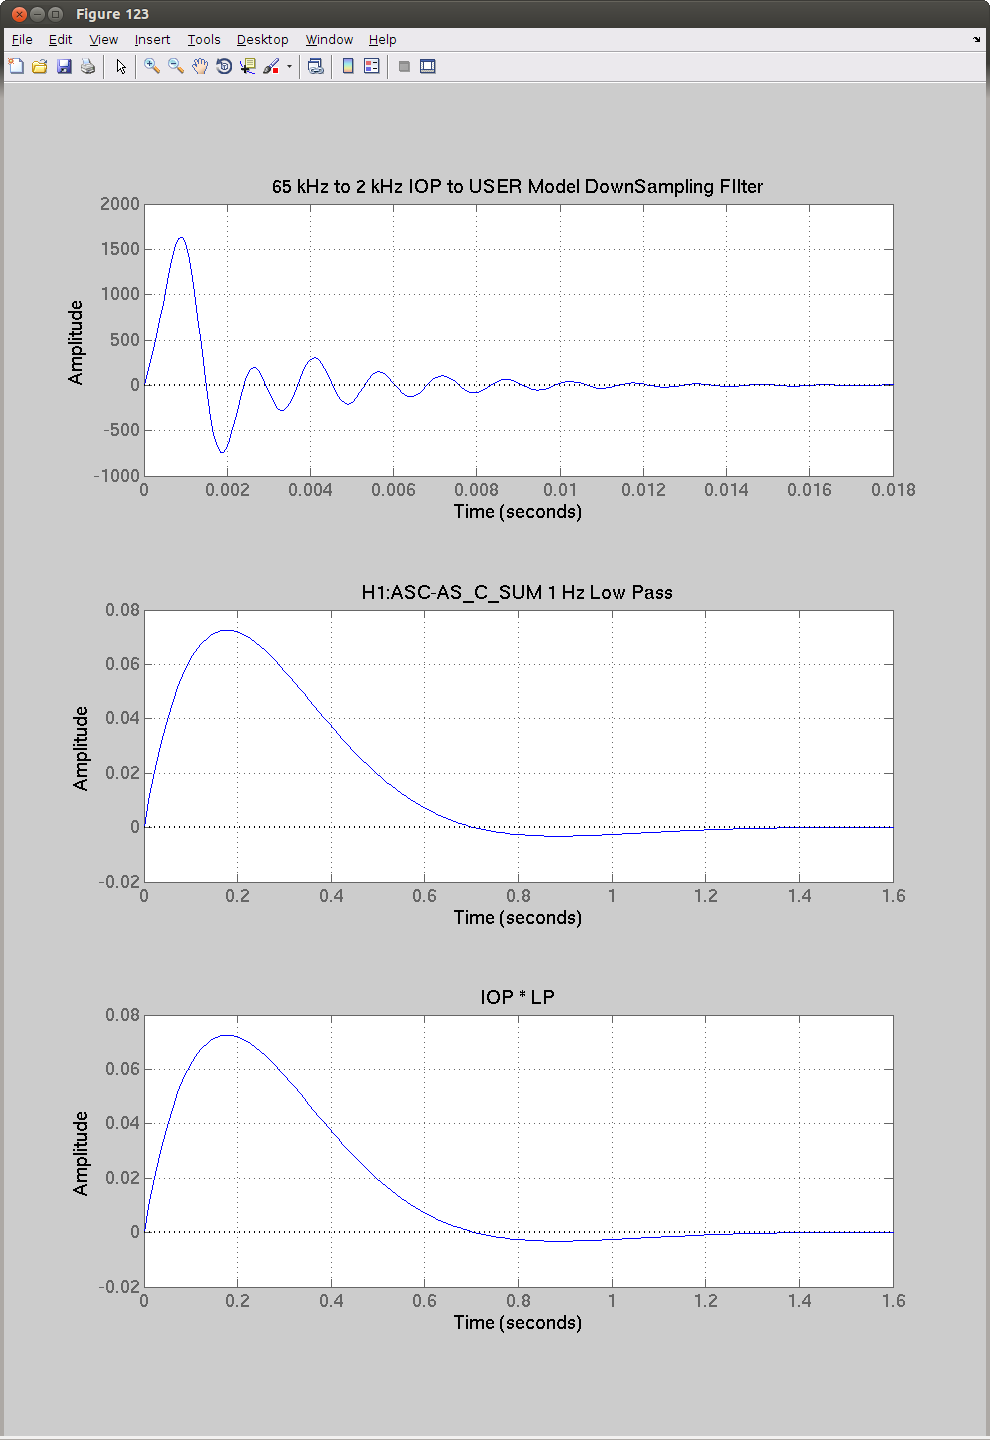
The step response time constant of less than 1 second for the product of both filters is not far from the period oscillations observed on the NSUM and YAW channels after saturation (periodicity of about 0.3 secs).
Now I add to the plot the control signals sent to the last stage of both mirrors (SRM and SR2), notice that for clarity I only plot one of the four quadrant MASTER_OUTPUT signals for each suspension:

Zooming around the lockloss shows how the step response happens immediately before the lockloss, and soon after the control signals to the SRM starts to missbehave:
For completion and in order to see how these H1:ASC-AS_C_SEG channels are used to generate alignment signals to SRM and SR2, I have attached to this aLOG the H1ASC overview screen, also H1ASC_AS_C overview and the H1ASC Inputand-Output Matrices.
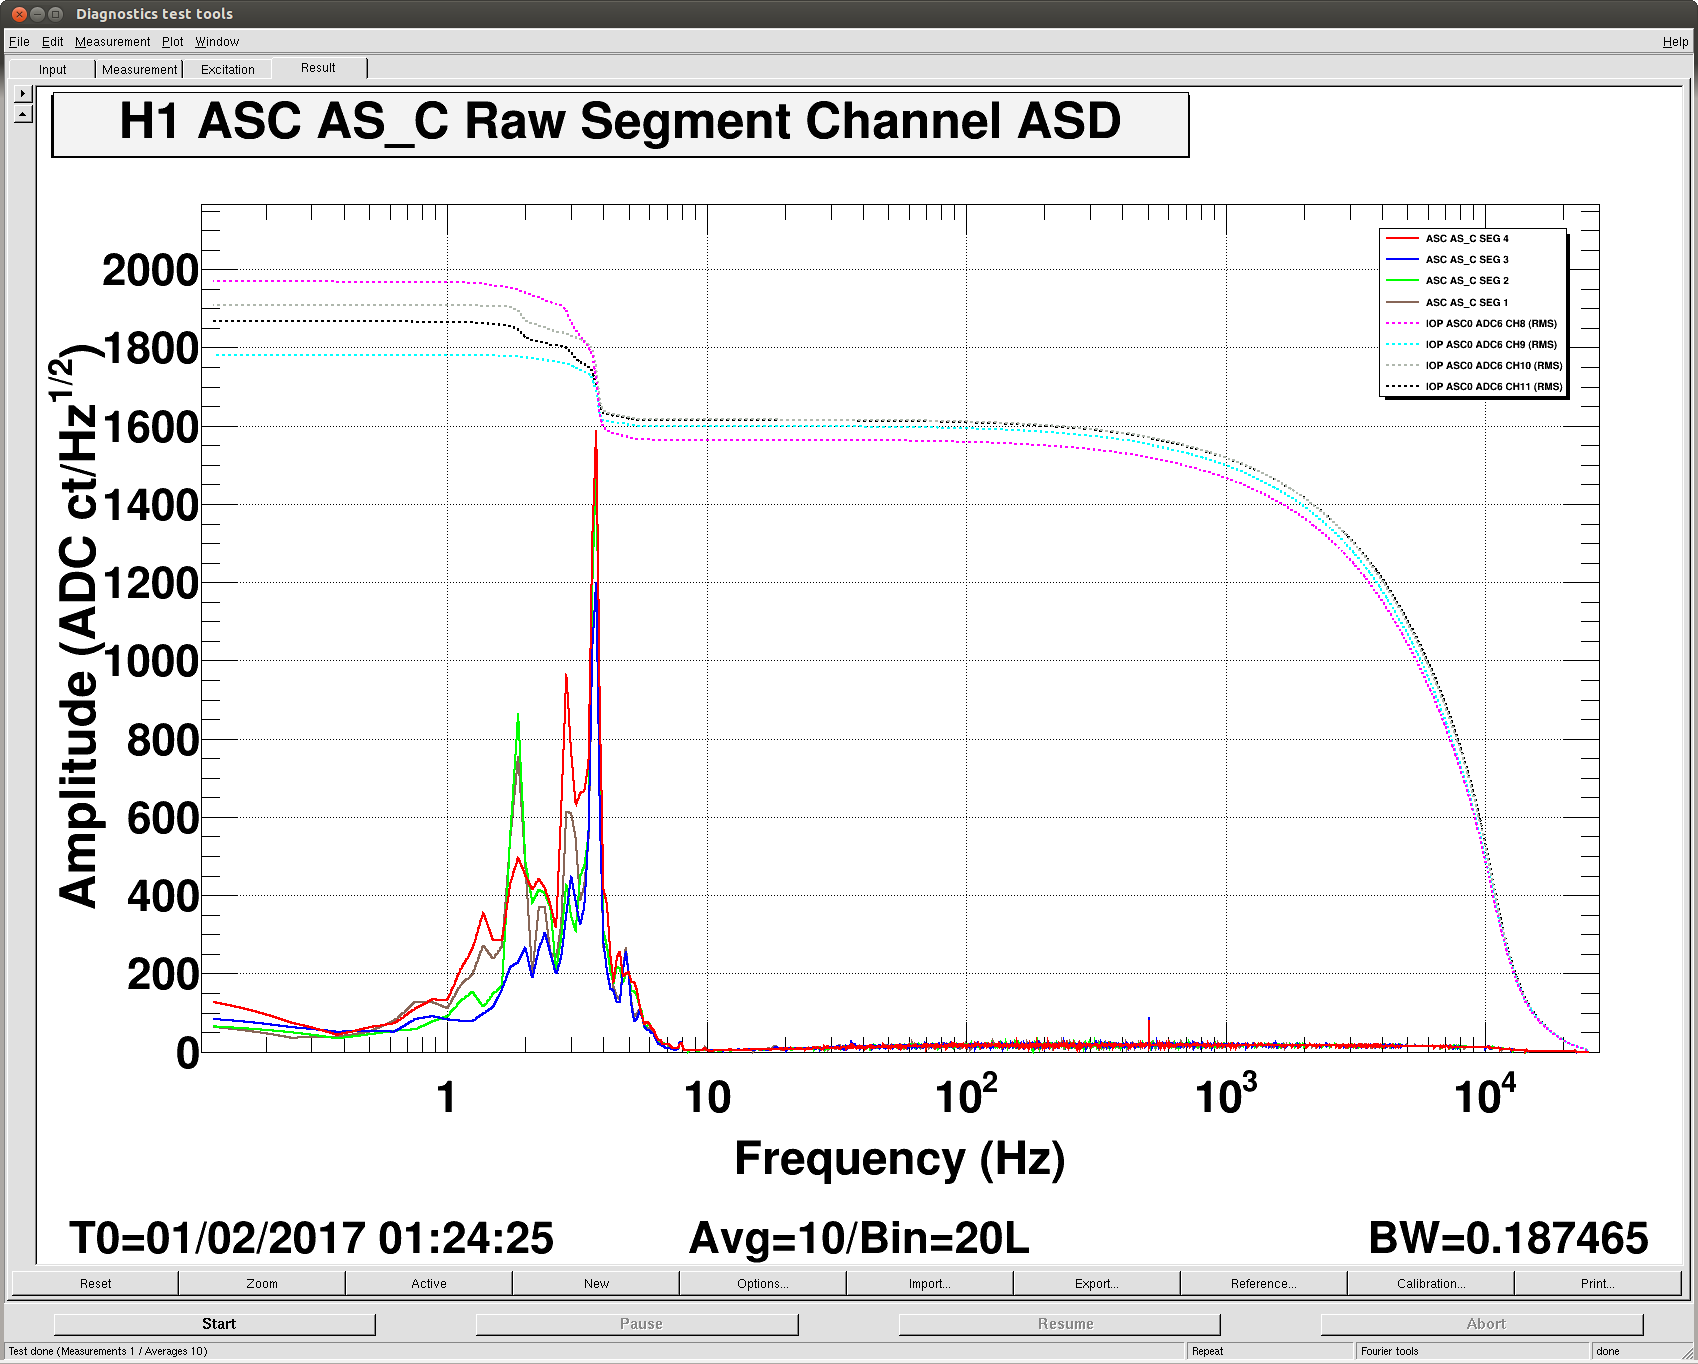
It is important to notice that saturations of these channels are not common when the detector is locked, as an example here is an ASD plot of the ASC_AS_C_SEG channels and RMS of their associated IOP channels (they are well below saturation):
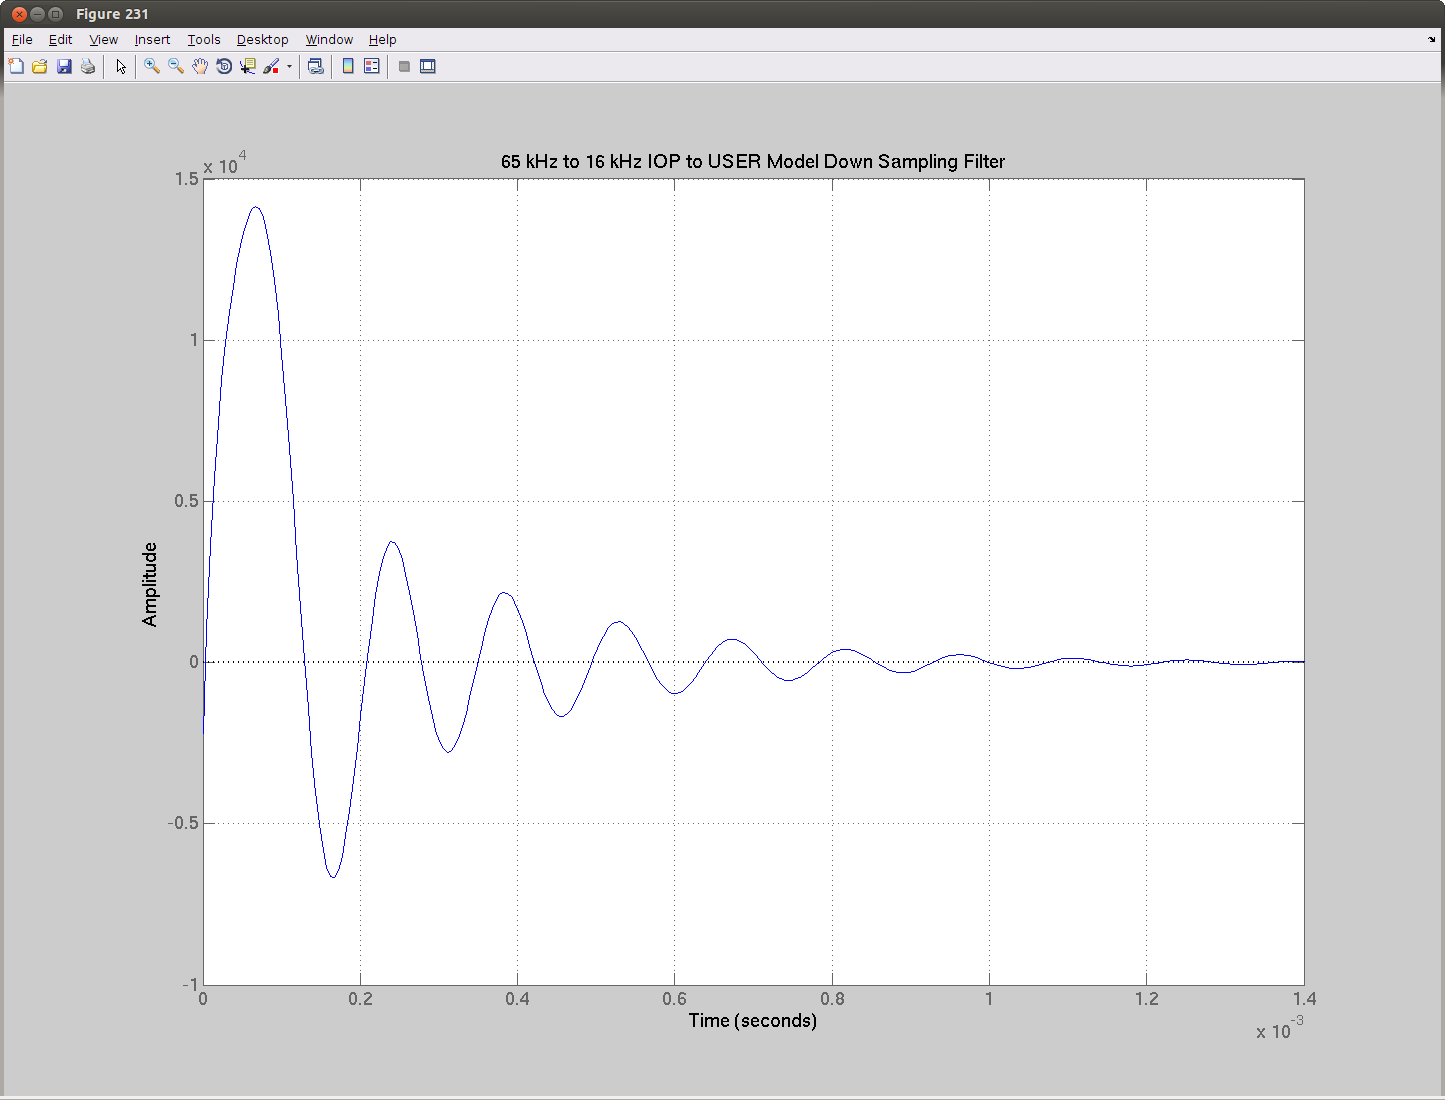
Finally, Jeff suggested to also look at the step response of the downsampling from 65kHz IOP model to 16kHz of the OMC model, with a time constant of a fracion of a milisecond, could this be related to kHz glitches?:
Probably because of temperature changes in VEAs and TCS being down earlier, I've had to add two new PI filters. The modes at 18040 (now 18037.5) and 18056 (now 18055) hz have moved down in frequency and were both ringing up and breaking the lock. First attached plot shows some detail of the bandpasses. The dashed lines are the new filters. Second plot shows the spectra of the new modes, the vertical red lines are the troublemakers, the green trace is from a lock when they were both high, red trace is live.
Except that the blue filter doesn't seem to be working... I just lost lock again.
I can't seem to do anything about the 18037.5 mode. None of the tweaks (gains, phases) do anything when the mode rings up. I've also tried sitting at DC readout for an extended period to see if that helps quiet the mode any, but I'm not having any luck.
The issue was fixed by setting the PLL set frequencies to match the new band pass filters. Did this for both MODE27 and 28. This PLL thing was buried in the "If PI seems unresponsive" section of the instruction so I broke step 3 into two parts.
Thanks; this was absolutely the right steps to take when there's large temperature/TCS changes. Apologies that the need to change PLL frequency wasn't obvious in the wiki. Thanks Nutsinee for editing that!
Also, feel free to still call me at anytime (even middle of the night), especially if PI causes more than one lockloss. My number is on the main whiteboard.
While Jason and Fil were looking at the TCSY laser, Corey had left ISC_LOCK sitting at ENGAGE_SRC_ASC. We noticed that DIAG_MAIN and the ALSX guardian were both complaining about the X-arm fiber polarization. We thought we could ignore this because the arms were no longer "on ALS", but when ISC_LOCK got to the SHUTTER_ALS state, ISC_LOCK couldn't proceed because the ALSX guardian was in fault.
To move forward, I had to take the ALSX guardian to manual and put it in the SHUTTERED state. Buuttt... now ALSX wasn't monitored by ISC_LOCK. When I got to NLN, the TCSCS was in safe (from earlier work?) and it had a bunch of differences in SDF, TCS_ITMY_CO2_PWR guardian was also complaining (where is this screen? I had to use "guardctrl medm TCS_ITMY_CO2_PWR" to launch it, it recovered after INITing), and ALSX was controlled by USER. This last one I fixed by doing a caput "caput H1:GRD-ALS_XARM_MANAGER ISC_LOCK" . Normally, that would be fixed by initing the parent node, but for ISC_LOCK that means going through down and breaking lock.
Of course, after fixing all of that and surviving an earthquake, I lost lock due to PIs that seem to have shifted because of the TCS outage.
There are more SDF diffs in TCSCS. Looks like these should probably be unmonitored.
More TCS diffs.
To clarify a few Guardian operations here; please be careful to anyone who tries to put a node back to managed by clicking the "AUTO" button, this will make USER the manager NOT the normal, correct, manager node. The way for the manager to regain control of its subordinates, is to go to INIT, as Jim states. It is true that if you select INIT from ISC_LOCK while not in Manual mode, then it will go to DOWN after completing the INIT state, but if you keep ISC_LOCK in Manual then you can wait for the INIT state to complete and then click the next state that ISC_LOCK should execute. That last part is the tricky part though. If you reselect the state that you stopped at before going to INIT, then you may run the risk of losing lock because it will rerun that state. It may not break lock, but some states will. Jim did the other way to regain control of a node by caput'ing the manager node into H1:GRD-{subordinate_node}_MANGER. This also works, but is kind of the "back door" approach (although it may be a bit more clear depending on circumstances).
As for the TCS_ITMY_CO2_PWR node, all nodes are on the Guardian Overview medm screen. All TCS is under the TCS group in the top right near the BRS nodes. Perhaps we should make sure that these are also accessable from the TCS screens.
STUDYING RF PHASE DRIFTS IN THE H1 RF SOURCE OSCILLATOR SYSTEM IN CER:
WORK PERMIT 6453  Dick Gustafson
TUES MAINT 1/25  1700 UTA(0900pst) to 2000 (1200pst)   at CER ISC Racks C# and C4.
Maintenance period access...

This  was motivated by a search for a cause of a 1/2 and 1 Hz comb of lines seen in long CW GW searches,
multiday integrations,  and having noticed apparent OSC phase drifts in the commissioning/shakedown era.
The scenario is the 1 PPS (1Hz) basic correction interval modulates the RF in random but sharp interval way.
A second 1 Hz theory was power modulation associated with the 1Hz on/off of perhaps a 100 LEDS
switching perhaps 1 amp in the OSC SOURCE power system; reprogramming, ie removing this 1 Hz variable
perhaps changed, but did not eliminate the 1/2 Hz comb effect.

Results:  so far...
We verified the 10 MHz OSC-VCO phase drifts/swings (relative to 10.000...MHz ref)  +- ~ 5 to 25 ns,
over randomly different swing periods of ~ 4 - 30 sec.
The phase swings back an forth relative to a freq tweeked reference osc signal as seen on a TEK 3032
Oscilloscope; the ref OSC triggers scope; observations are made with MK I Eyeball.

> The phase drift seems ~ constant in two drifts speeds for  +, and - directions;
  and swings... ie drifts of varying periods  ~ < 4  to ~30 sec.

The 10 MHz OSC was selected first (today) as having a freq with a convenient reference stable
tunable oscillator units available: << .1 ns sec drift:
a "tuneable" SRS SC-10 very stable 10.000000 MHz VCO;   and an SRS FS725 Rb87 Rubidium frequency
standard ("atomic clock ") 10.000 MHz.  This provides a stabilized 10.00000000000 MHz reference
very slowly tunable over very limited range.  Used here first to verify the stability and
tunability of the ref oscillators and learn subtleties.

PLAN:  We hope to devise a practical scheme to test all or most of the OSCILLATORS in the LHO CER...
       are they the "same"?  or  what?
       ..next maintenance or opportunity....to come up with a plausible Drift model
       and understand consequences.
I have started Conlog running on conlog-master and conlog-replica. conlog-3.0.0 is running on conlog-master. conlog-flask-3.2.0 is running on conlog-replica. There are 6,653 unmonitored channels (attached). Some of these I can connect to from a CDS workstation, but not from conlog-master. I'm not certain why yet.
I had to set the following environment variables:

EPICS_CA_AUTO_ADDR_LIST=NO
EPICS_CA_ADDR_LIST=10.101.0.255 10.106.0.255 10.105.0.255 10.20.0.255 10.22.15.255

I did this in the systemd config file at /lib/systemd/system/conlog.service:

[Unit]
Description=Conlog daemon
After=mysql.service

[Service]
Type=simple
Environment="EPICS_CA_AUTO_ADDR_LIST=NO"
Environment="EPICS_CA_ADDR_LIST=10.101.0.255 10.106.0.255 10.105.0.255 10.20.0.255 10.22.15.255"
ExecStart=/usr/sbin/conlogd

[Install]
WantedBy=multi-user.target

There are now 1992 unmonitored channels (attached), but it appears that these are channels that no longer exist.
While heading to NLN, the TCSy laser tripped again. Fil & Jason are working on this now (& Guardian is paused).
J. Oberling, F. Clara
Fil removed the comparator box and ran some quick tests in the EE lab; he found nothing obviously wrong with it. The box was reinstalled without issue. Using a multimeter, Fil measured the input signal from the IR sensor. The interesting thing here is that the input signal changed depending on how the box was positioned (trip point is at ~96mV). Hanging free in mid-air the input signal measured ~56mV; with Fil touching the box, still hanging free, the signal dropped to ~36mV; holding the box on the side of the TCS enclosure the signal changed yet again to ~25mV; and finally, placing the box on top of the TCS enclosure (its usual home), the signal dropped yet again to ~15mV. There is definitely something fishy going on with this comparator box; grounding issue or cable/connection problem maybe?
As a final check I opened the side panel to the TCS enclosure to check the viewport to ensure there were no obvious signs of damage. Using a green flashlight I found no obvious signs of damage on either optic in the TCS viewport; in addition, nothing obviously looked amiss with the viewport itself, so for know now this seems to be an issue with either the comparator box or the IR sensor. Seeing as how it appears to be working again (famous last words, I know...) we restarted the TCSy CO2 laser. Everything came up without issue, we will continue to monitor this.
Wondering if this is related to the glitchy sigals from the TCSY laser controller. They all run through that same controller box (though of course we did try swapping that out). The lifting it up / putting it down, sounds like it could be a weird grounding issue.
Give me a call if you need any help on this tonight - I'll email my number to you.
Here are a couple pictures for informational purposes. The first is the TCS laser controller chassis, and shows which light is lit when the IR sensor is in alarm. The second shows the comparator box in alarm. This box sits on top of the TCSy enclosure, on the north-east corner.
PyCBC analysts, Thomas Dent, Andrew Lundgren
Investigation of some unusual and loud CBC triggers led to identifying a new set of glitches which occur a few times a day, looking like one or two cycles of extremely high-frequency scattering arches in the strain channel. One very clear example is this omega scan (26th Jan) - see particularly LSC-REFL_A_LF_OUT_DQ and IMC-IM4_TRANS_YAW spectrograms for the scattering structure. (Hence the possible name SPINOSAURUS, for which try Googling.)
The cause is a really strong transient excitation at around 30Hz (aka 'thud') hitting the central station, seen in many accelerometer, seismometer, HEPI, ISI and SUS channels. We made some sound files from a selection of these channels :
PEM microphones, interestingly, don't pick up the disturbance in most cases - so probably it is coming through the ground.
Note that the OPLEV accelerometer shows ringing at ~60-something Hz.
Working hypothesis is that the thud is exciting some resonance/relative motion of the input optics which is causing light to be reflected off places where it shouldn't be ..
The frequency of the arches (~34 per second) would indicate that whatever is causing scattering has a motion frequency of about 17Hz (see eg https://ldvw.ligo.caltech.edu/ldvw/view?act=getImg&imgId=154054 as well as the omega scan above).
Maybe someone at the site could recognize what this is from listening to the .wav files?
A set of omega scans of similar events on 26th Jan (identified by thresholding on ISI-GND_STS_HAM2_Y) can be found at https://ldas-jobs.ligo-wa.caltech.edu/~tdent/wdq/isi_ham2/
Wow that is pretty loud, seems like it is even seen (though just barely) on seismometers clear out at EY with about the right propagation delay for air or ground propagation in this band (about 300 m/s). Like a small quake near the corner station or something really heavy, like the front loader, going over a big bump or setting its shovel down hard. Are other similar events during working hours and also seen at EY or EX?
It's hard to spot any pattern in the GPS times. As far as I have checked the disturbances are always much stronger in CS/LVEA than in end station (if seen at all in EX/EY ..).
More times can be found at https://ldas-jobs.ligo-wa.caltech.edu/~tdent/wdq/isi_ham2/jan23/ https://ldas-jobs.ligo-wa.caltech.edu/~tdent/wdq/isi_ham2/jan24/
Hveto investigations have uncovered a bunch more times - some are definitely not in working hours, eg https://ldas-jobs.ligo-wa.caltech.edu/~tjmassin/hveto/O2Ac-HPI-HAM2/scans/1169549195.98/ (02:46 local) https://ldas-jobs.ligo-wa.caltech.edu/~tjmassin/hveto/O2Ab-HPI-HAM2/scans/1168330222.84/ (00:10 local)
Here's a plot which may be helpful as to the times of disturbances in CS showing the great majority of occurrences on the 23rd, 26th-27th and early on 28th Jan (all times UTC). This ought to be correlated with local happenings.
The ISI-GND HAM2 channel also has loud triggers at times where there are no strain triggers as the ifo was not observing. The main times I see are approximately (UTC time)
Jan 22 : hours 13, 18 21-22
Jan 23 : hours 0-1, 20
Jan 24 : hours 0, 1, 3-6, 10, 18-23
Jan 25 : hours 21-22
Jan 26 : hours 17-19, 21-22
Jan 27 : hours 1-3, 5-6, 10, 15-17, 19, 21, 23
Jan 28 : hours 9-10
Jan 29 : hours 19-20
Jan 30 : hours 17, 19-20
Hmm. Maybe this shows a predominance of times around hour 19-20-21 UTC i.e. 11-12-13 PST. Lunchtime?? And what was special about the 24th and 27th ..
Is this maybe snow falling off the buildings? The temps started going above the teens on the 18th or so and started staying near freezing by the 24th. Fil reported seeing a chunk he thought could be ~200 lbs fall.
Ice Cracking On Roofs?
In addition to ice/snow falls mentioned by Jim, thought I'd mention audible bumps I heard from the Control Room during some snowy evenings a few weeks ago (alog33199)....Beverly Berger emailed me suggesting this could be ice cracking on the roof. We currently do not have tons of snow on the roofs, but there are some drifts which might be on the order of a 1' tall.
MSR Door Slams?
After hearing the audio files from Thomas' alog, I was sensitive to the noise this morning. Because of this, thought I'd note some times this morning when I heard a noise similar to Thomas' audio, and this noise was the door slamming when people were entering the MSR (Mass Storage Room adjacent to the Control Room & there were a pile of boxes which the door would hit when opened...I have since slid them out of the way). Realize this isn't as big of a force as what Robert mentions or the snow falls, but just thought I'd note some times when they were in/out of the room this morning:
I took a brief look at the times in Corey's previous 'bumps in the night' report, I think I managed to deduce correctly that it refers to UTC times on Jan 13. Out of these I could only find glitches corresponding to the times 5:32:50 and 6:09:14. There were also some loud triggers in the ISI-GND HAM2 channel on Jan 13, but only one corresponded in time with Corey's bumps: 1168320724 (05:31:46).
The 6:09 glitch seems to be a false alarm, a very loud blip glitch at 06:09:10 (see https://ldas-jobs.ligo-wa.caltech.edu/~tdent/wdq/H1_1168322968/) with very little visible in aux channels. The glitch would be visible on the control room glitchgram and/or range plot but is not associated with PEM-CS_SEIS or ISI-GND HAM2 disturbances.
The 5:32:50 glitch was identified as a 'PSL glitch' some time ago - however, it also appears to be a spinosaurus! So, a loud enough spinosaurus will also appear in the PSL.
Evidence : Very loud in PEM-CS_SEIS_LVEA_VERTEX channels (https://ldvw.ligo.caltech.edu/ldvw/view?act=getImg&imgId=155306) and characteristic sail shape in IMC-IM4 (https://ldvw.ligo.caltech.edu/ldvw/view?act=getImg&imgId=155301).
The DetChar SEI/Ground BLRMS Y summary page tab has a good witness channel, see the 'HAM2' trace in this plot for the 13th - ie if you want to know 'was it a spinosaurus' check for a spike in HAM2.
Here is another weird-audio-band-disturbance-in-CS event (or series of events!) from Jan 24th ~17:00 UTC :
https://ldas-jobs.ligo-wa.caltech.edu/~tdent/detchar/o2/PEM-CS_ACC_LVEAFLOOR_HAM1_Z-1169312457.wav
Could be someone walking up to a piece of the instrument, dropping or shifting some heavy object then going away .. ??
Omega scan: https://ldas-jobs.ligo-wa.caltech.edu/~tdent/wdq/psl_iss/1169312457.3/
The time mentioned in the last entry turns out to have been a scheduled Tuesday maintenance where people were indeed in the LVEA doing work (and the ifo was not observing, though locked).
Thanks Jim, and sorry for the not-obvious PLL thing in the wiki.
As far as setting the PLL frequency, within a Hz should be close enough.
I'm sure you did see the PLL lock light going green before: it could've been locking on some other smaller peak and then unlocking and relocking, or once your PI rings up huge enough the PLL could've locked on the right peak, but by then it was too big to damp.