Krishna, Jeff
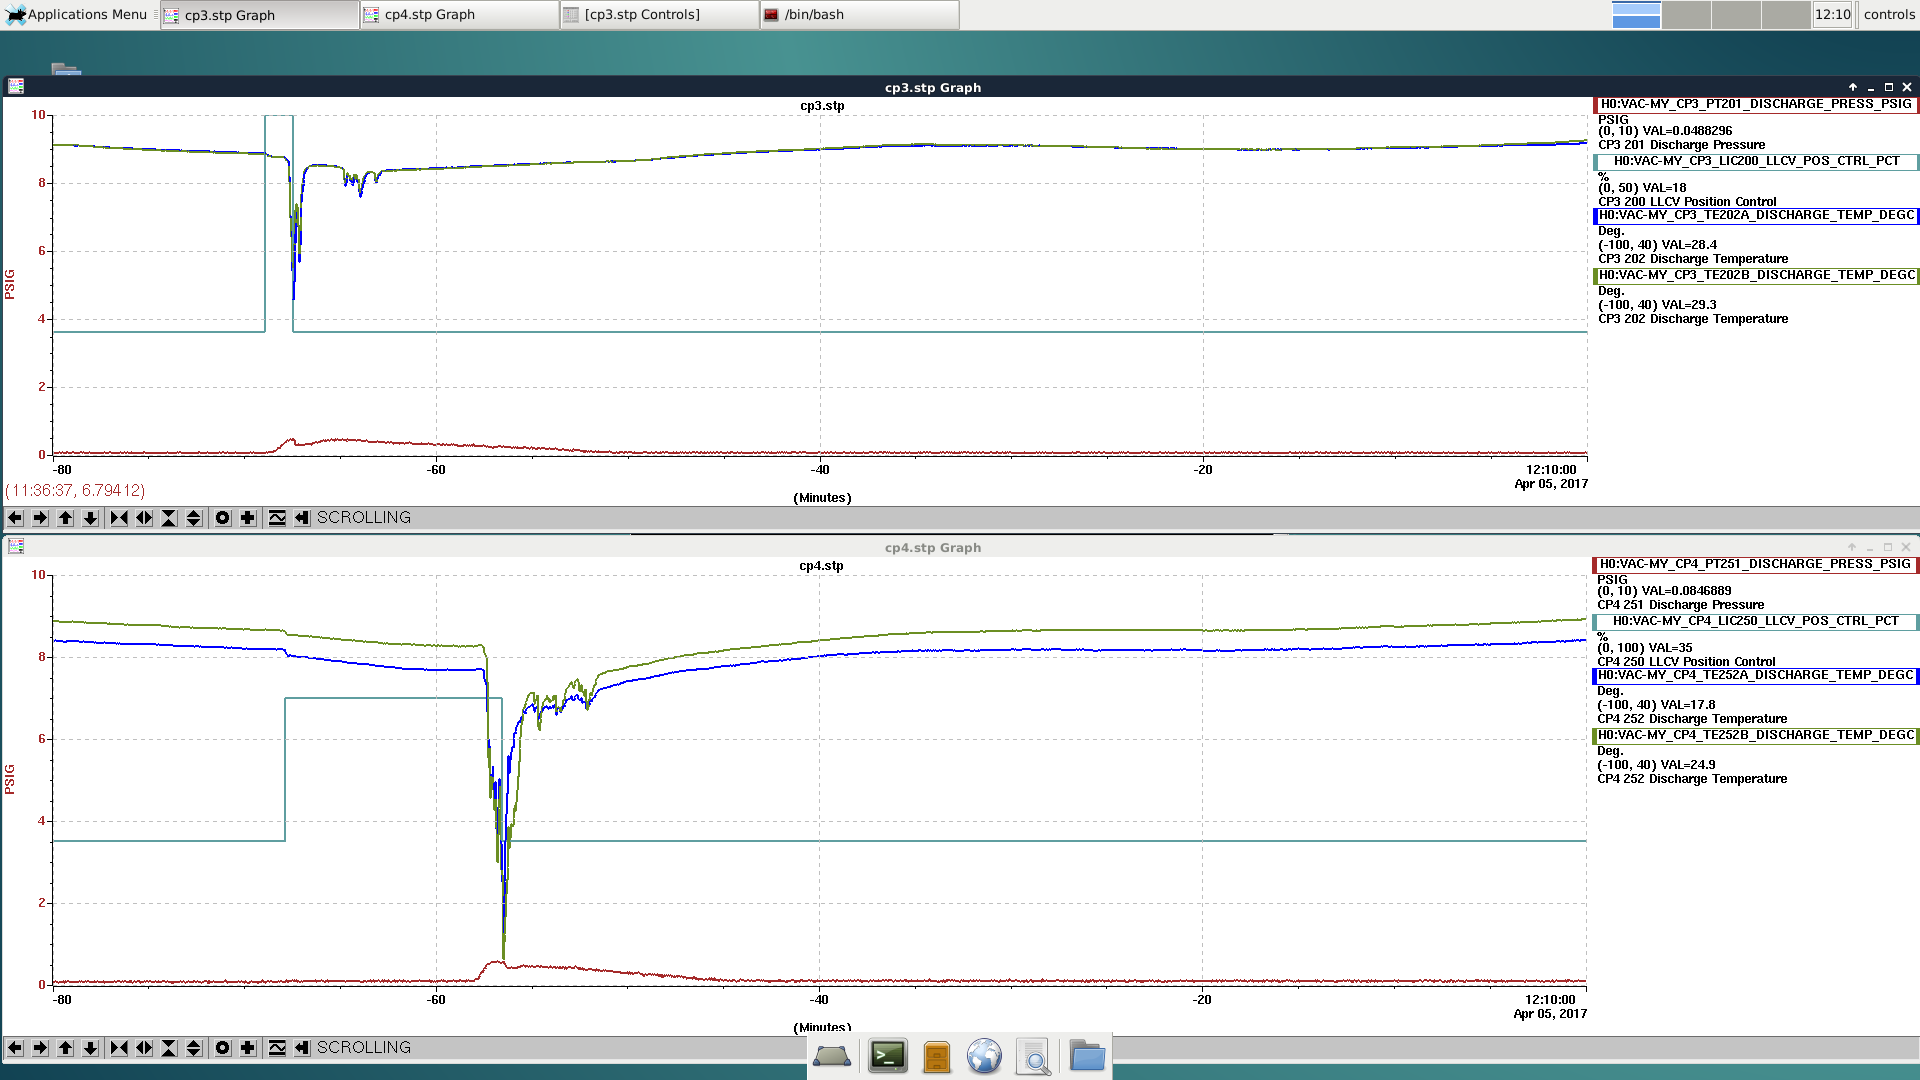
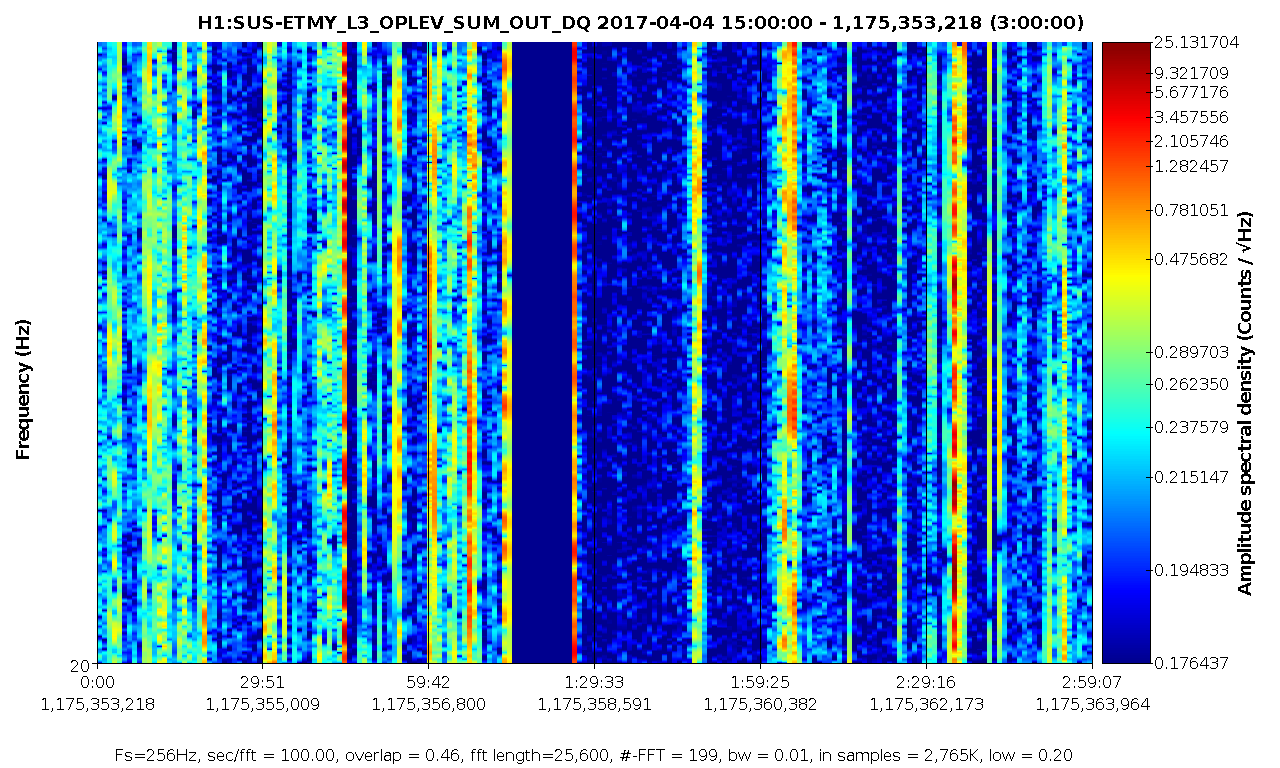
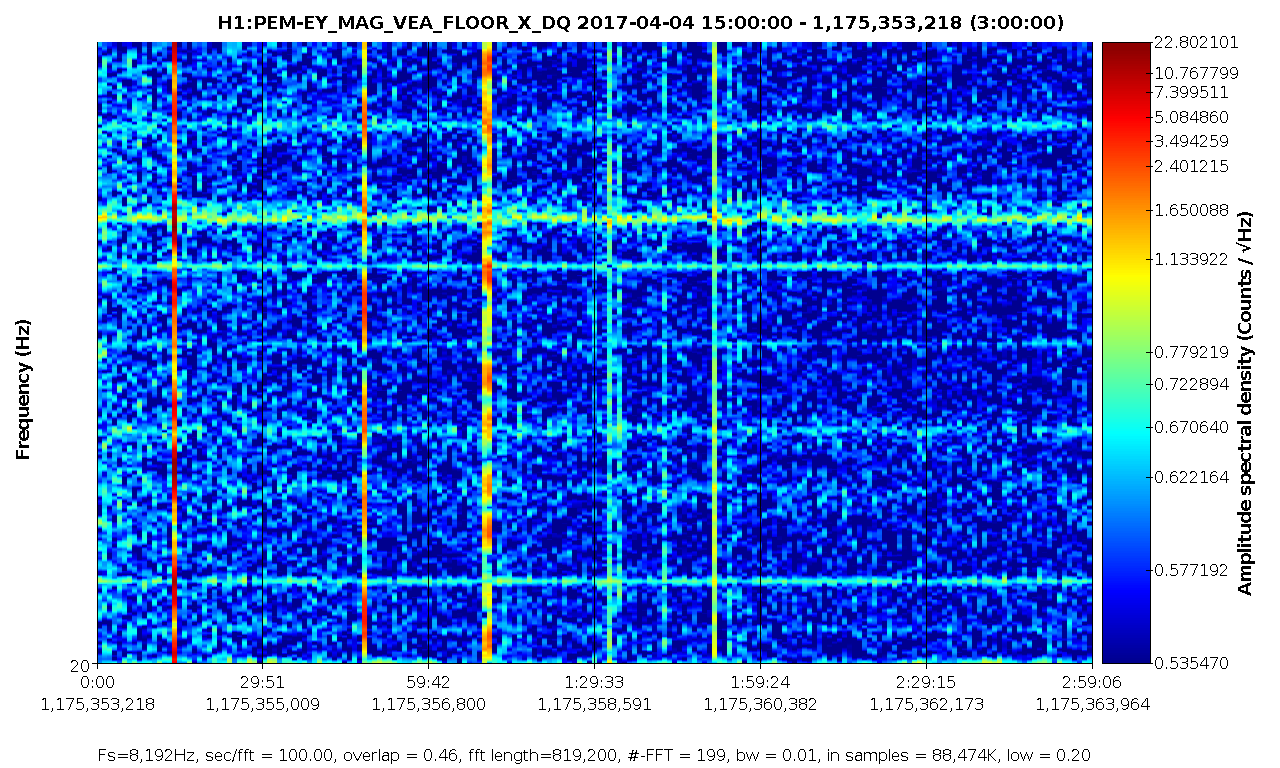
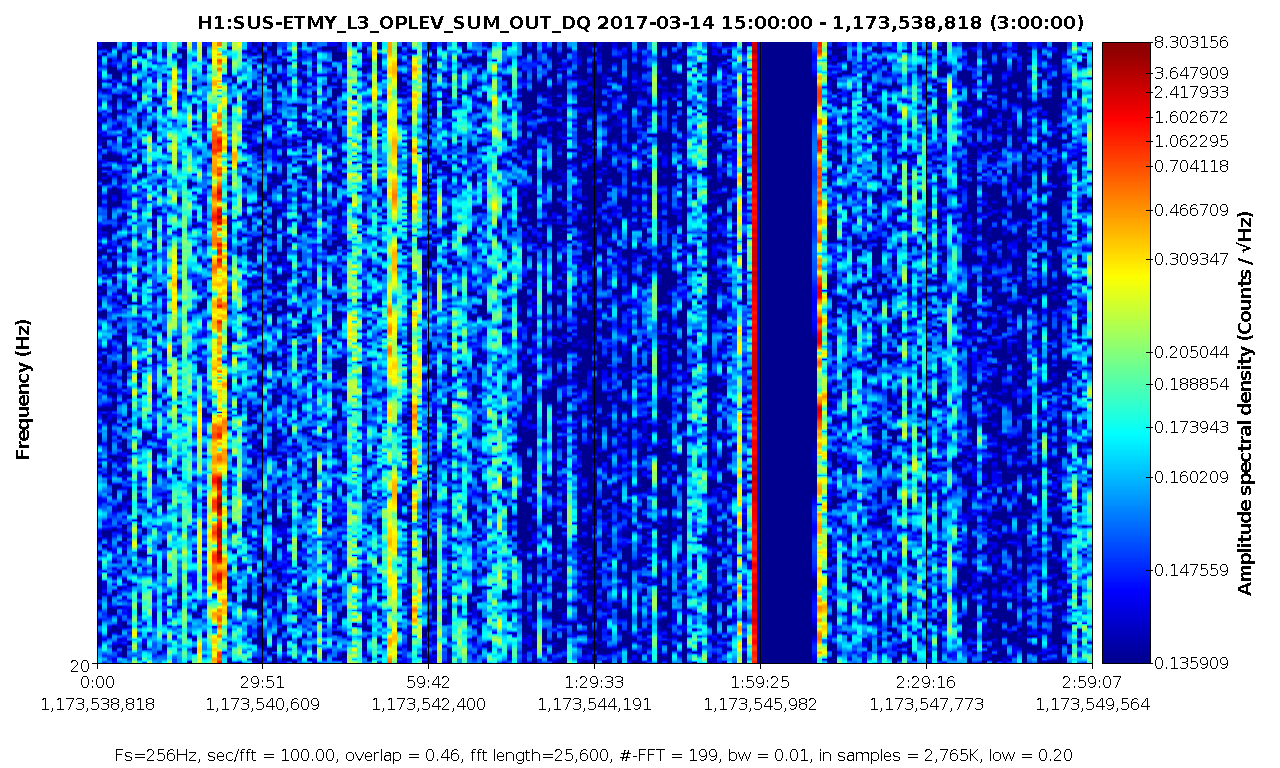
There are several recent cases of sudden range drops, coincident with increased quad motion, oplev noise, CAL line upconversion, OMC dither heights and angular motion etc. See Jeff's log for some details and also 34999. It happened again last night on 2017-04-05 from ~05:30 UTC to 06:40 before the earthquake knocked us out. DetChar has suspected ITMY Oplev.
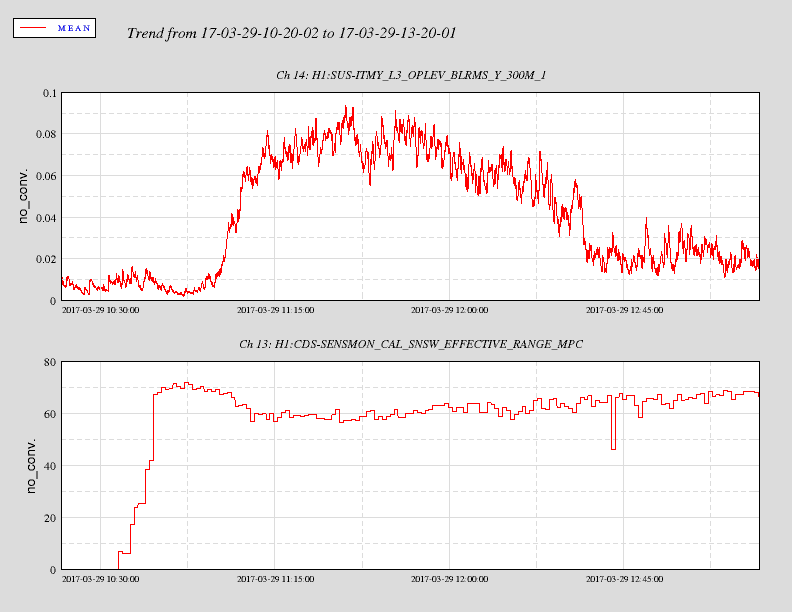
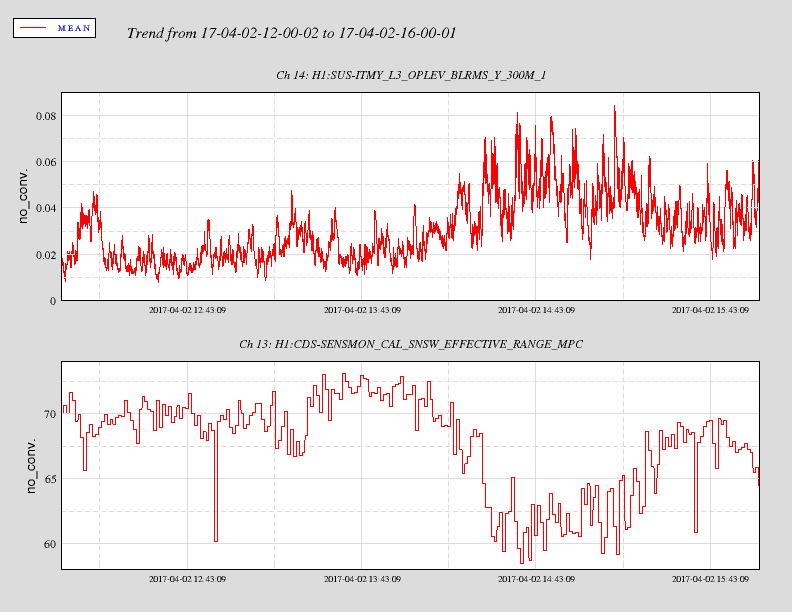
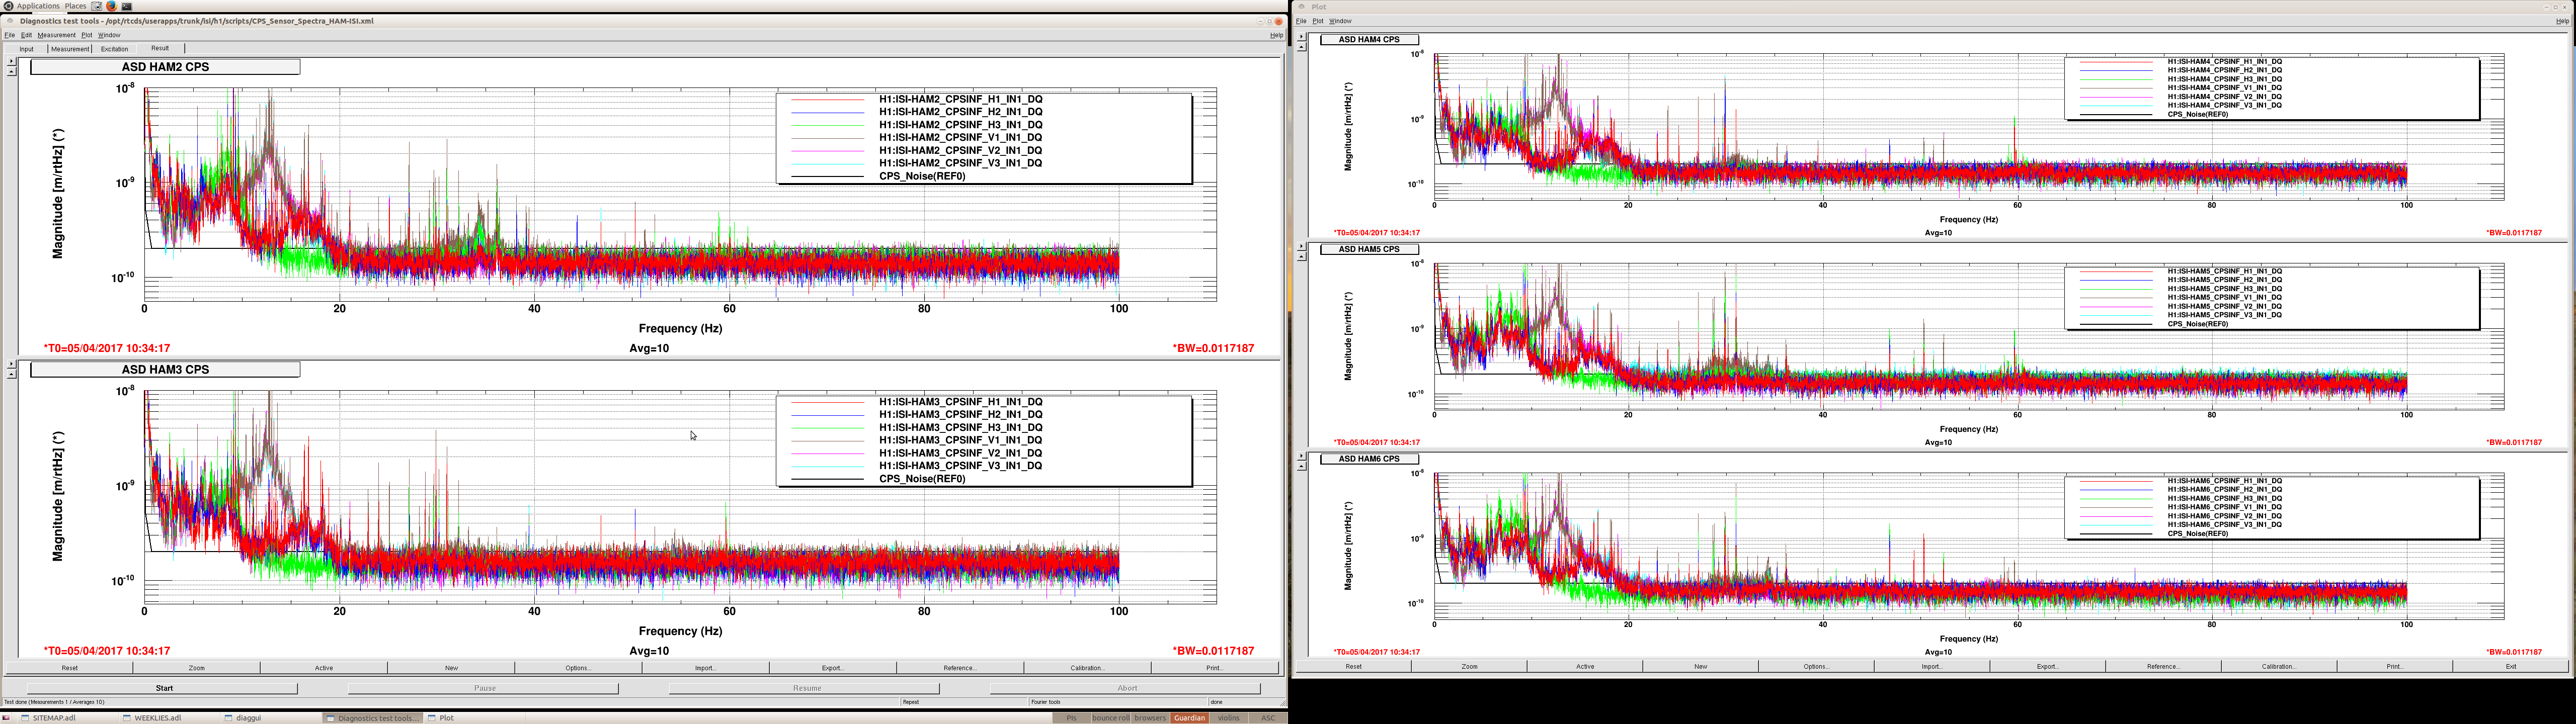
As seen from the previous alogs, it is difficult to follow the causal chain, but I suspect OMC is unlikely to be the problem since it can't influence the QUAD motion which clearly goes up each time. All the QUADs show similar PITCH motion, so it is not clear which was the cause. So far, a smoking gun for the problem seems to be ITMY Oplev YAW 0.3Hz to 1Hz blrms: crossing a threshold of ~0.04 (microrad?) seems to trigger a range drop. Remember that oplevs are used only to damp PITCH motion of the quads but they are independent witnesses in YAW.
I have attached four cases where the ITMY Oplev - YAW sees an increase in the 0.3 to 1 Hz blrms correlated with range drop: April 5, April 2, March 29, March 22. A quick look at the summary pages shows that this increase is only associated with ITMY - Oplev YAW. There are more cases but this is sufficient I think.
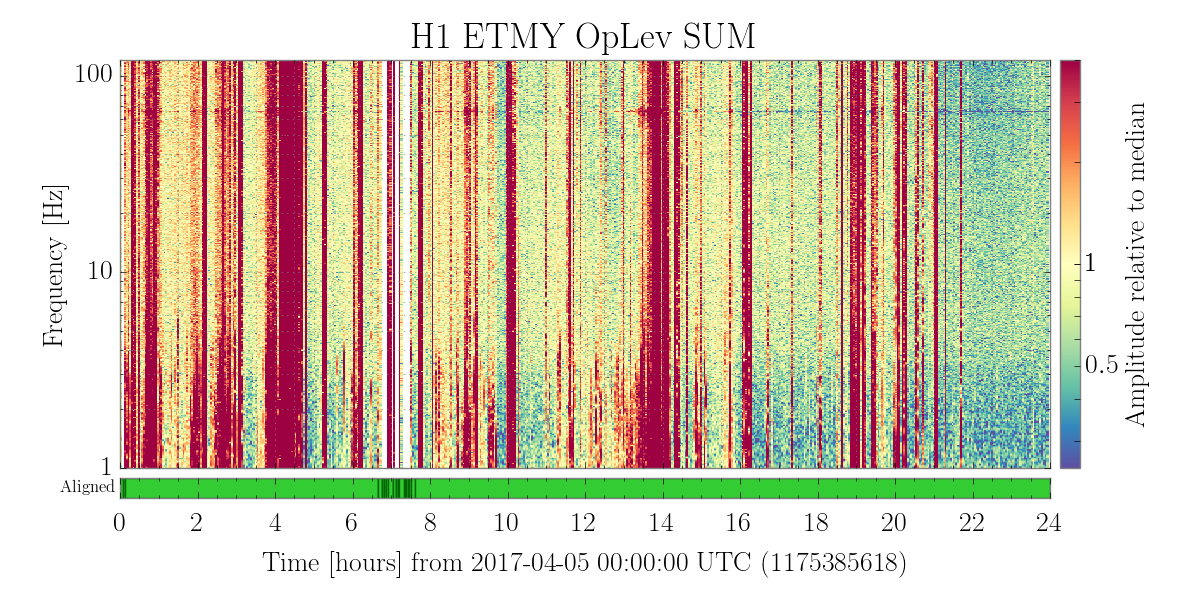
It is interesting that even though other Oplevs (such as ETMY) glitch more, it looks like only ITMY-Oplev shows broad low-frequency increase in apparent angular motion.
Edit: For clarification, I think ITMY Oplev sees an apparent increase in PITCH and YAW during these times. Since we use it for damping in PITCH, all QUADS start pitching more affecting DARM. ITMY Oplev may need to be tuned/fixed. The other less likely possibility is that ITMY is rubbing occasionally.