david.barker@LIGO.ORG - posted 10:30, Thursday 26 June 2025 (85359)
Thu CP1 Fill
Thu Jun 26 10:13:36 2025 INFO: Fill completed in 13min 32secs
Images attached to this report
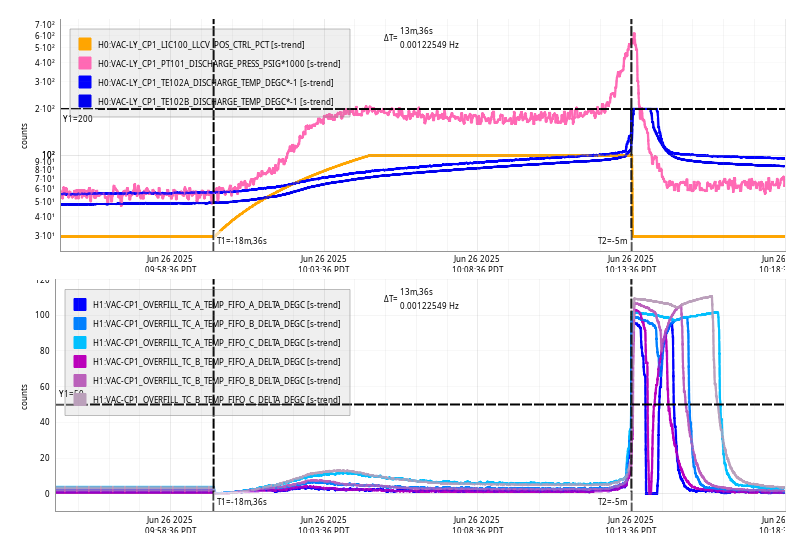
Thu Jun 26 10:13:36 2025 INFO: Fill completed in 13min 32secs
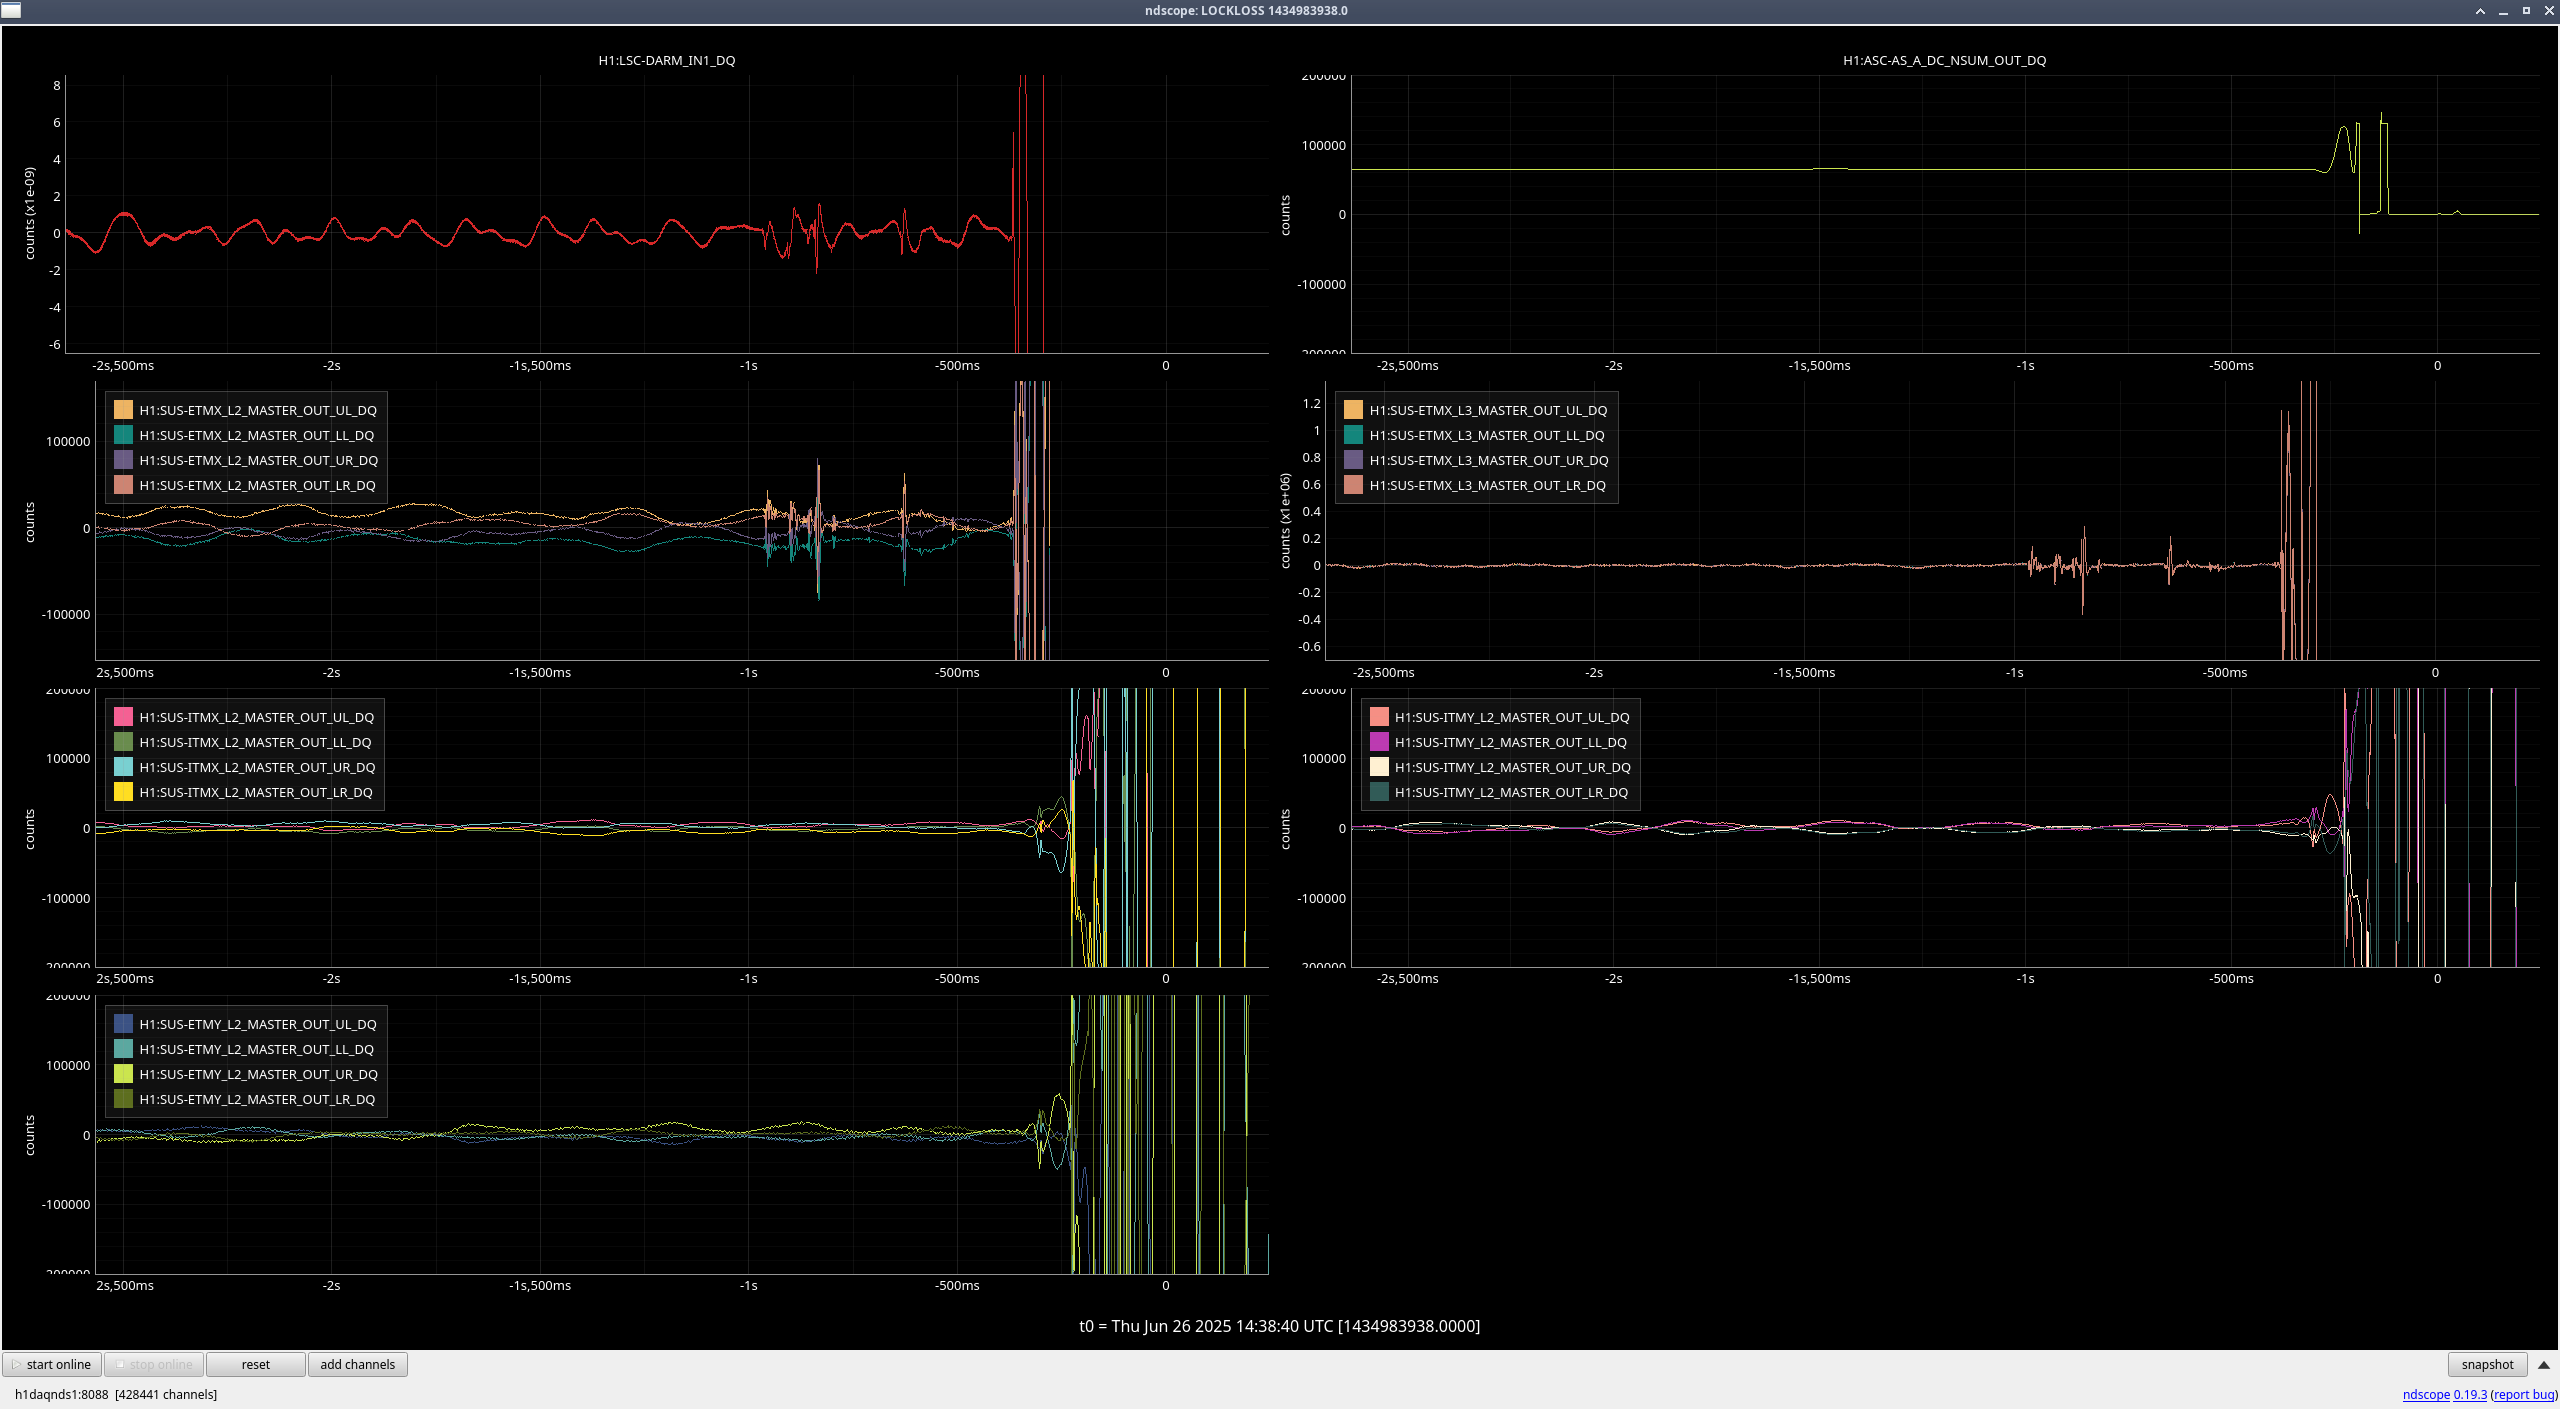
Lockloss at 2025-06-26 14:38 UTC after 7.5 hours locked due to an ETMX glitch
15:40 UTC Back to Nominal Low Noise
TITLE: 06/26 Day Shift: 1430-2330 UTC (0730-1630 PST), all times posted in UTC
STATE of H1: Observing at 149Mpc
OUTGOING OPERATOR: TJ
CURRENT ENVIRONMENT:
SEI_ENV state: CALM
Wind: 5mph Gusts, 2mph 3min avg
Primary useism: 0.01 μm/s
Secondary useism: 0.05 μm/s
QUICK SUMMARY:
Observing at 150Mpc and have been Locked for 7.5 hours. Commissioning again today from 15:00 - 21:00 UTC.
TITLE: 06/26 Eve Shift: 2330-0500 UTC (1630-2200 PST), all times posted in UTC
STATE of H1: Lock Acquisition
INCOMING OPERATOR: TJ
SHIFT SUMMARY:
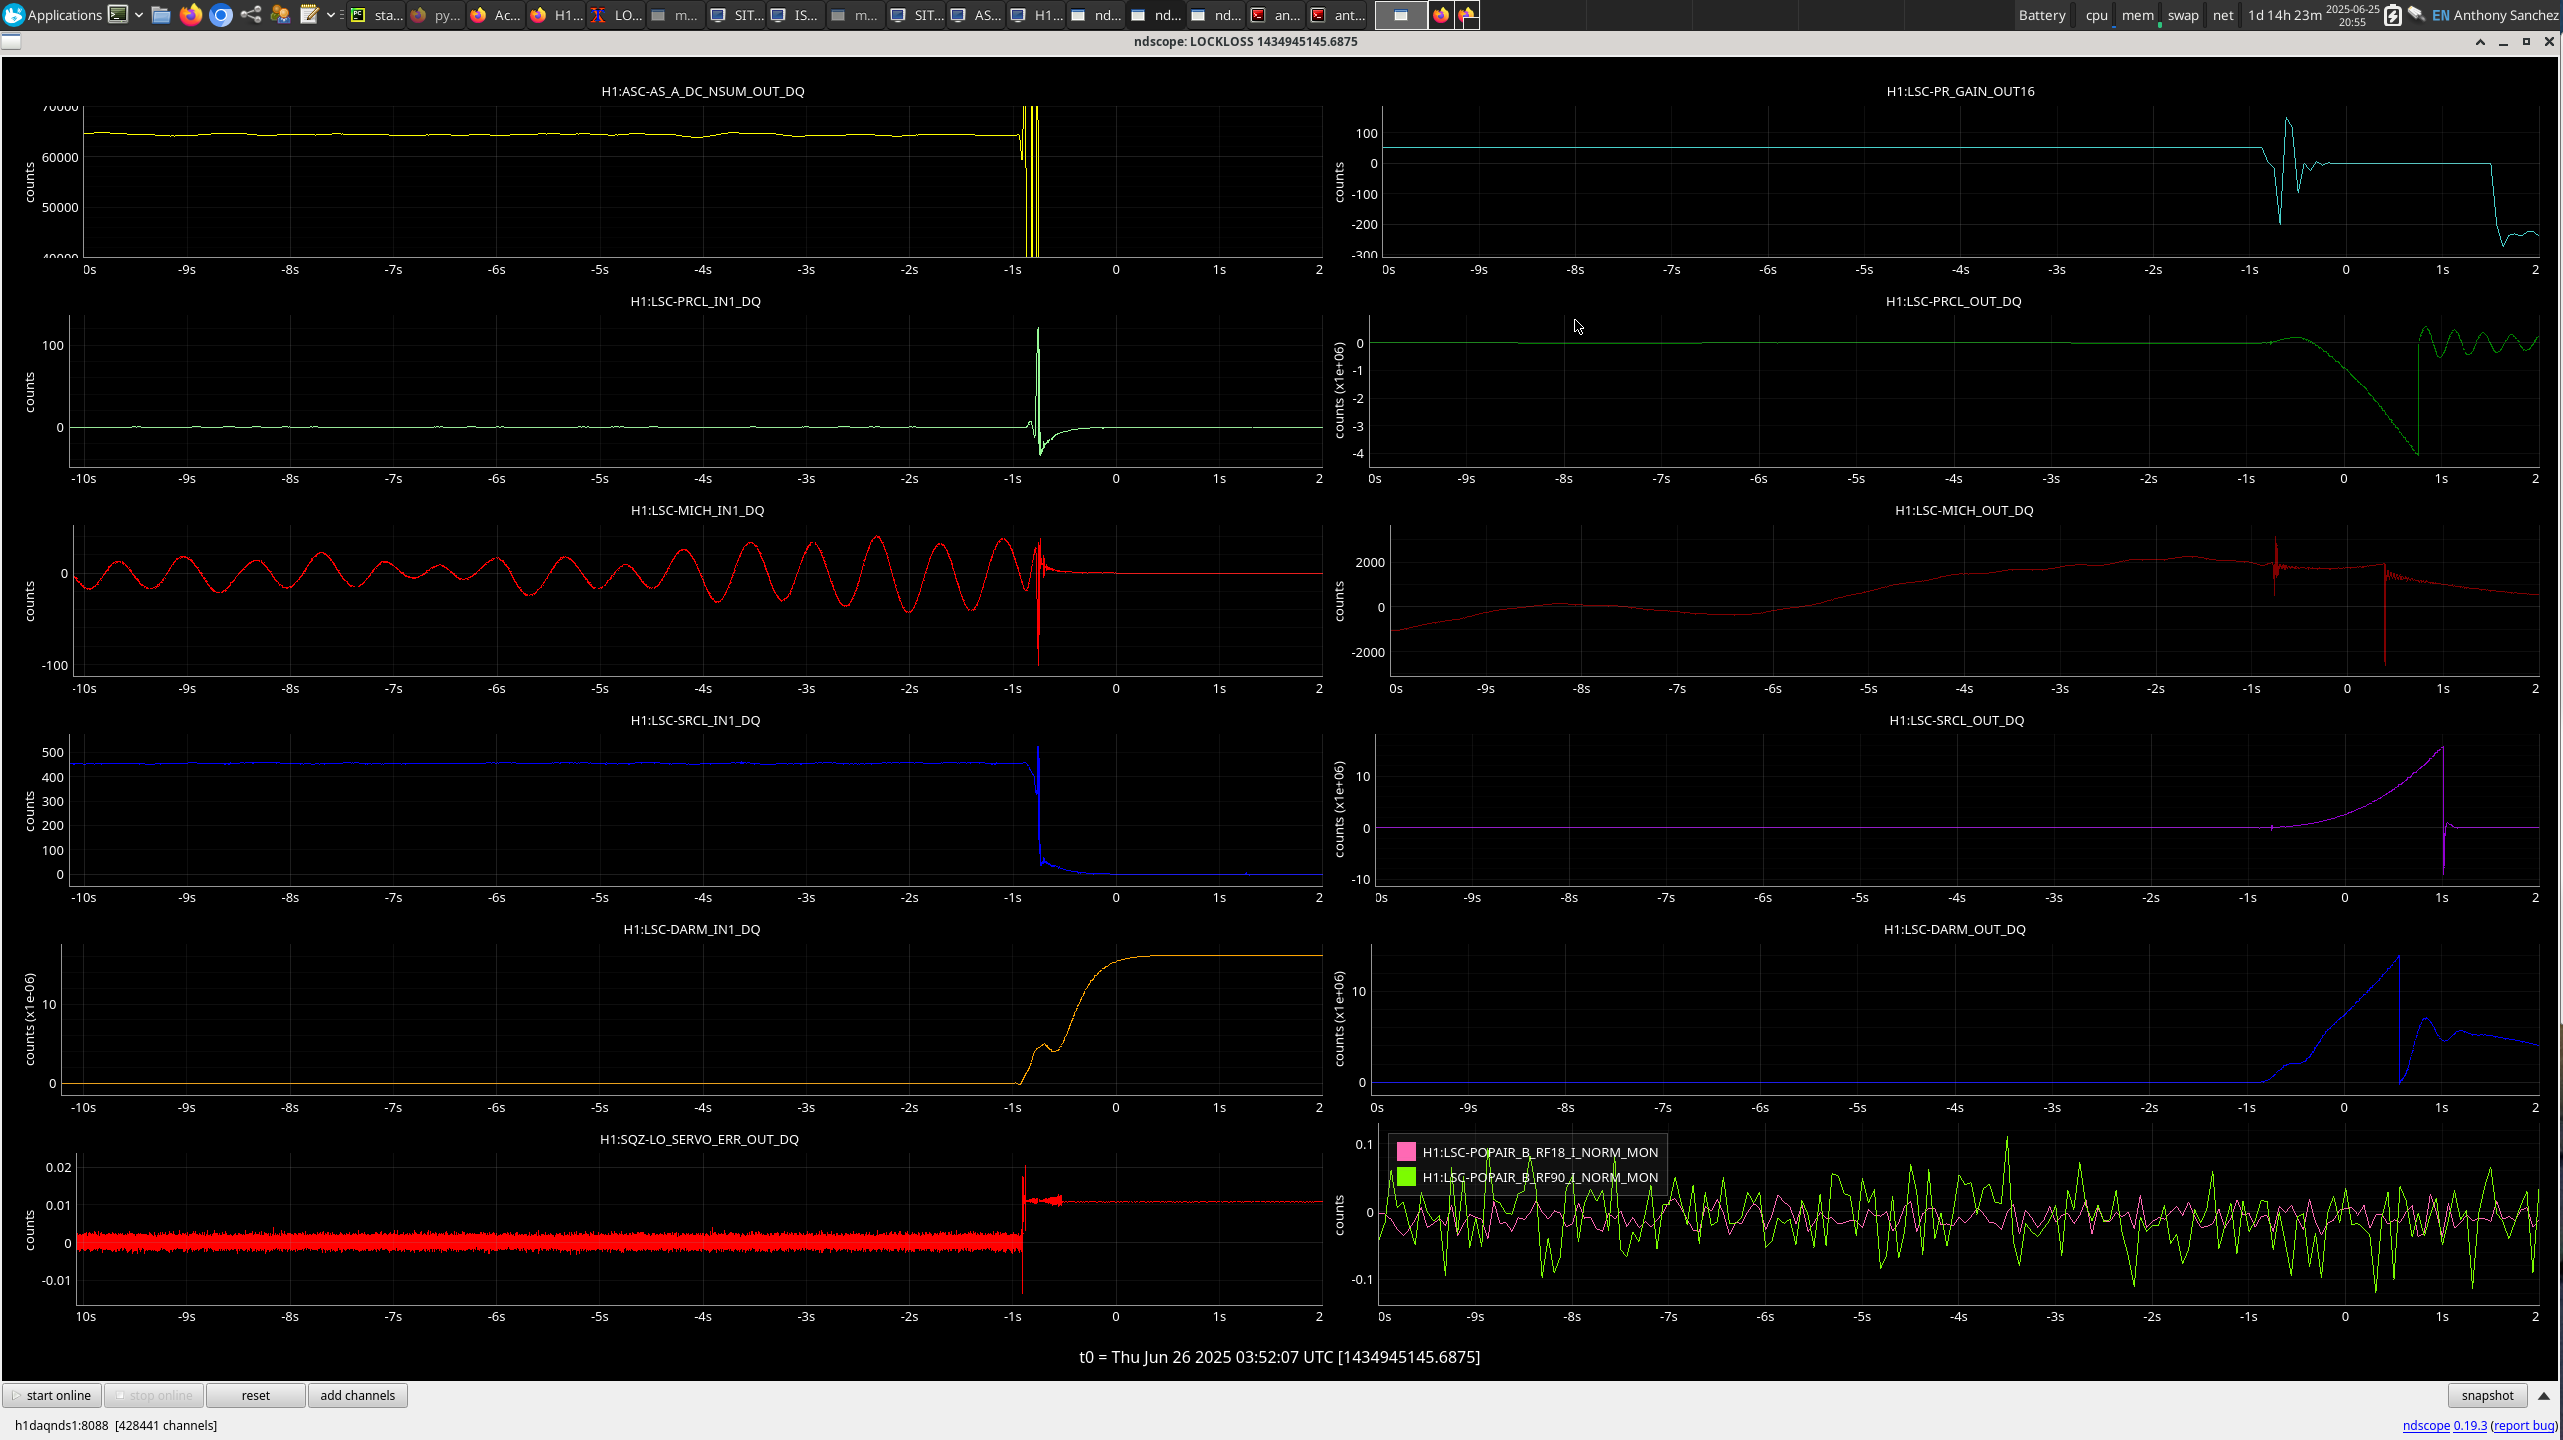
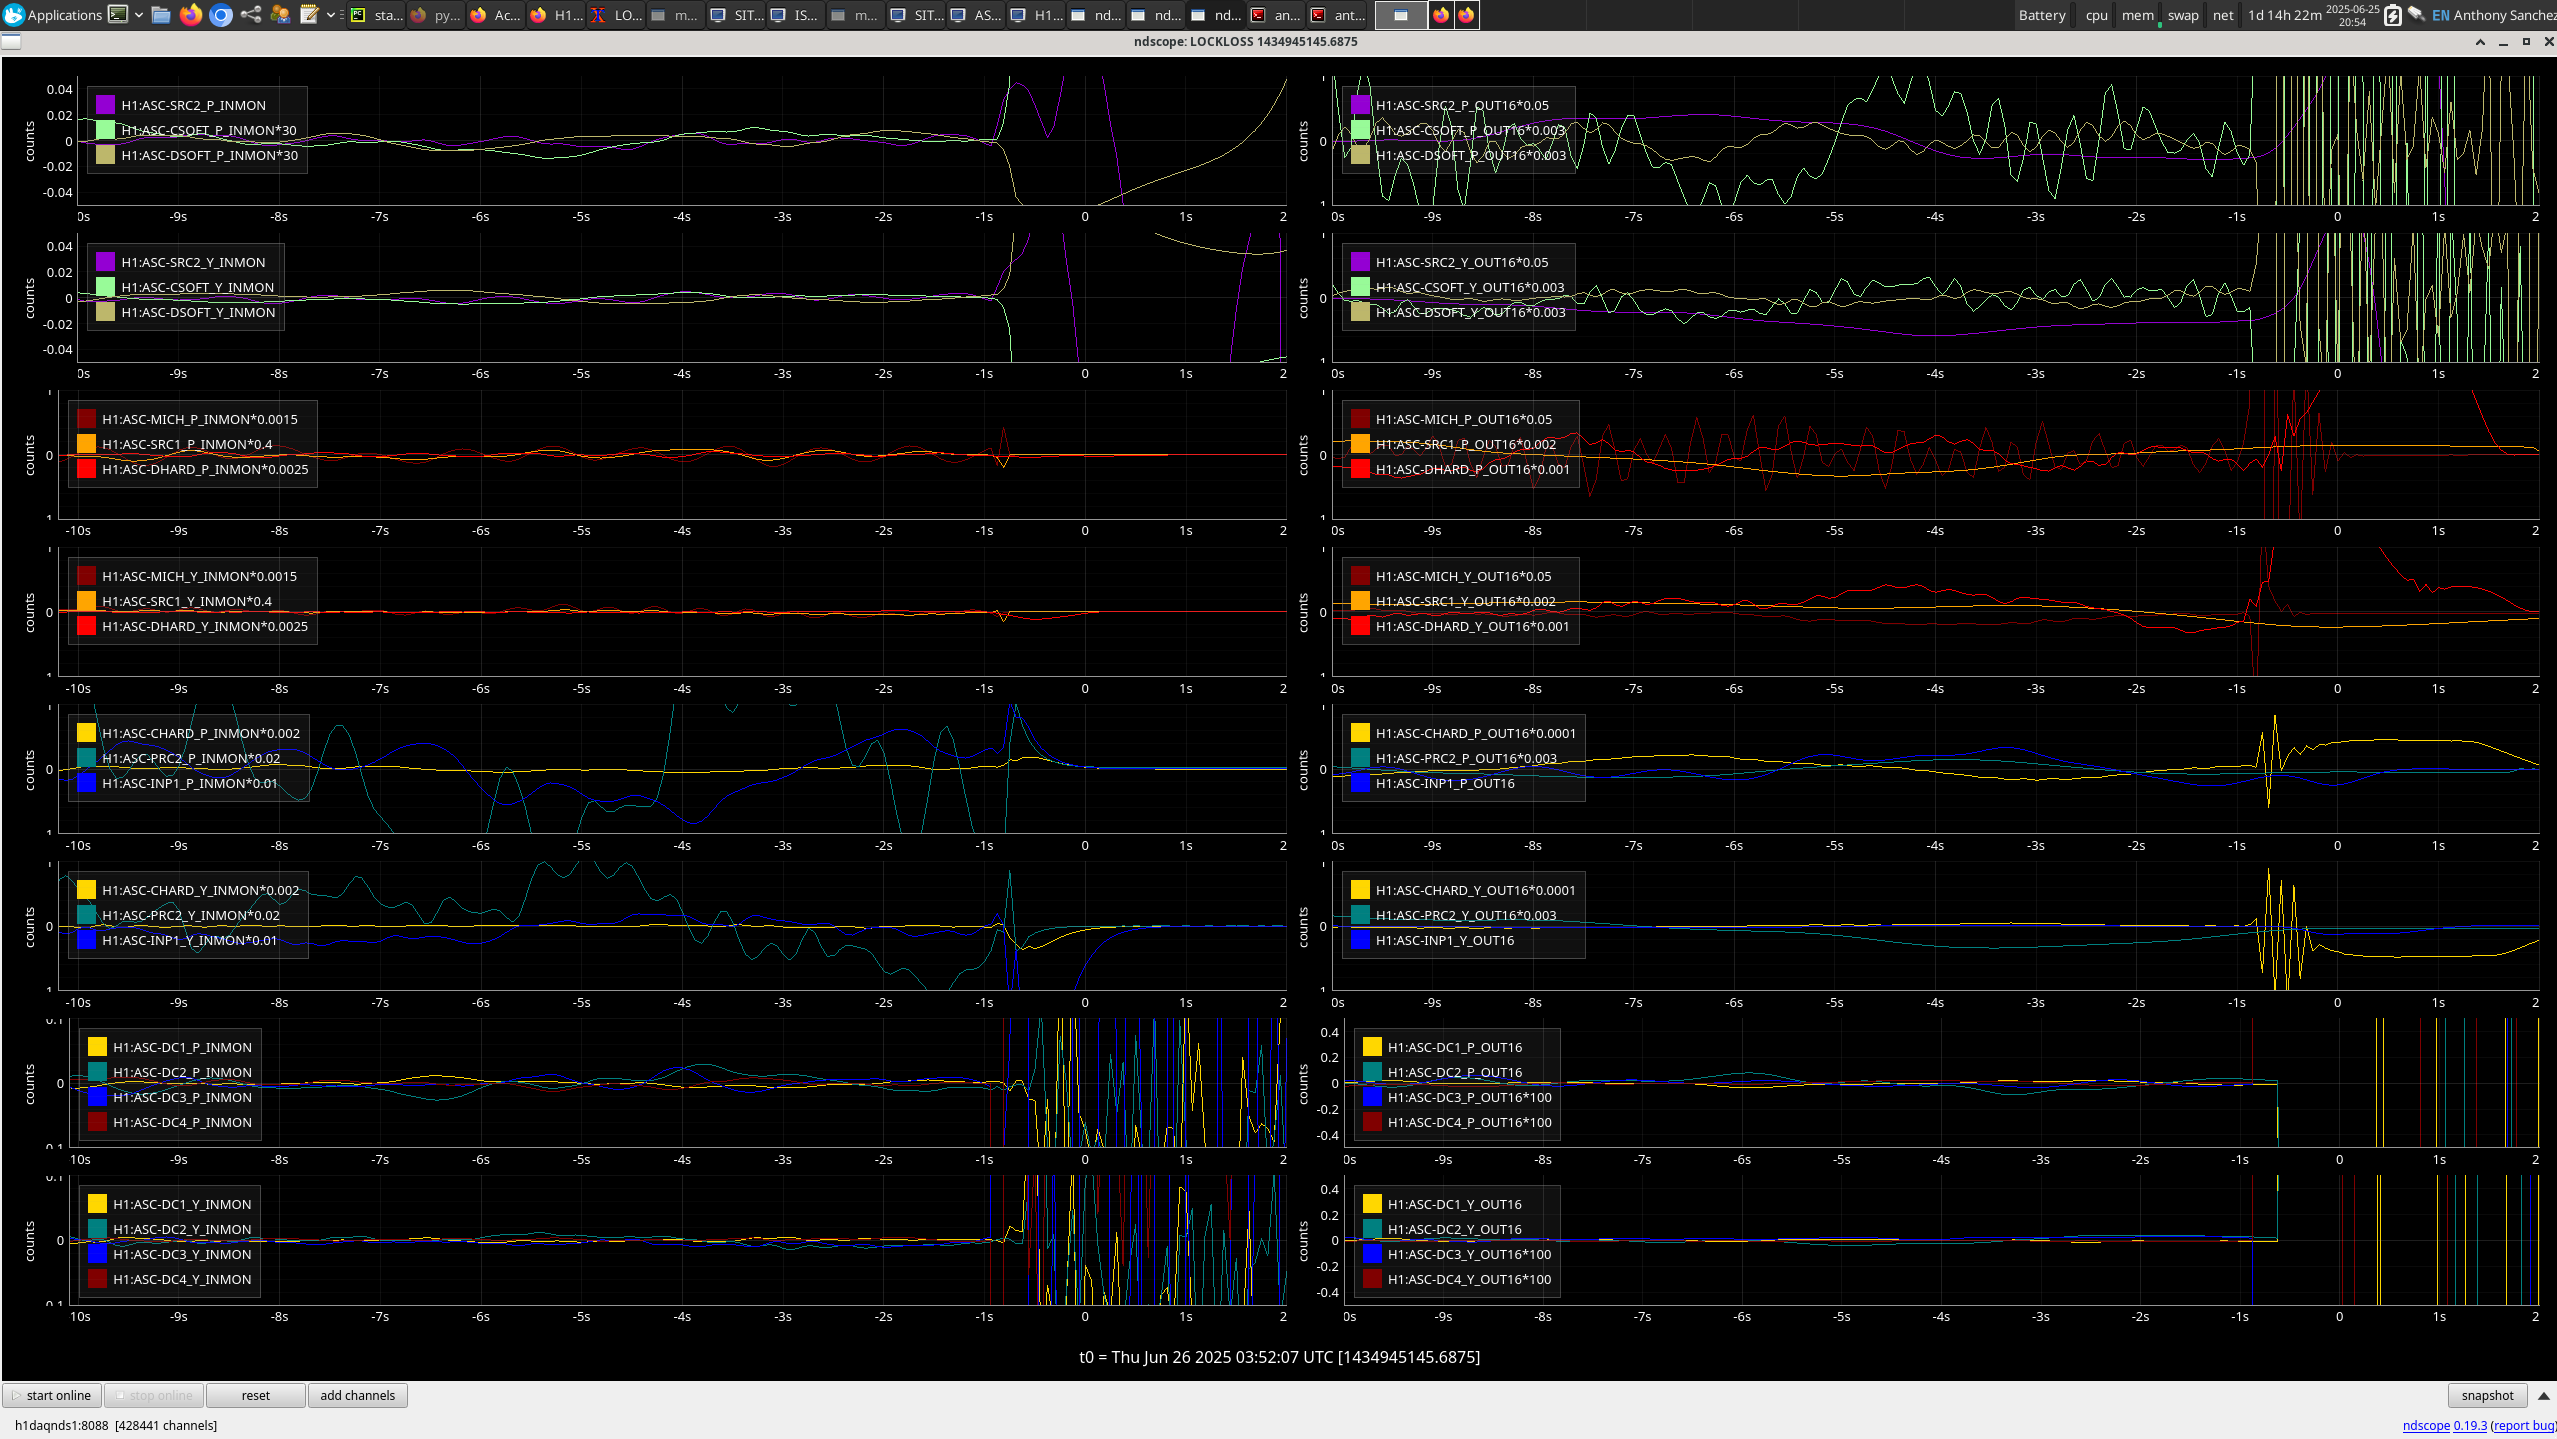
H1 was locked and Observing until ~3:52 UTC when an unknown Lockloss happened.
Relocking notes:
I let H1 do everything on it's own, It relocked it's self eventually after going through PRMI and making it up to START_TR_CARM and Locklossing all the way back to DOWN.
But I just let it be and it Relocked it self on the next attempt and we made it back to NLN at 5:04 UTC. Observing at 5:07 UTC.
Dropped to Comissioning due to the SQZ-man needing to adjust it's self at 5:19 UTC, then got back to OBSERVING at 5:22 UTC with no intervention.
LOG:
No Log
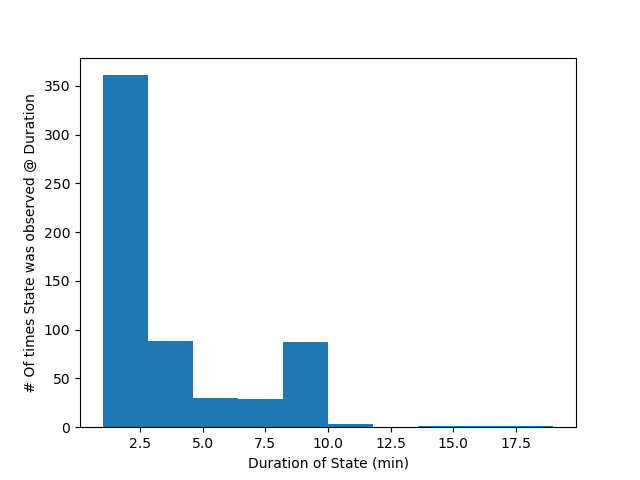
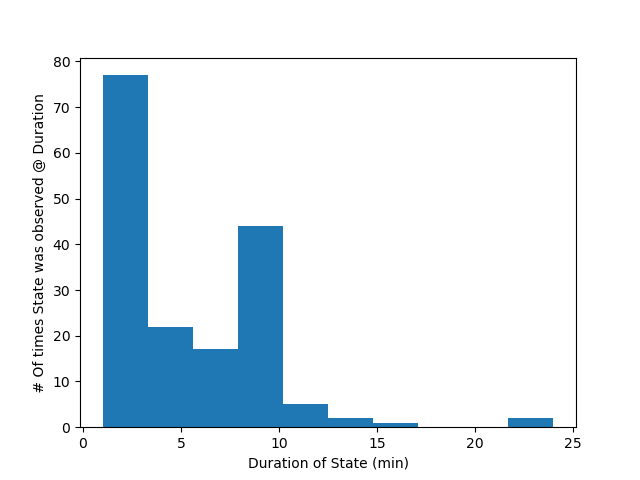
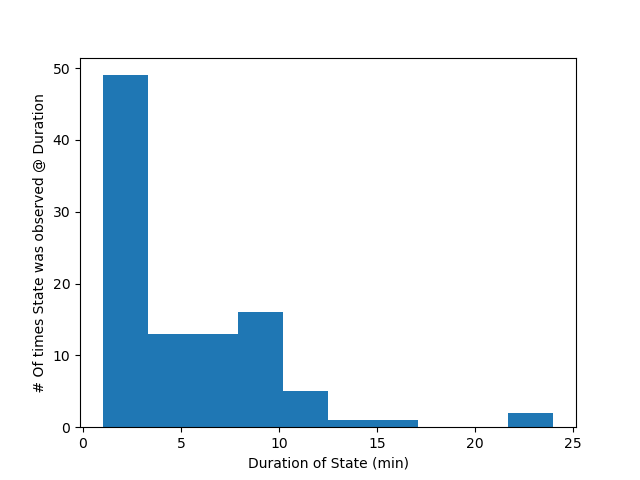
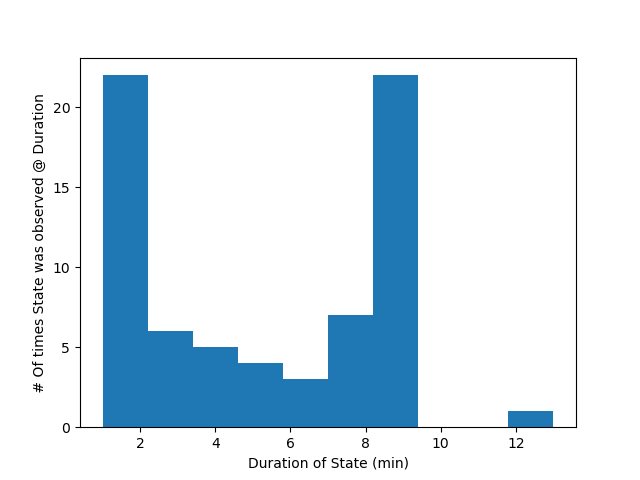
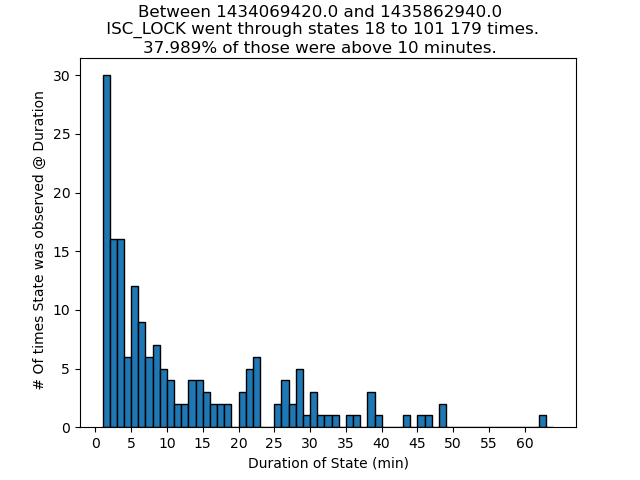
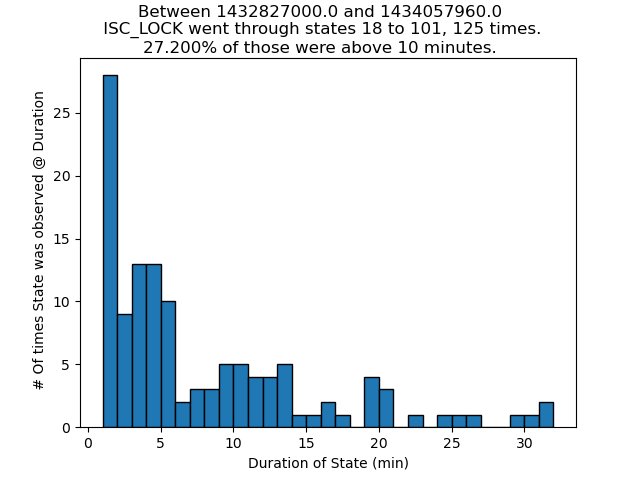
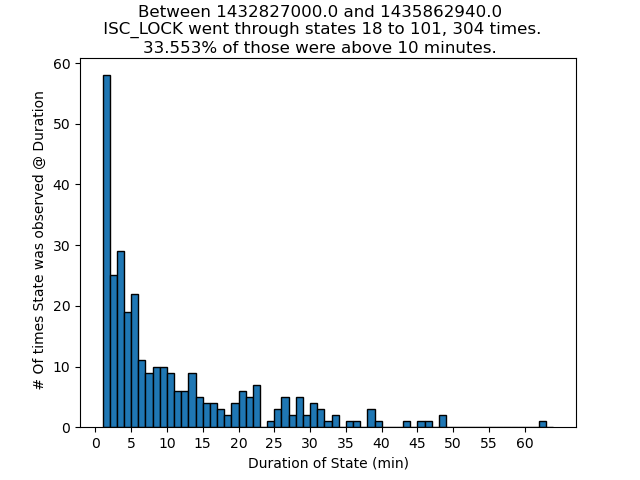
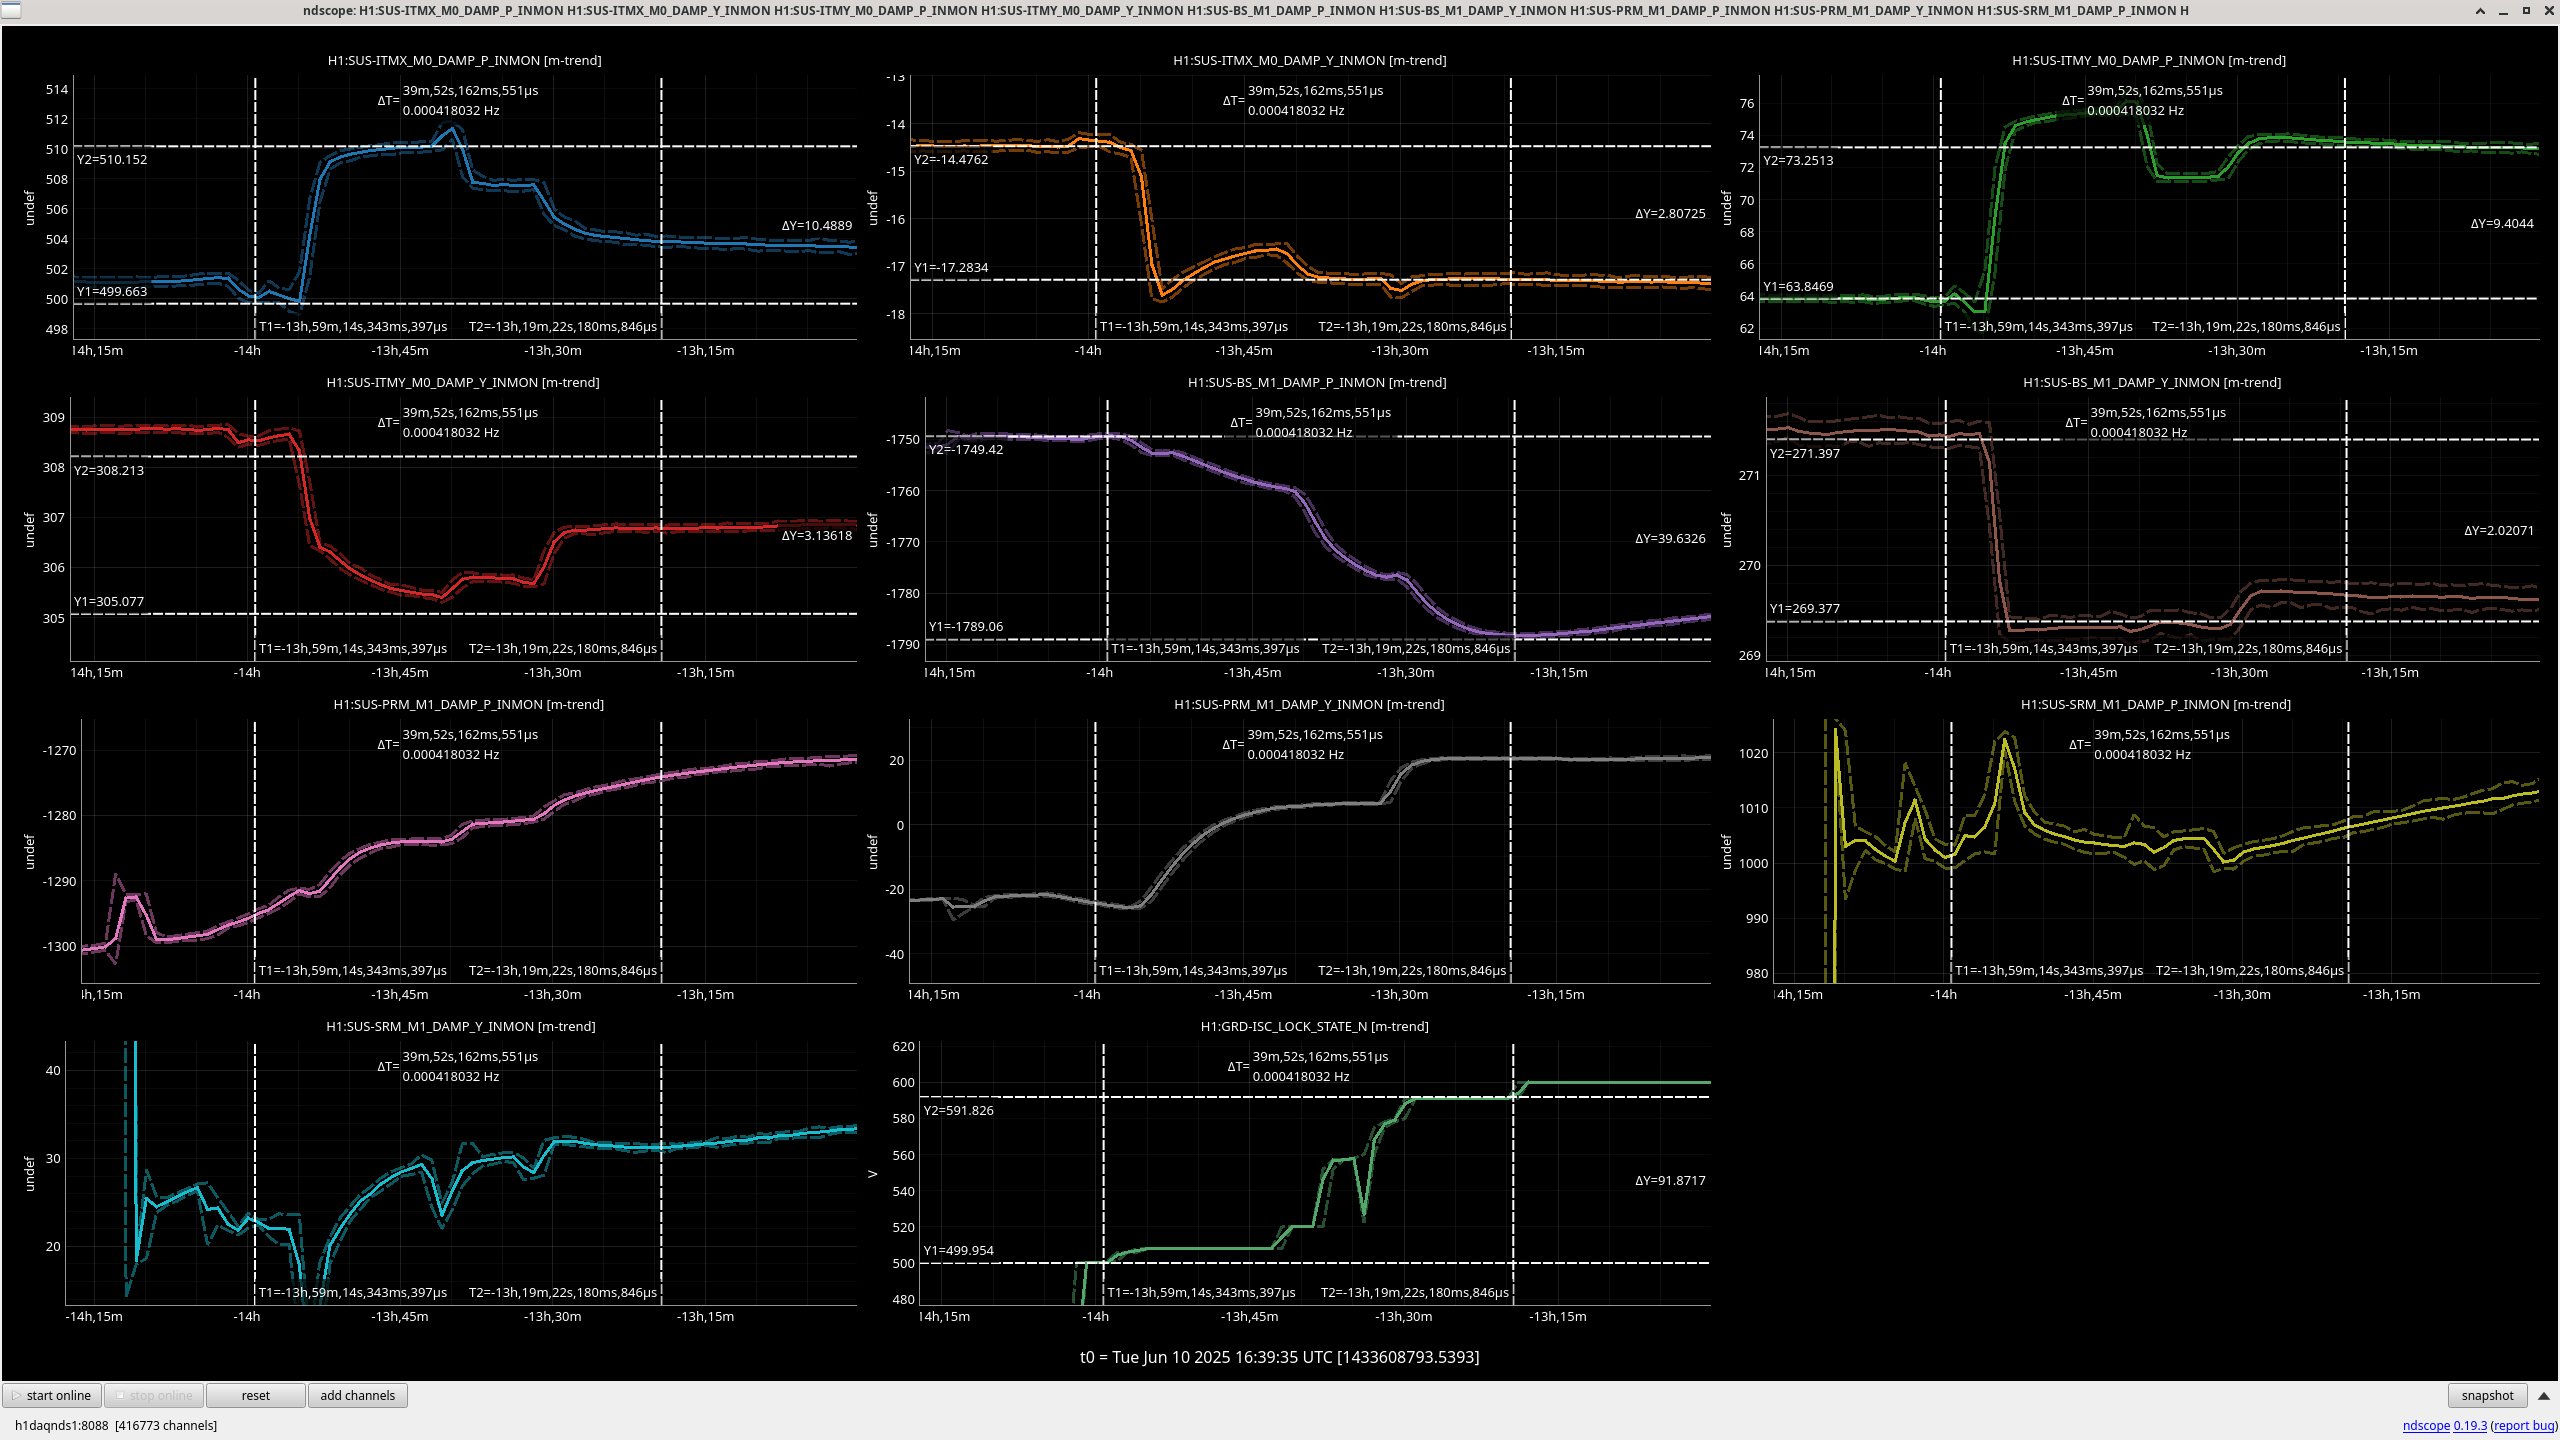
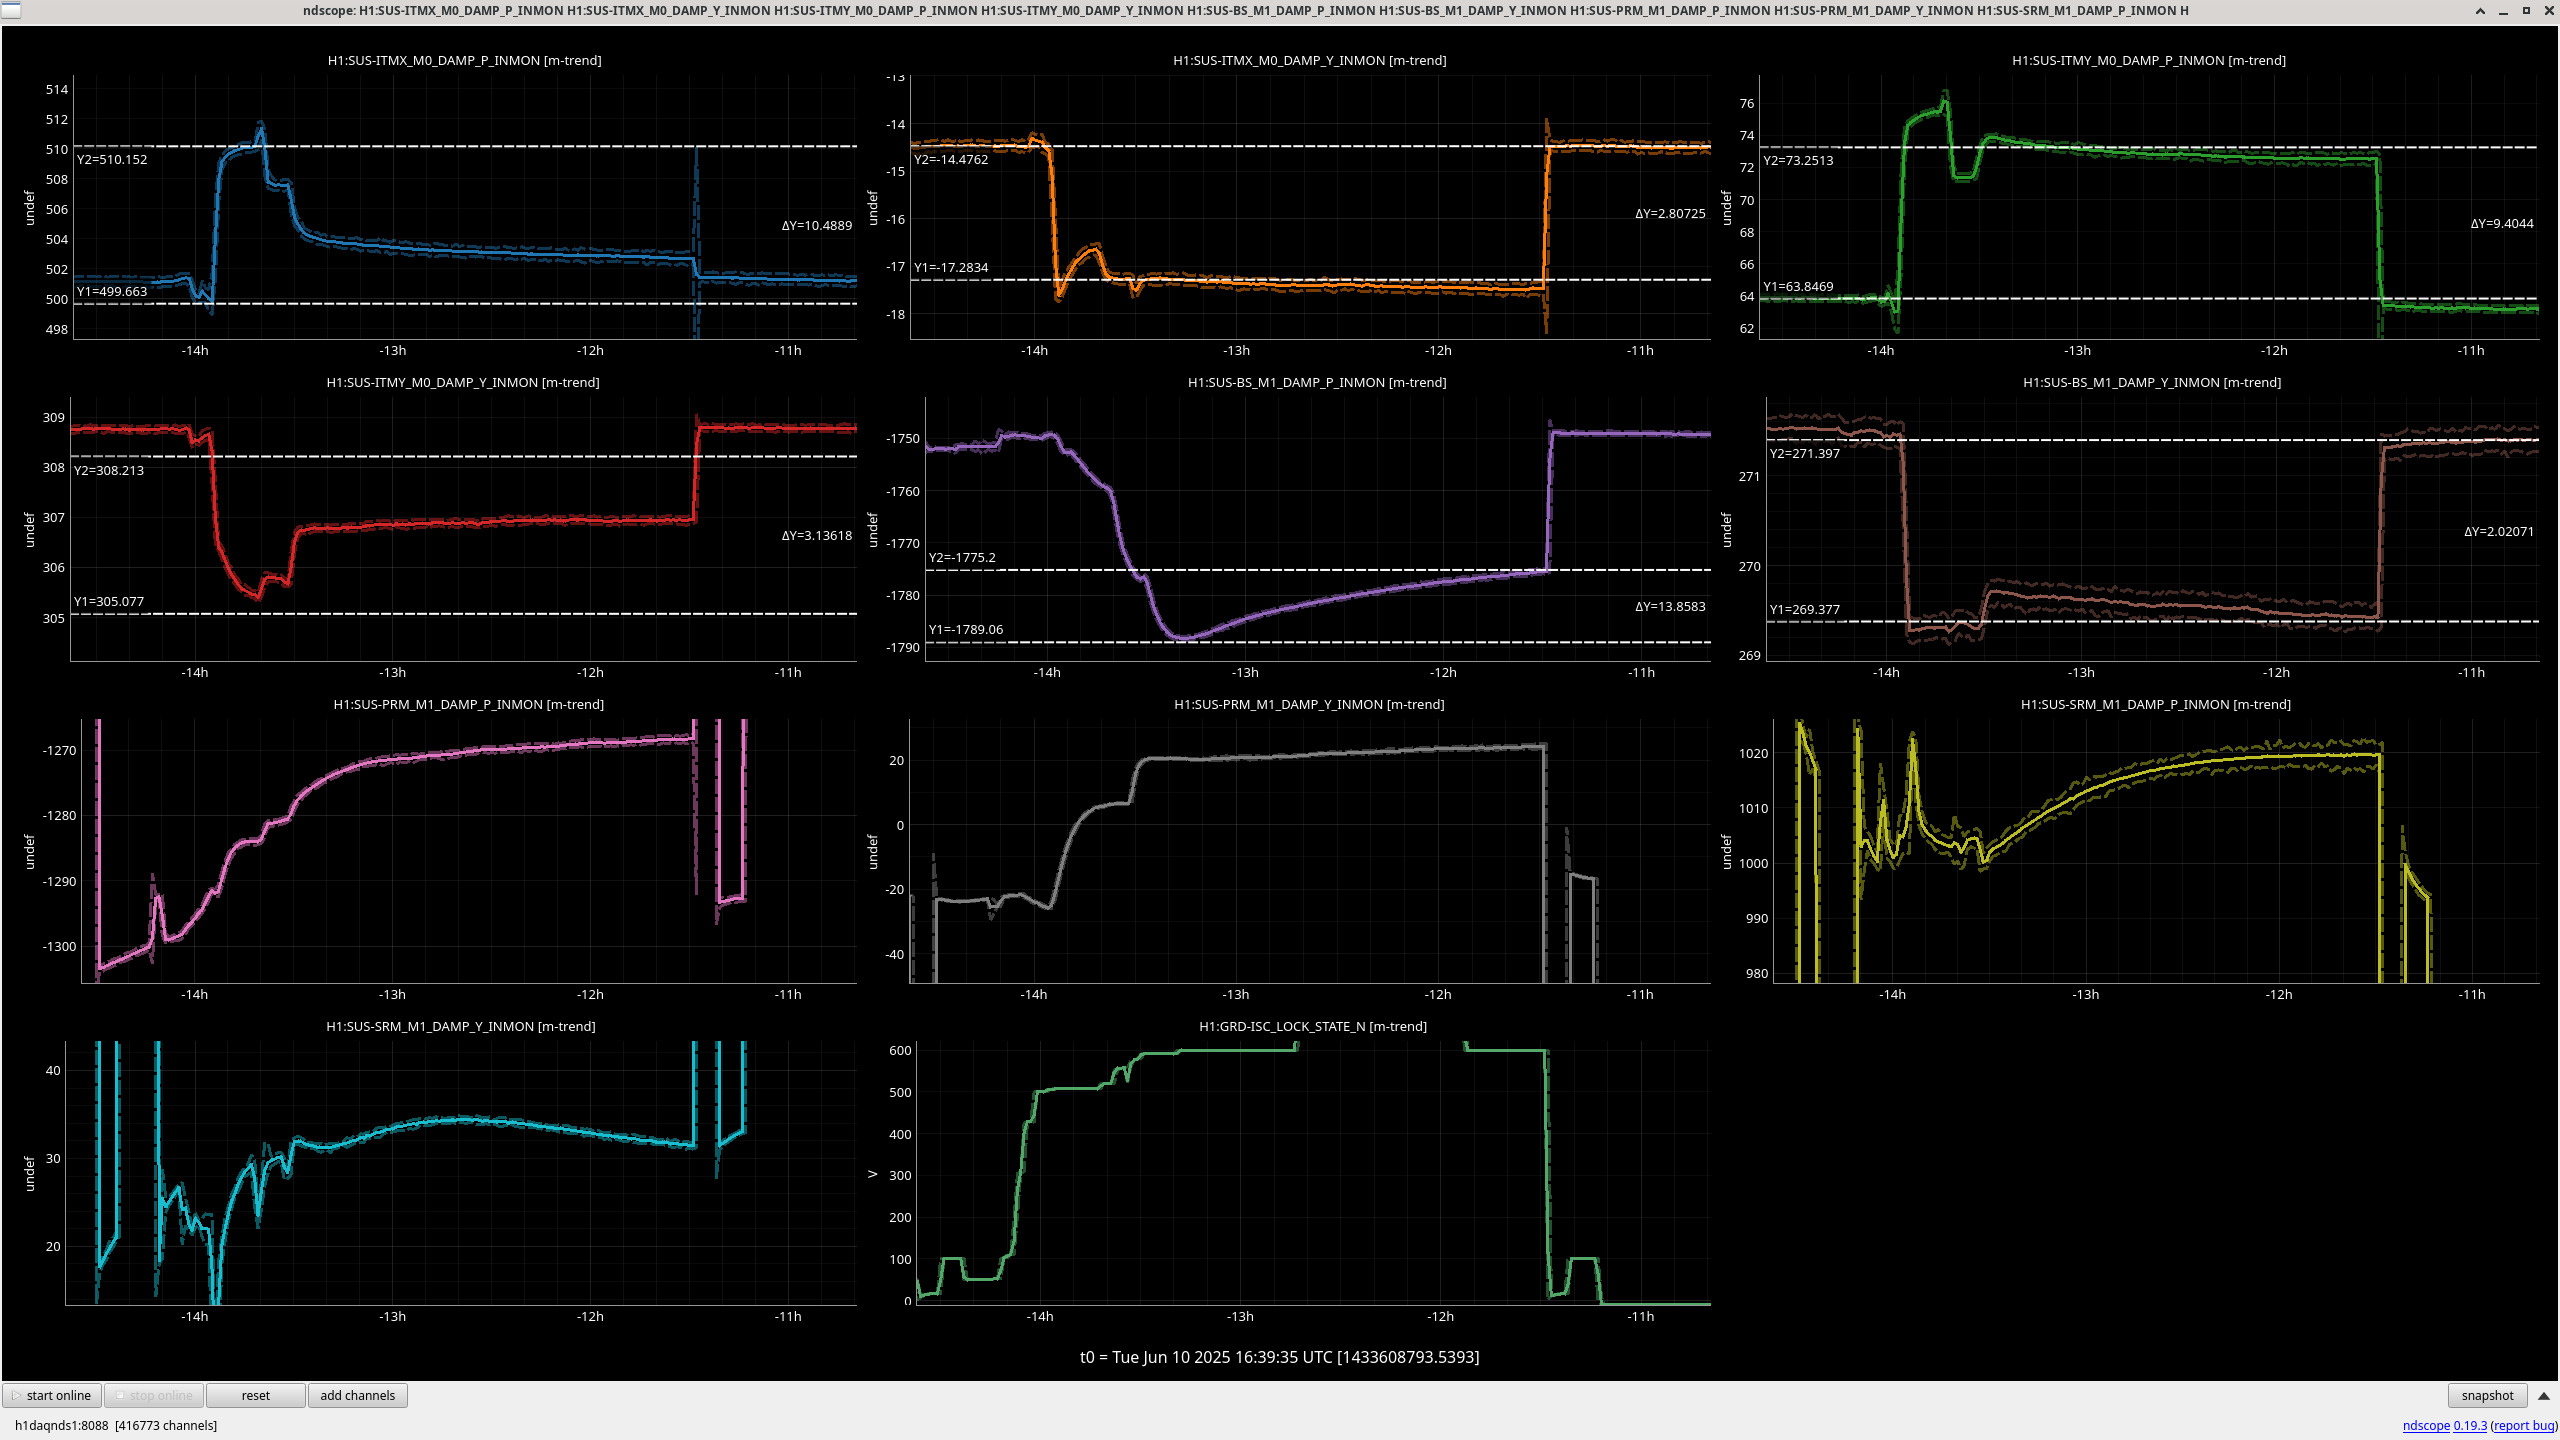
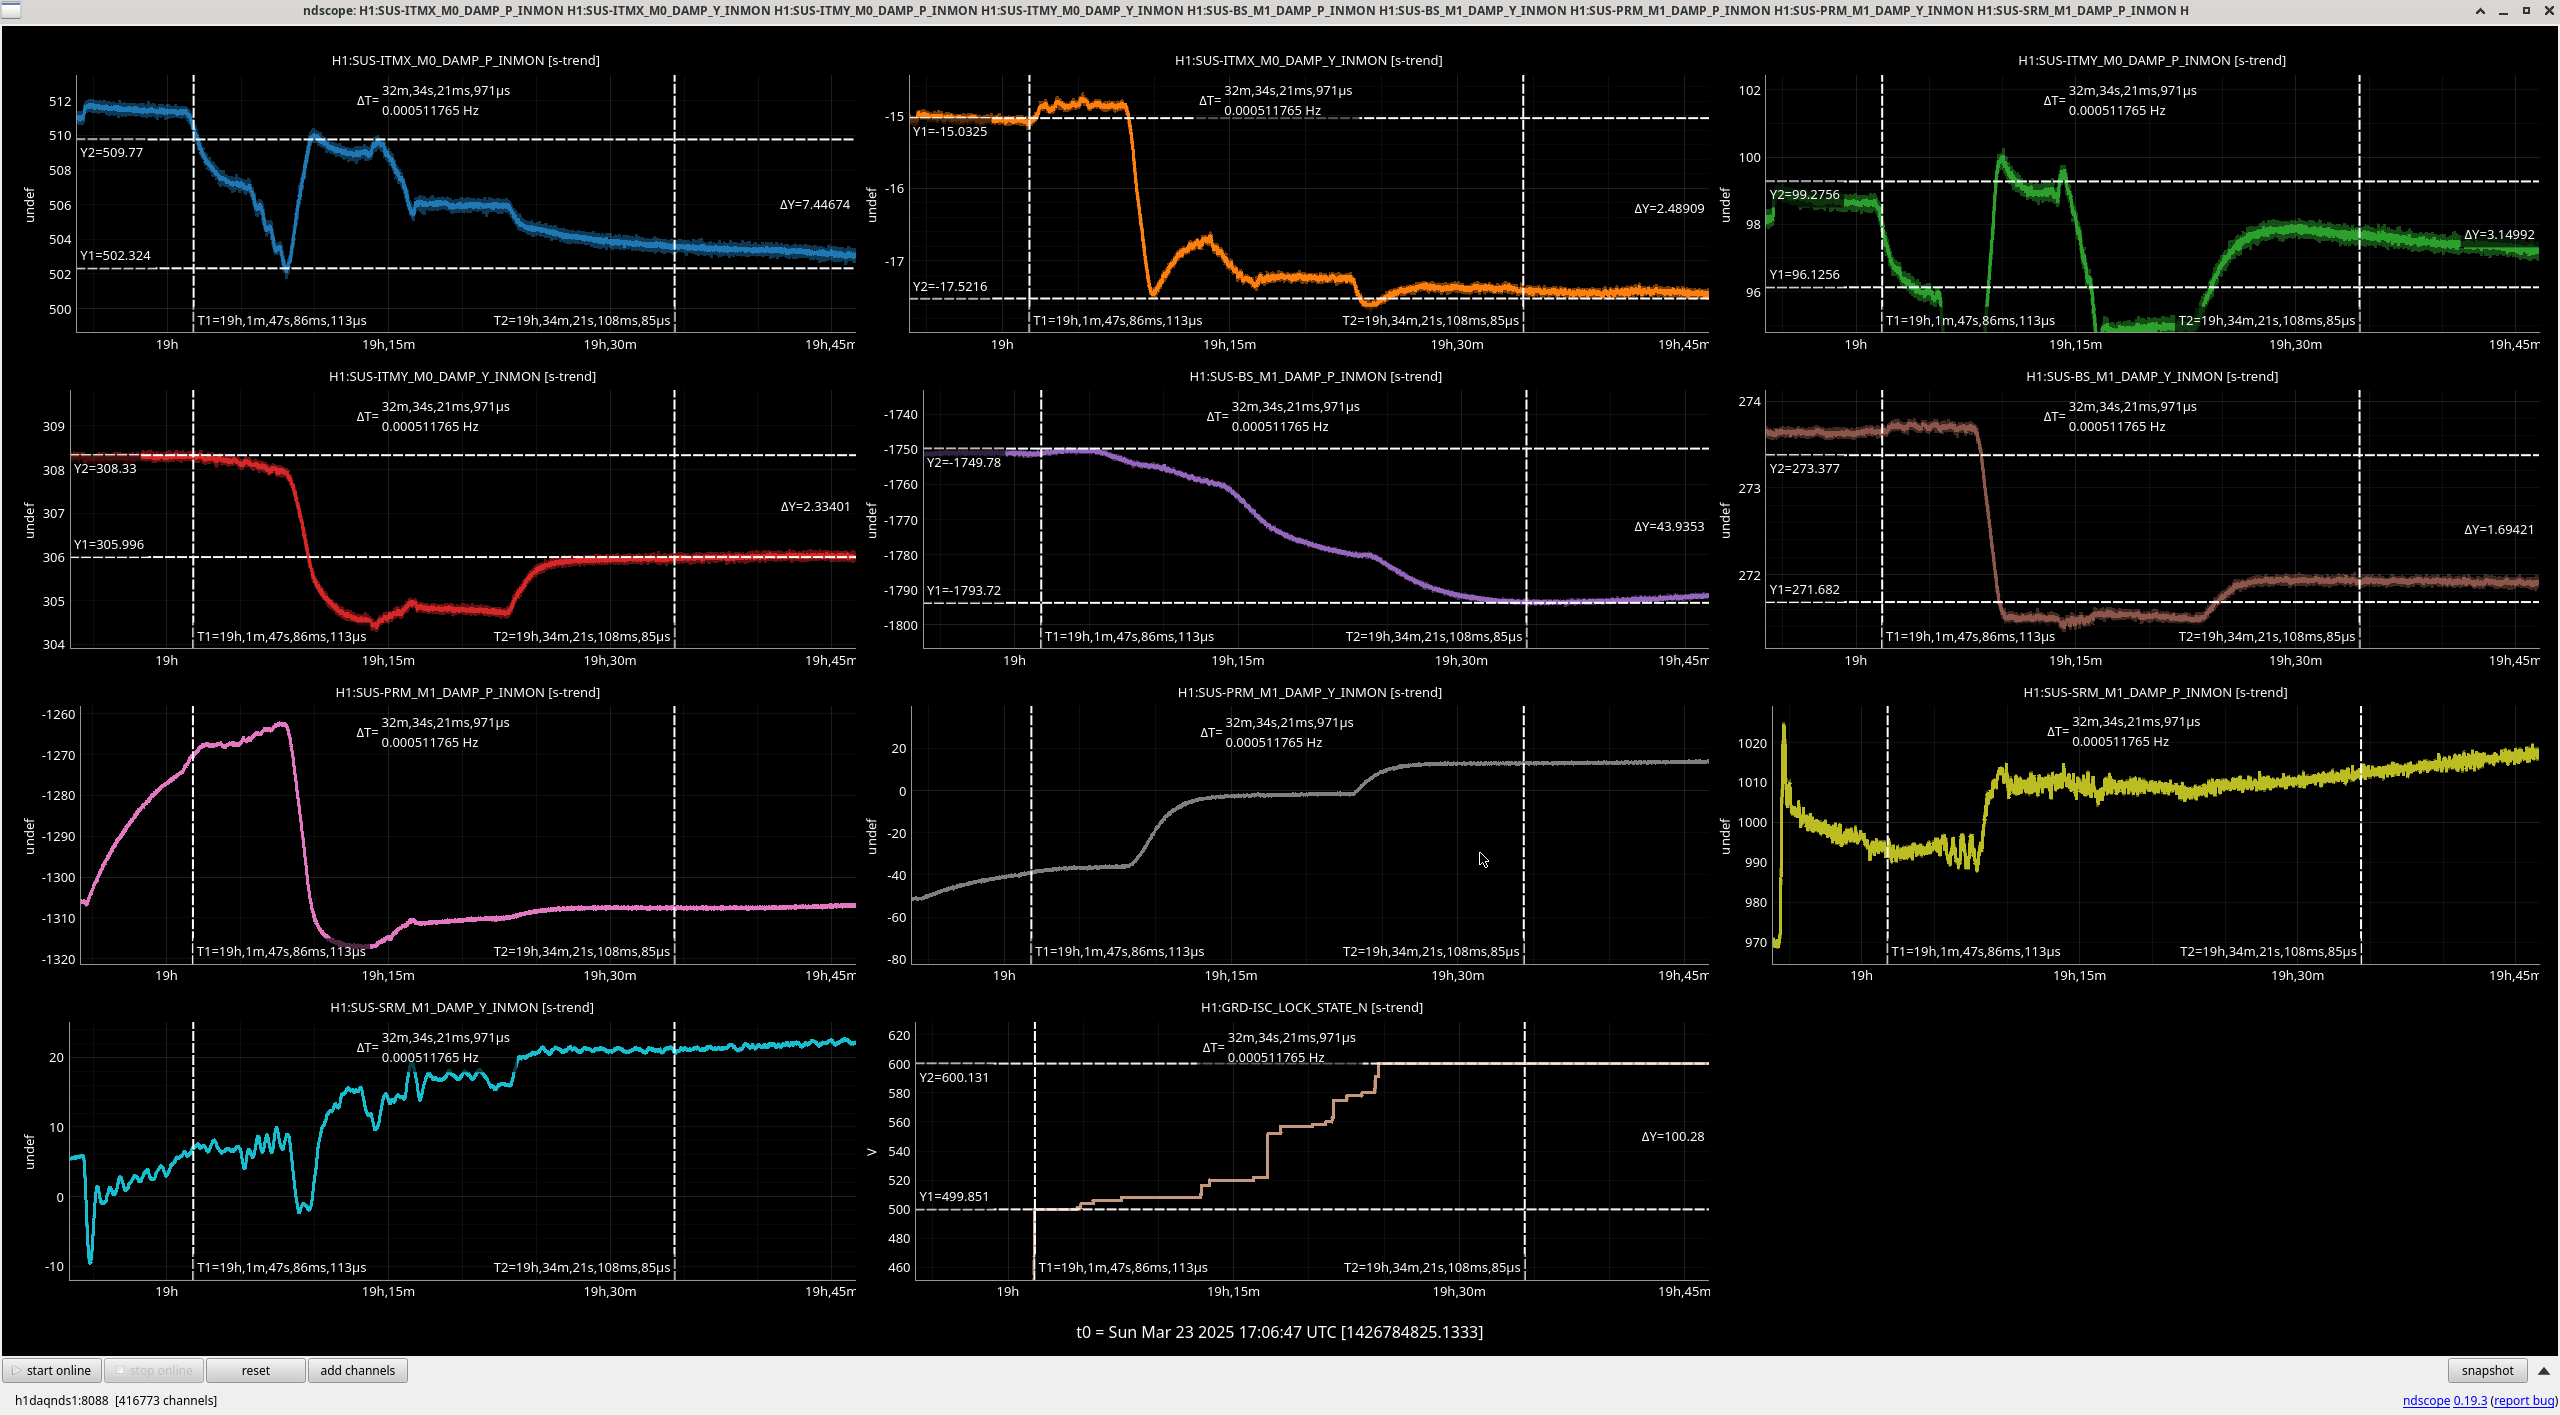
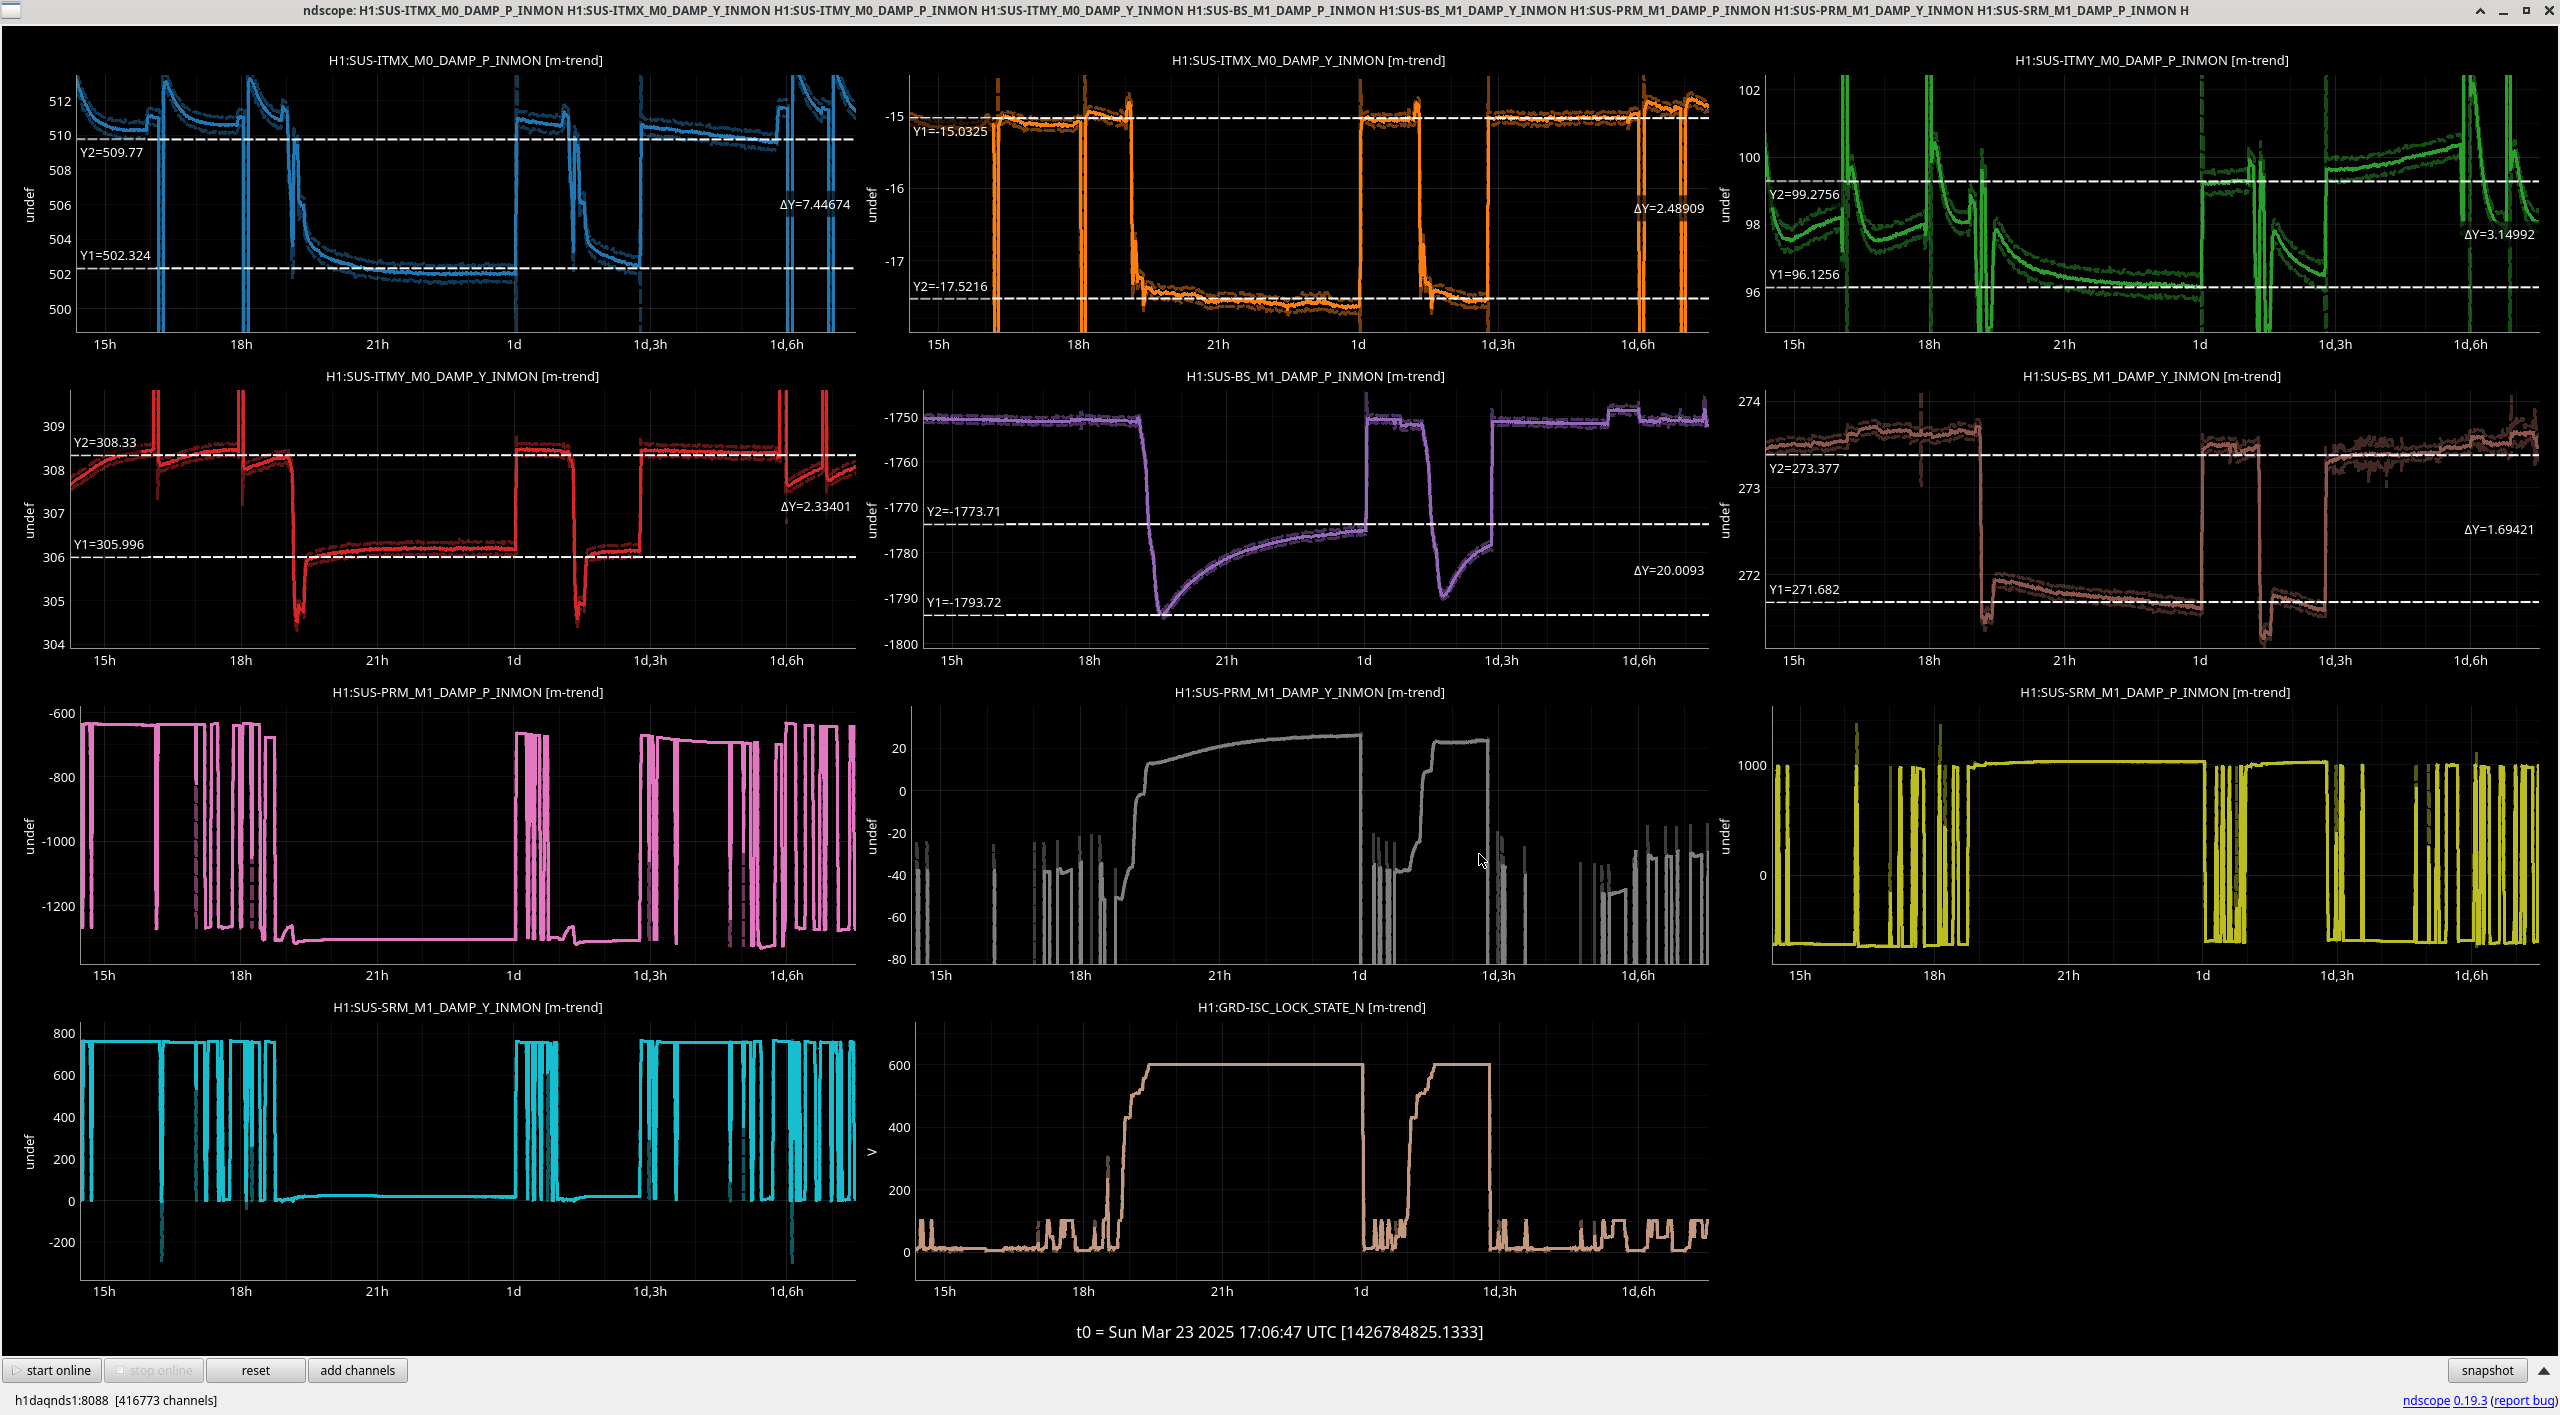
Using a script called histogram.py which calls statecounter2.0, I was able to determine how many times ISC_LOCK spent more than 60 seconds in ACQUIRE_DRMI_1F using Minute trends.
I broke this up into Pre Vent and Post vent:
Pre Vent:
Jan1st to April 1st 2025
Length of data 601
max Duration 19 Min
Average 3.5640
Post Vent:
June 1st 2025 to now
170 data points
Longest: 24 minutes.
Average: 5.1823 Min
Post vent break down.... break down:
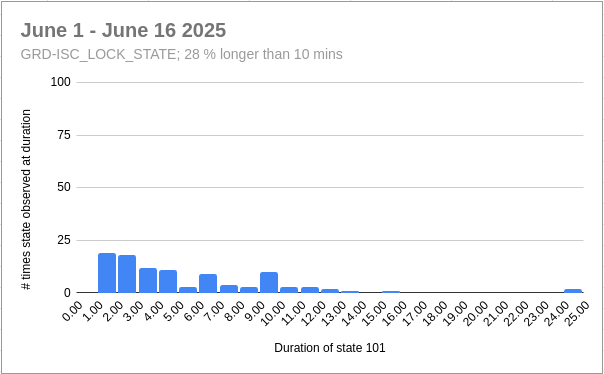
Jun 1st to Jun 16th
Length of data 100
max Duration: 24min
Average 5.04 min
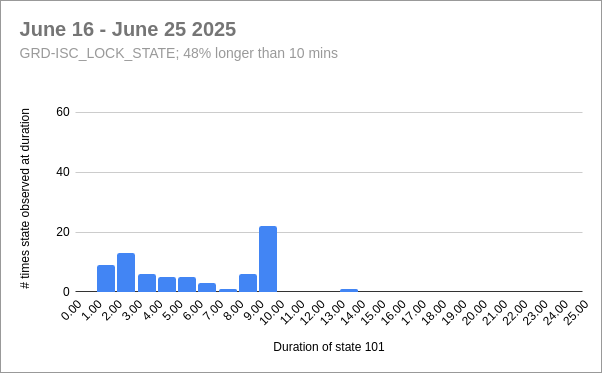
Jun 16th - now
Length of data 70
max Duration 13 Min
Average 5.38571
Link to a google sheet with all the exported data, and GPS times.
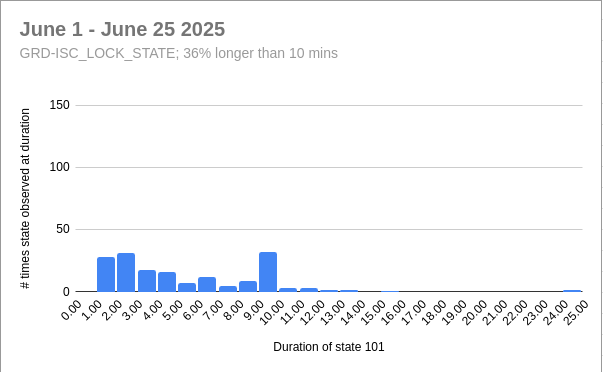
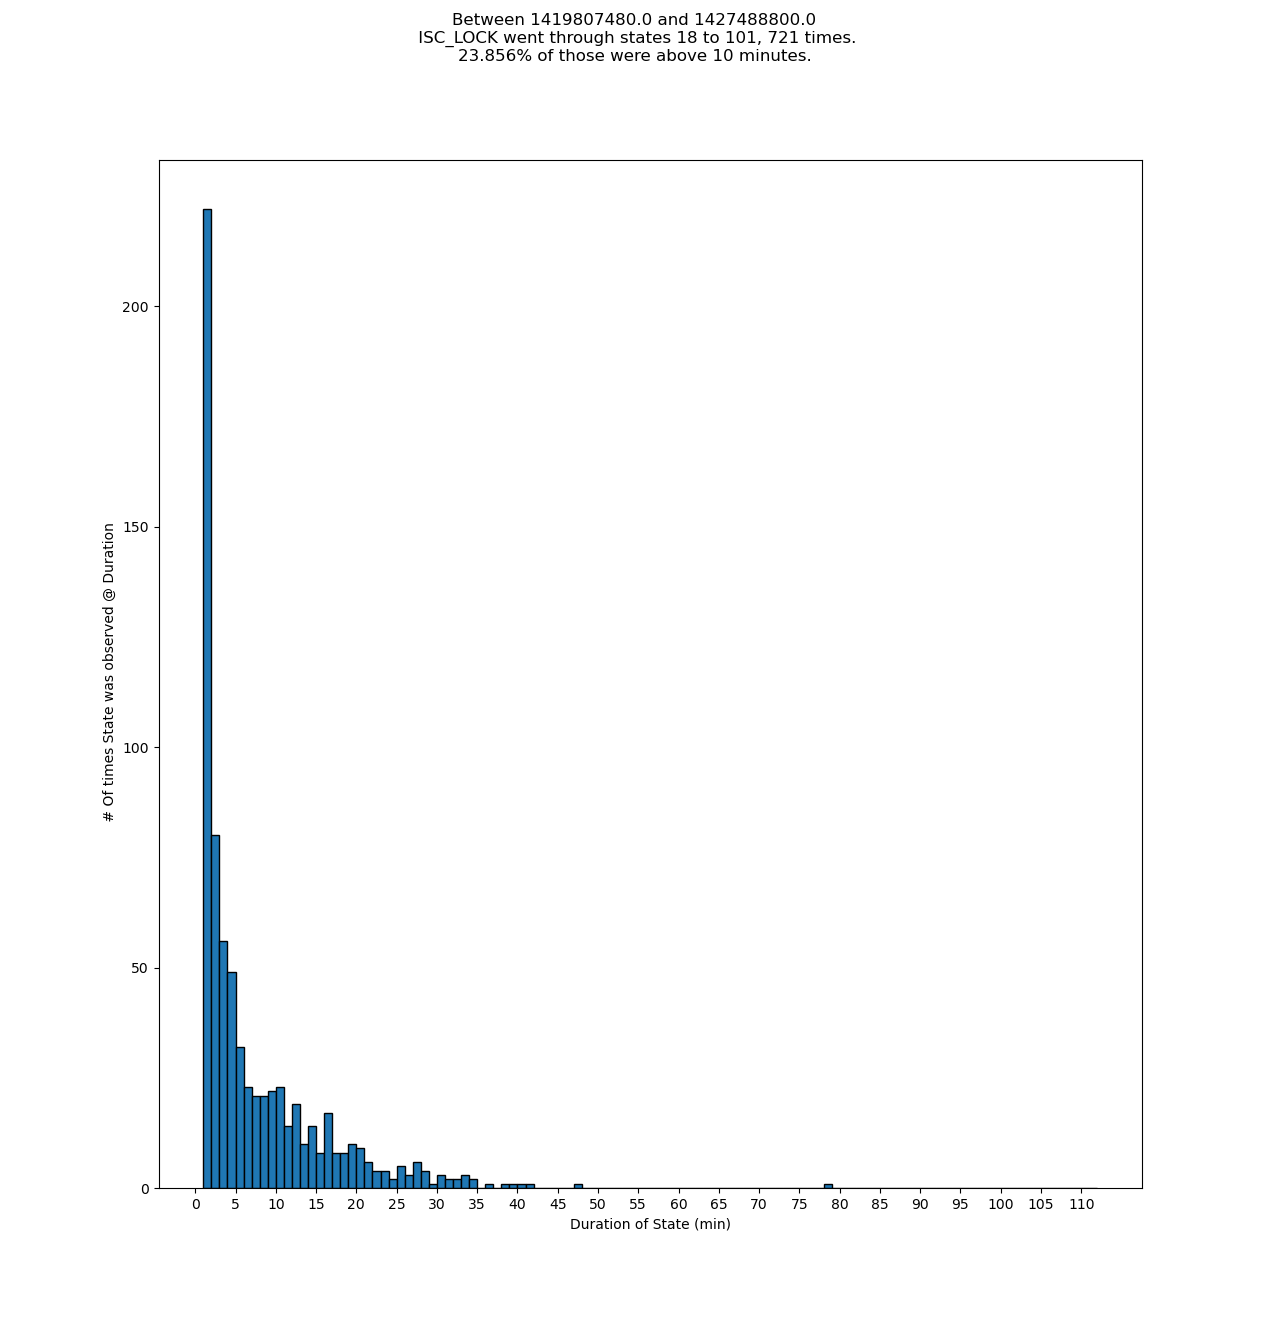
I copied Tony's awesome spreadsheet, and replotted the data sets while thinking about what they mean.
I have the same 4 data sets that Tony has (Jan-April, All of June, and then broken into Early June and Late June, with the divider being the time that I enabled the 'slow let go' of the BS pitch control). However, I've got all the x-axes fixed to be 0-25 minutes. I've also set the y-axes to be (0, number lock segments), so that they are roughly normalized. In the subtitle of the plot I note the percentage of the segments who are 10 mins or longer (actually, from the data set, the percent that have a value of 9 mins or greater). Since we have a 10 minute timer in the guardian that will flip over to trying PRMI or MICH locking, this percentage should help capture the number of locks that take a long time to acquire DRMI.
Notably, the number of segments that take a long time is about 2x larger after the BS slow let go was enabled, if we look at the percent in late June (48% take a long time) versus the percent in early June (28% take a long time) :( But, both of these are much higher than the 18% that took a long time before the vent.
This may mean that the slow letting go of the BS, as currently enabled, is not helpful.
If the statecounter.py code is able to, it could be interesting to get similar statistics, but have the durations start when we leave state 18 (Arms_off_resonance) and the duration end when we get to state 102 (DRMI_locked_check_ASC). That would enable us to more accurately see the total length of time it takes during an acquisition sequence. If we do this, we'd want to count and then exclude from the statistics the number of times we 'give up' and lose lock or do an initial alignment.

Updated Statecounter to find times that a value is between 2 user selected states.
And refined a script that makes Histograms specifically for DRMI Histogram Investigations that calls Statecounter.
tconvert jan 1 2025 = 1419724818
tconvert apr 1 2025 = 1427500818
tconvert jun 1 2025 = 1432771218
tconvert jun 16 2025 = 1434067218
tconvert now = 1435883245
The GPS Times are rounded off by Jim's round function so they fit into minute trend windows.
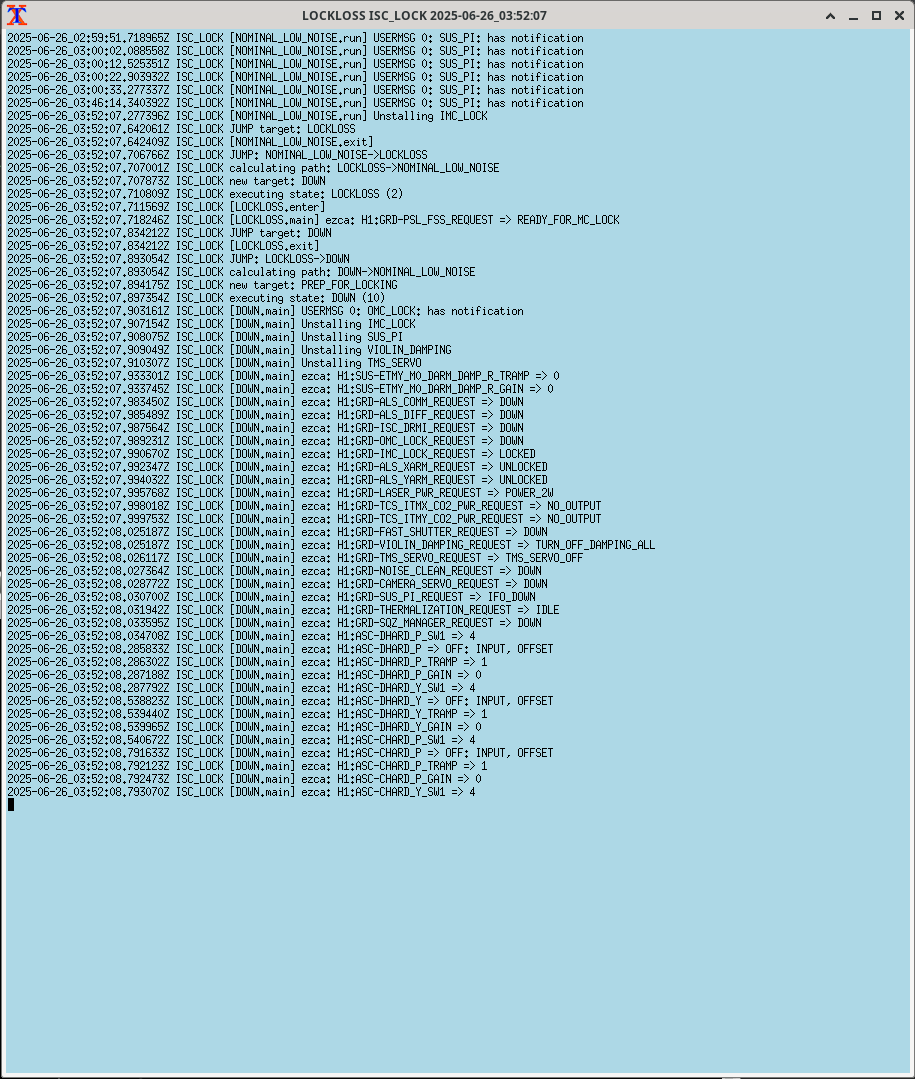
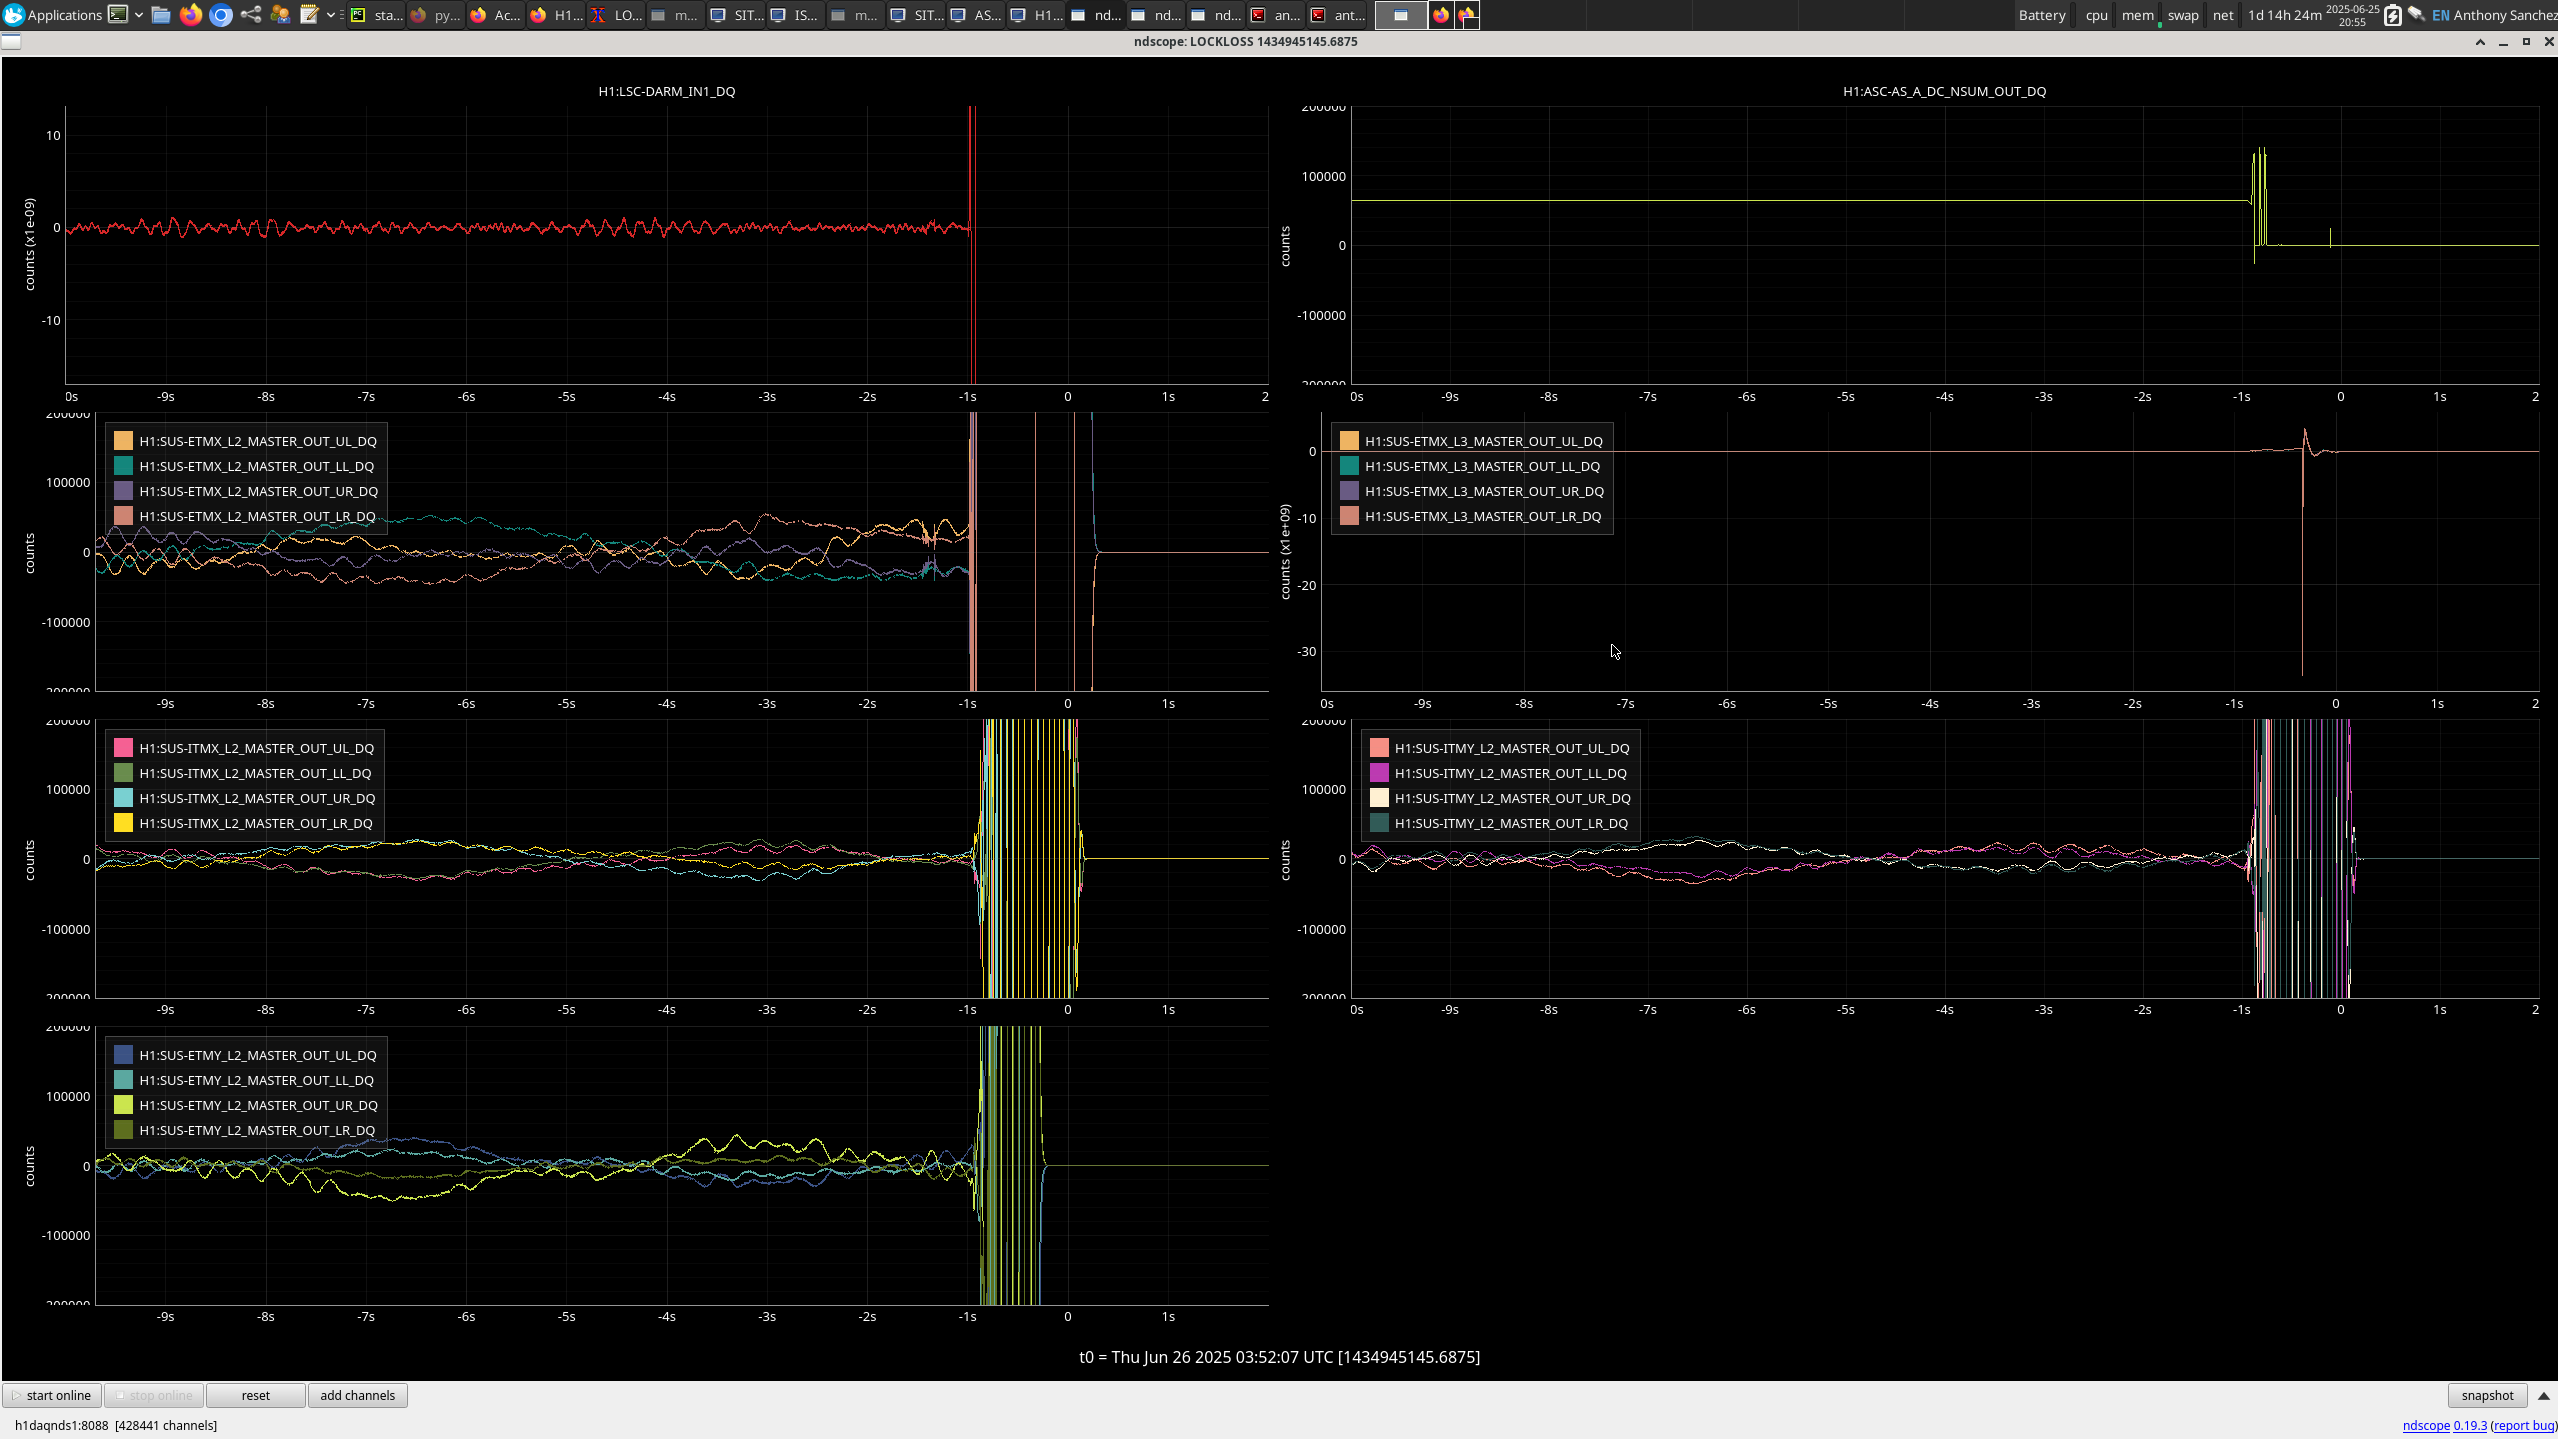
Unknown Lockloss @ 3:52 UTC
J. Kissel, F. Clara

Executive Summary
I've measured the frequency response of all the channels of a D0900900-v2 / D0901284-v4 UK 4CH SatAmp chassis.

This is in prep as a "before" vs. "after" for ECR E2400330 -- but also to back up the modeling I've done suggesting that 7.5% of the OSEM calibration error that Edgard finds is from compensating the frequency response of a D0900900-v2 / D0901284-v4 UK 4CH SatAmp with the (z:p) = (10 : 0.4) Hz digital filter that we've been using since the stone ages (see deep-cut comment from LHO:83662).

A simple model based on drawing component values is correct: the measured response of each channel confirms (z:p) = (0.384 : 10.6) Hz, and that we should be compensating with the inverse of that instead, i.e. a digital filter of (z:p) = (10.6 : 0.384) Hz.

Measurement Setup

Fil had already set aside S1100173, a UK satamp for ECR E2400330 upgrade, so I measured the response of that using an SR785.

Fil introduced me to the satamp tester board, D1000878-v1, which is a nice easy interface for driving an equivalent PD current into the board via fixed 242.0e3 [Ohm] resistor connected to the satamp's PD (K, or Cathode) Input (a la LHO:61202).

The
    (V_src_SE / I_in) = 242.0e3 [Ohm] (measured)
series resistor *almost* perfectly cancels out the transimpedance resistor and differential driver; this unit's TIA resistors measure to be
    (CH1,CH2,CH3,CH4) = (120.1, 120.1, 120.1, 120.0) [Ohm] (measured)
making the overall transimpedance of most of the channels
    V_out_DIFF / I_in = - 240.2e3 [Ohm] (modeled)
where I include the negative sign accrued from sending in a positive current, rather than a negative current that occurs when more light impinges on the PD, a la the negative reverse bias configuration that's used in the field (see G2500980).

That means this measurement should have a DC gain (and sign) of
    I_in / V_src_SE * V_out_DIFF / I_in = (240.2e3/242.0e3) = - 0.9926 [V_SE/V_DIFF] (modeled).

The only down-side is that the board nominally puts the satamp's differential output voltage on the signal pin and shield of one BNC connector, so I had to do a bit of ugly BNC / clip-lead adapter shenanigans to extract the differential voltage (there's a picture in the collection referenced below for future reference).

Attached are detailed measurement setup notes and pictures.

Results

The measurements confirms that the frequency response of the D0901284-v4 UK SatAmp matches the simple of model of (z:p) = (0.384 : 10.6 , 5.2e3) Hz from LHO:83662 to the tune "model / measurement" is within +/-1.5 [%] / +/-1.0 [deg] at all frequencies measured (up to 1 kHz). See four-page collection of plots attached.
For the careful reader,
    - the (z:p) = (0.384 : 10.6) Hz comes from the whitening stage. This is what we're changing in ECR E2400330.
    - 5.2e3 Hz pole frequency comes from the transimpedance stage.

As discussed in LHO:83662, the (z:p) = (0.384 : 10.6) Hz is predicted wonderfully by using the component values as drawn in D0901284-v4.

However, if you use the as drawn values for the transimpedance stage, you would expect the high frequency pole to be at
    f_p = 1/(2*pi*R102*C101)
        = 1/(2*pi*121e3*220e-12)
        = 6.0236 [kHz]

I used 5.2 kHz in the model above to force the (model/meas) ratio for channel 1 to (unity magnitude) & (zero phase), and it worked well enough for the other channels that I didn't bother changing it.
If we take that "measured pole frequency" along with the measured R102 values, that instead suggests that
    C = 1/(2*pi*R102*f_p)
      = 1/(2*pi*120.1e3*5.2e3)
      = 254.8 [pF]

If we're talking component value discrepancies on the order of 1 kOhm out of 120 kOhm and 30 [pF] out of 220 [pF], that result in a lower pole frequency to the tune of 800 Hz out of 6 kHz and that pole frequency doesn't matter for the control system that these OSEMs -- then I don't care, and you shouldn't either.

Thank you for reading my deep cuts, careful reader.
See you, Space Cowboy...
J. Kissel, F. Clara,

In the background, I'm still thinking about why the sign of the RMs' OSEM PD readback is negative (LHO:84462), and had the opportunity today to make some sanity checks via measurement that can provide some pillars of truth in a very the confusing journey.

As a part of the journey in understanding the differences in PD readout configurations that we have (G2500980), I was asking around and the current state of institutional memory is that "we do NOT bias the OSEM PDs." This contradicts what I thought was the decision made in 2011 per G1100856 that "we should just bias all OSEM PDs, because the AOSEMs' need it and the BOSEMs' performance doesn't change."

This boils down to the position of a jumper that either connects or disconnects the satamp bias voltage to the OSEM PD's cathode or anode (yes, we have in-vac cabling to the PD + satamp connections that create both positive or negative reverse bias transimpedance configurations when the jumper connects the bias to the cathode or anode, respectively).
    - D0900900 / D0901284 :: UK 4CH SatAmp :: Negative Reverse Bias config when jumper connects -10V bias to anode.
    - D1002818 / D080276 :: US 8CH SatAmp :: Positive Reverse Bias config when jumper connects +10V bias to cathode.
    - D1900089 / D1900217 :: US 4CH SatAmp :: Negative Reverse Bias config when jumper connects -10V bias to anode.

The confusion lies in the language. Any one of the following equivalent notations / abbreviations are used throughout OSEM drawing and presentation literature, and it's *definitely* inconsistent:
    - biasing the PD = "photo-conductive" mode = pc mode = pc = AOSEMs = "LIGO OSEMs" = L
    - zero bias = "photo-voltaic" mode = pv mode = pv = BOSEMs = "Birmingham OSEMs" = B

The drawings for the SatAmps themselves use the "L" (for biased) and "B" (for zero bias), and that's what's printed on their PCB board.

To confirm that "L" = biased, while working on characterizing the UK satamps in prep for ECR E2400330, Fil and I did a quick sanity check that
    (a) with the jumpers in the "L" position, that
    (b) -10V comes out on pins 12, 9, 6, 3 of the J1 "VACUUM TANK" DB25 port,
implying that, since the UK SatAmps -- if indeed all jumpered to the "L" position -- and in-vac wiring connect these pins to the OSEM PD's anode, then the OSEM PDs are in a negative reverse bias configuration.

We confirm this: that UK SatAmps with their jumpers in the "L" position put -10V on pins 12, 9, 6, and 3.
See attached picture series.

What we cannot confirm -- in any quick way -- is going out to each satamp, and seeing that the jumpers *are* in the "L" position.
The same institutional memory does think they are jumpered in the "L" position, but 10-20 years after setting some of them, folks are not sure any more.

BUT -- we *can* confirm as we have to go inside each UK SatAmp box to slowly roll out ECR E2400330, and so we will.
TITLE: 06/25 Eve Shift: 2330-0500 UTC (1630-2200 PST), all times posted in UTC
STATE of H1: Observing at 153Mpc
OUTGOING OPERATOR: Oli
CURRENT ENVIRONMENT:
SEI_ENV state: EARTHQUAKE
Wind: 18mph Gusts, 10mph 3min avg
Primary useism: 0.17 μm/s
Secondary useism: 0.06 μm/s
QUICK SUMMARY:
H1 is currently Locked, and Observing. We are currently riding out a 6.2 Mag Earthquake from Staint Helena.
TITLE: 06/25 Day Shift: 1430-2330 UTC (0730-1630 PST), all times posted in UTC
STATE of H1: Observing at 152Mpc
INCOMING OPERATOR: Tony
SHIFT SUMMARY:
Currently Observing at 155 Mpc and have been Locked for 1 hour. Two locklosses today during my shift, but each time we were able to relock automatically and in under an hour.
LOG:
14:30 Observing at 145Mpc and have been Locked for almost 2.5 hours
15:00 Dropped out of Observing to start Commissioning
17:52 Lockloss
18:48 NOMINAL_LOW_NOISE
21:05 Observing
21:45 Lockloss
| Start Time | System | Name | Location | Lazer_Haz | Task | Time End |
|---|---|---|---|---|---|---|
| 17:28 | FAC | Tyler | High Bay | n | Looking for a tool | 17:31 |
| 18:34 | Betsy | OpticsLab | n | Putting stuff away | 18:54 | |
| 19:29 | FAC | Randy | EX | n | Picking up stuff | 19:56 |
| 20:24 | LIGO India Delegation | MY | n | Inventory | 22:24 | |
| 21:16 | FAC | Tyler | XARM | n | Checking out his faves: the bees | 22:16 |
| 21:58 | HWS | Camilla, Matt | LVEA | n | Turning down camera voltage | 22:04 |
Since the ISCT6 AS AIR camera (cam16) was moved to its new home on h1digivideo4 in early March (alog83176), Guardian had not been able to update its exposure due to the addition of a "set" button which needs to be pushed after setting the exposure request. I've updated and loaded ISC_LOCK and ALIGN_IFO to correctly write the exposure to the H1:VID-CAM16_EXP_REQ channel, then push the "set" button by writing some change to the H1:VID-CAM16_EXP_SET channel, in all places I could find (like MICH alignment, PREP_FOR_LOCKING, power increase states, and CLOSE_BEAM_DIVERTERS).
I suspect there are other instances where a Guardian node should be updated to correctly update a camera's exposure, but these were the places I immediately thought of.
I'm followed the pydarm deployment instructions here, to update the LHO pydarm install.

This is the 20250625.0 tag for pydarm (found here), and located at /ligo/groups/cal/pydarm/20250625.0

This is not the default cds conda environment, but the default you get when typing pydarm at a command line, or specifically invoking by running "conda activate /ligo/groups/cal/conda/pydarm".

This release has several fixes and improvements, including broadband pcal vs sweeps plot, as well as some fixes for uncertainty generation for C01.
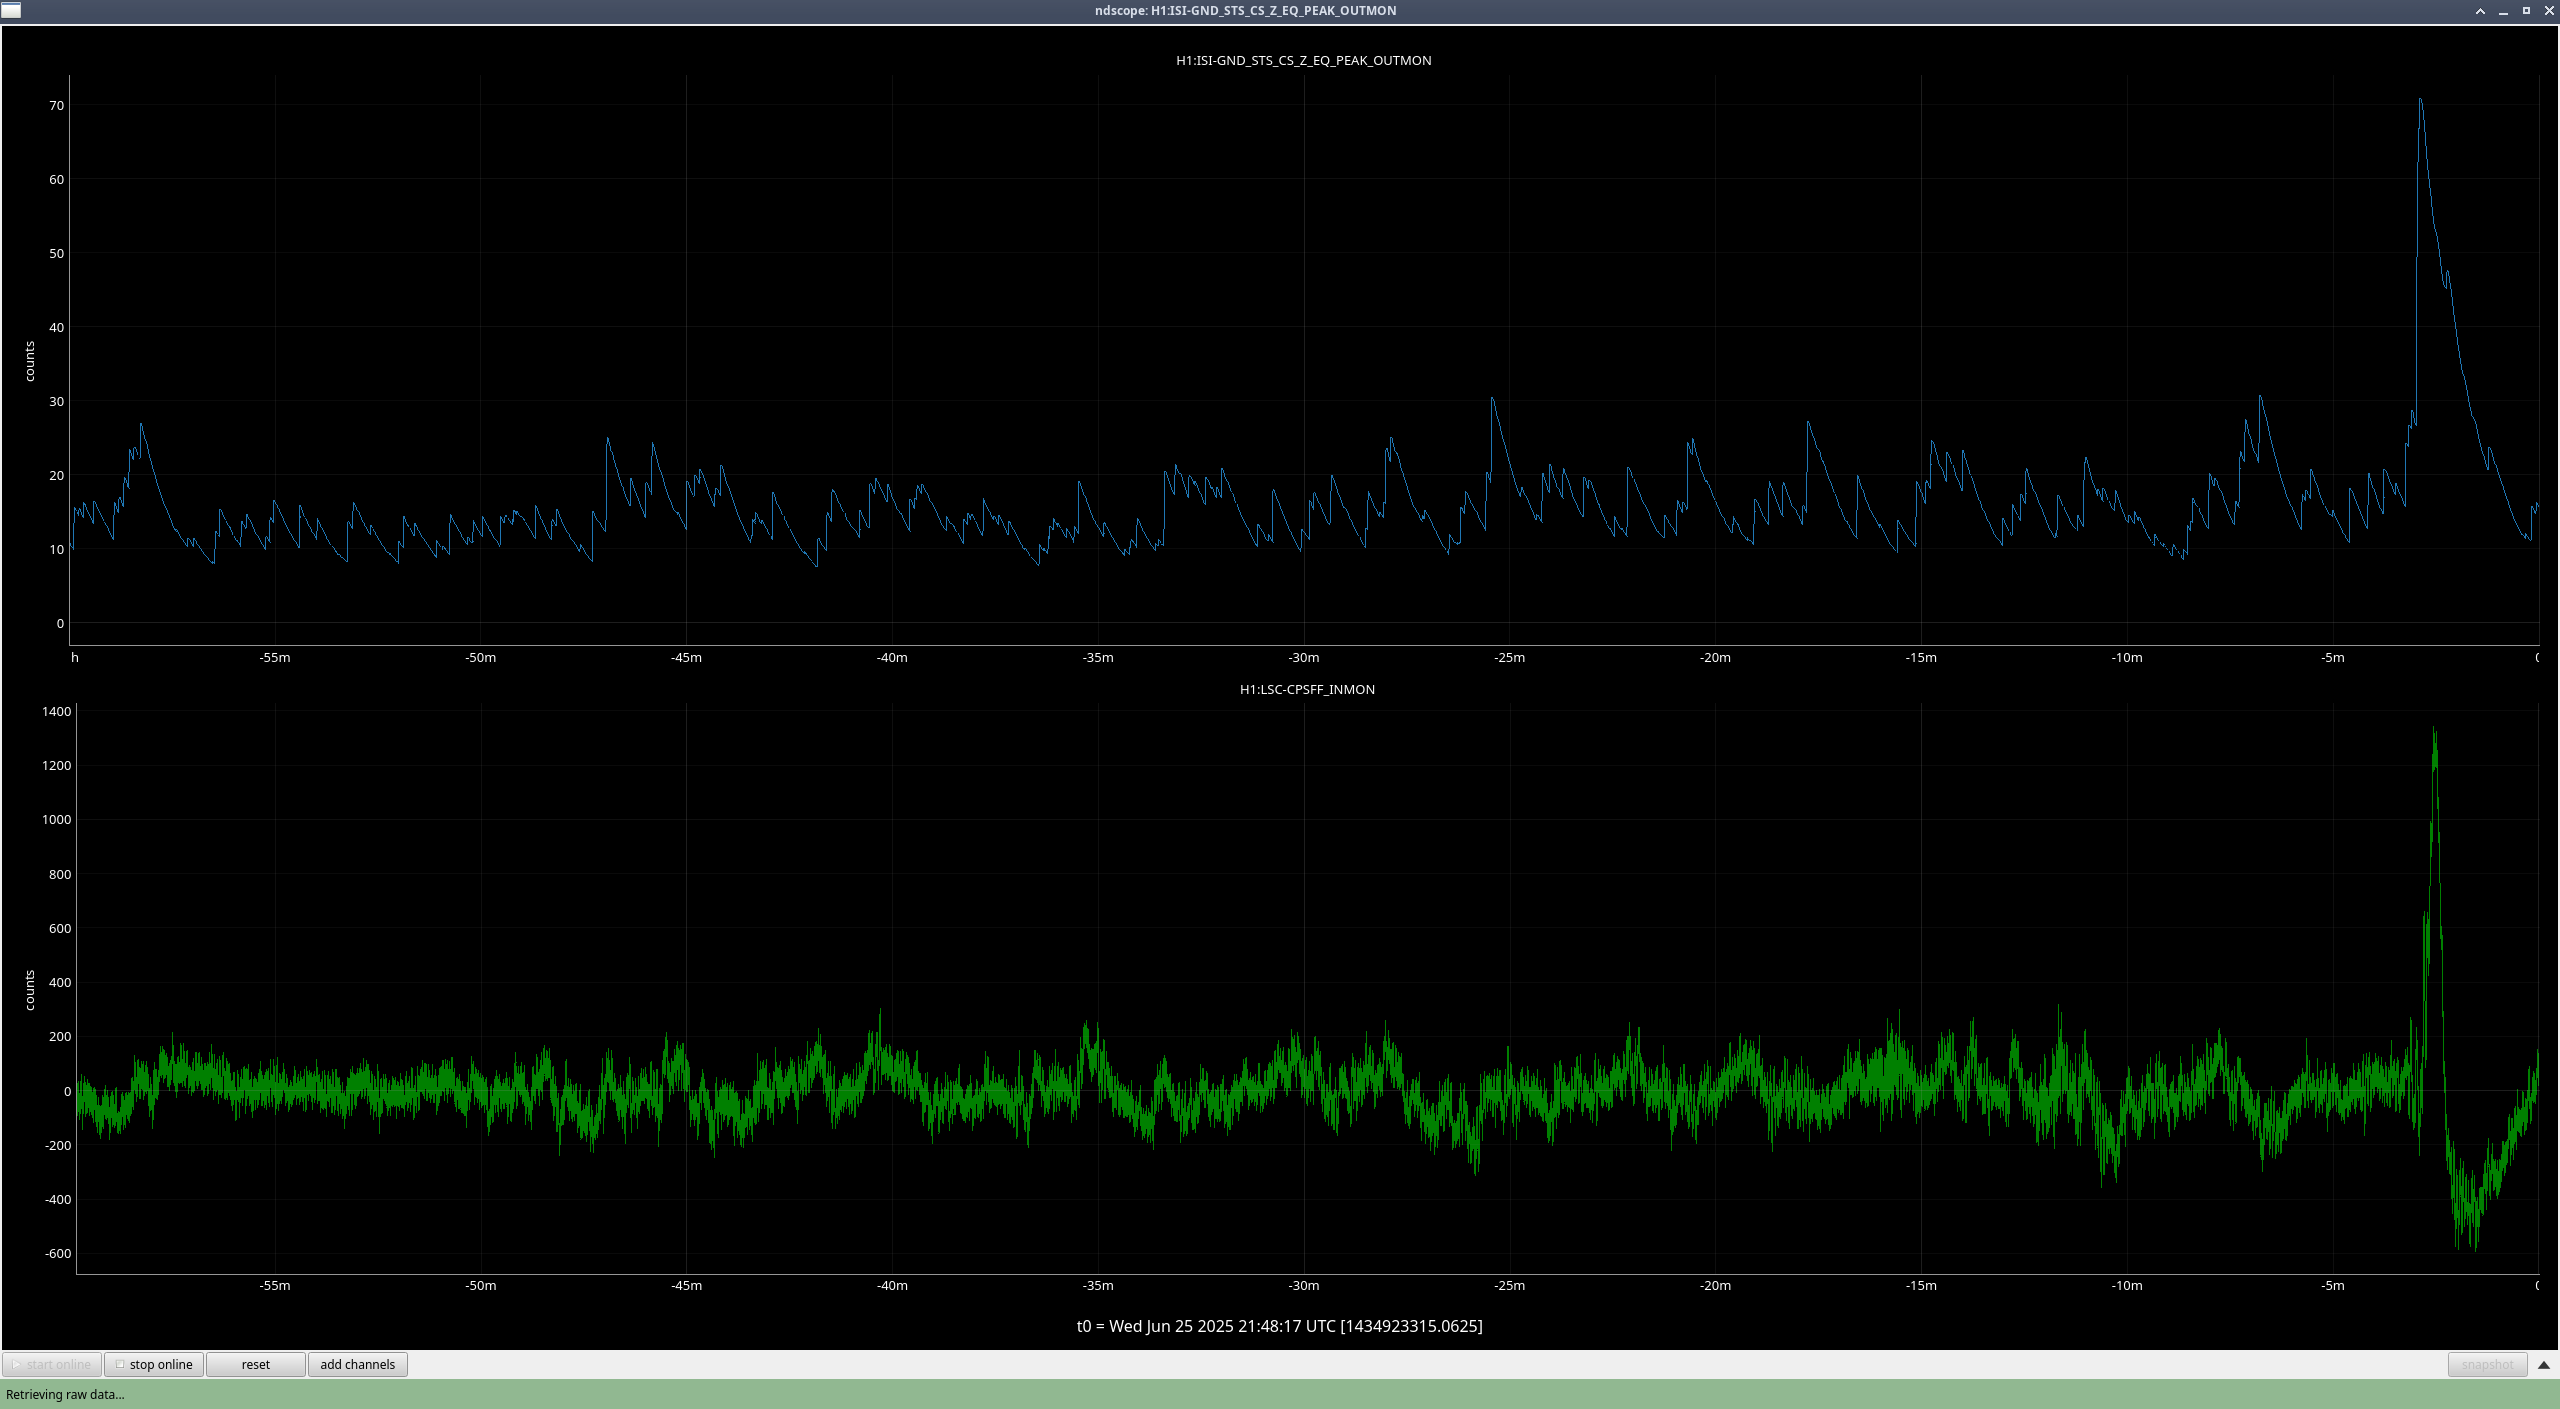
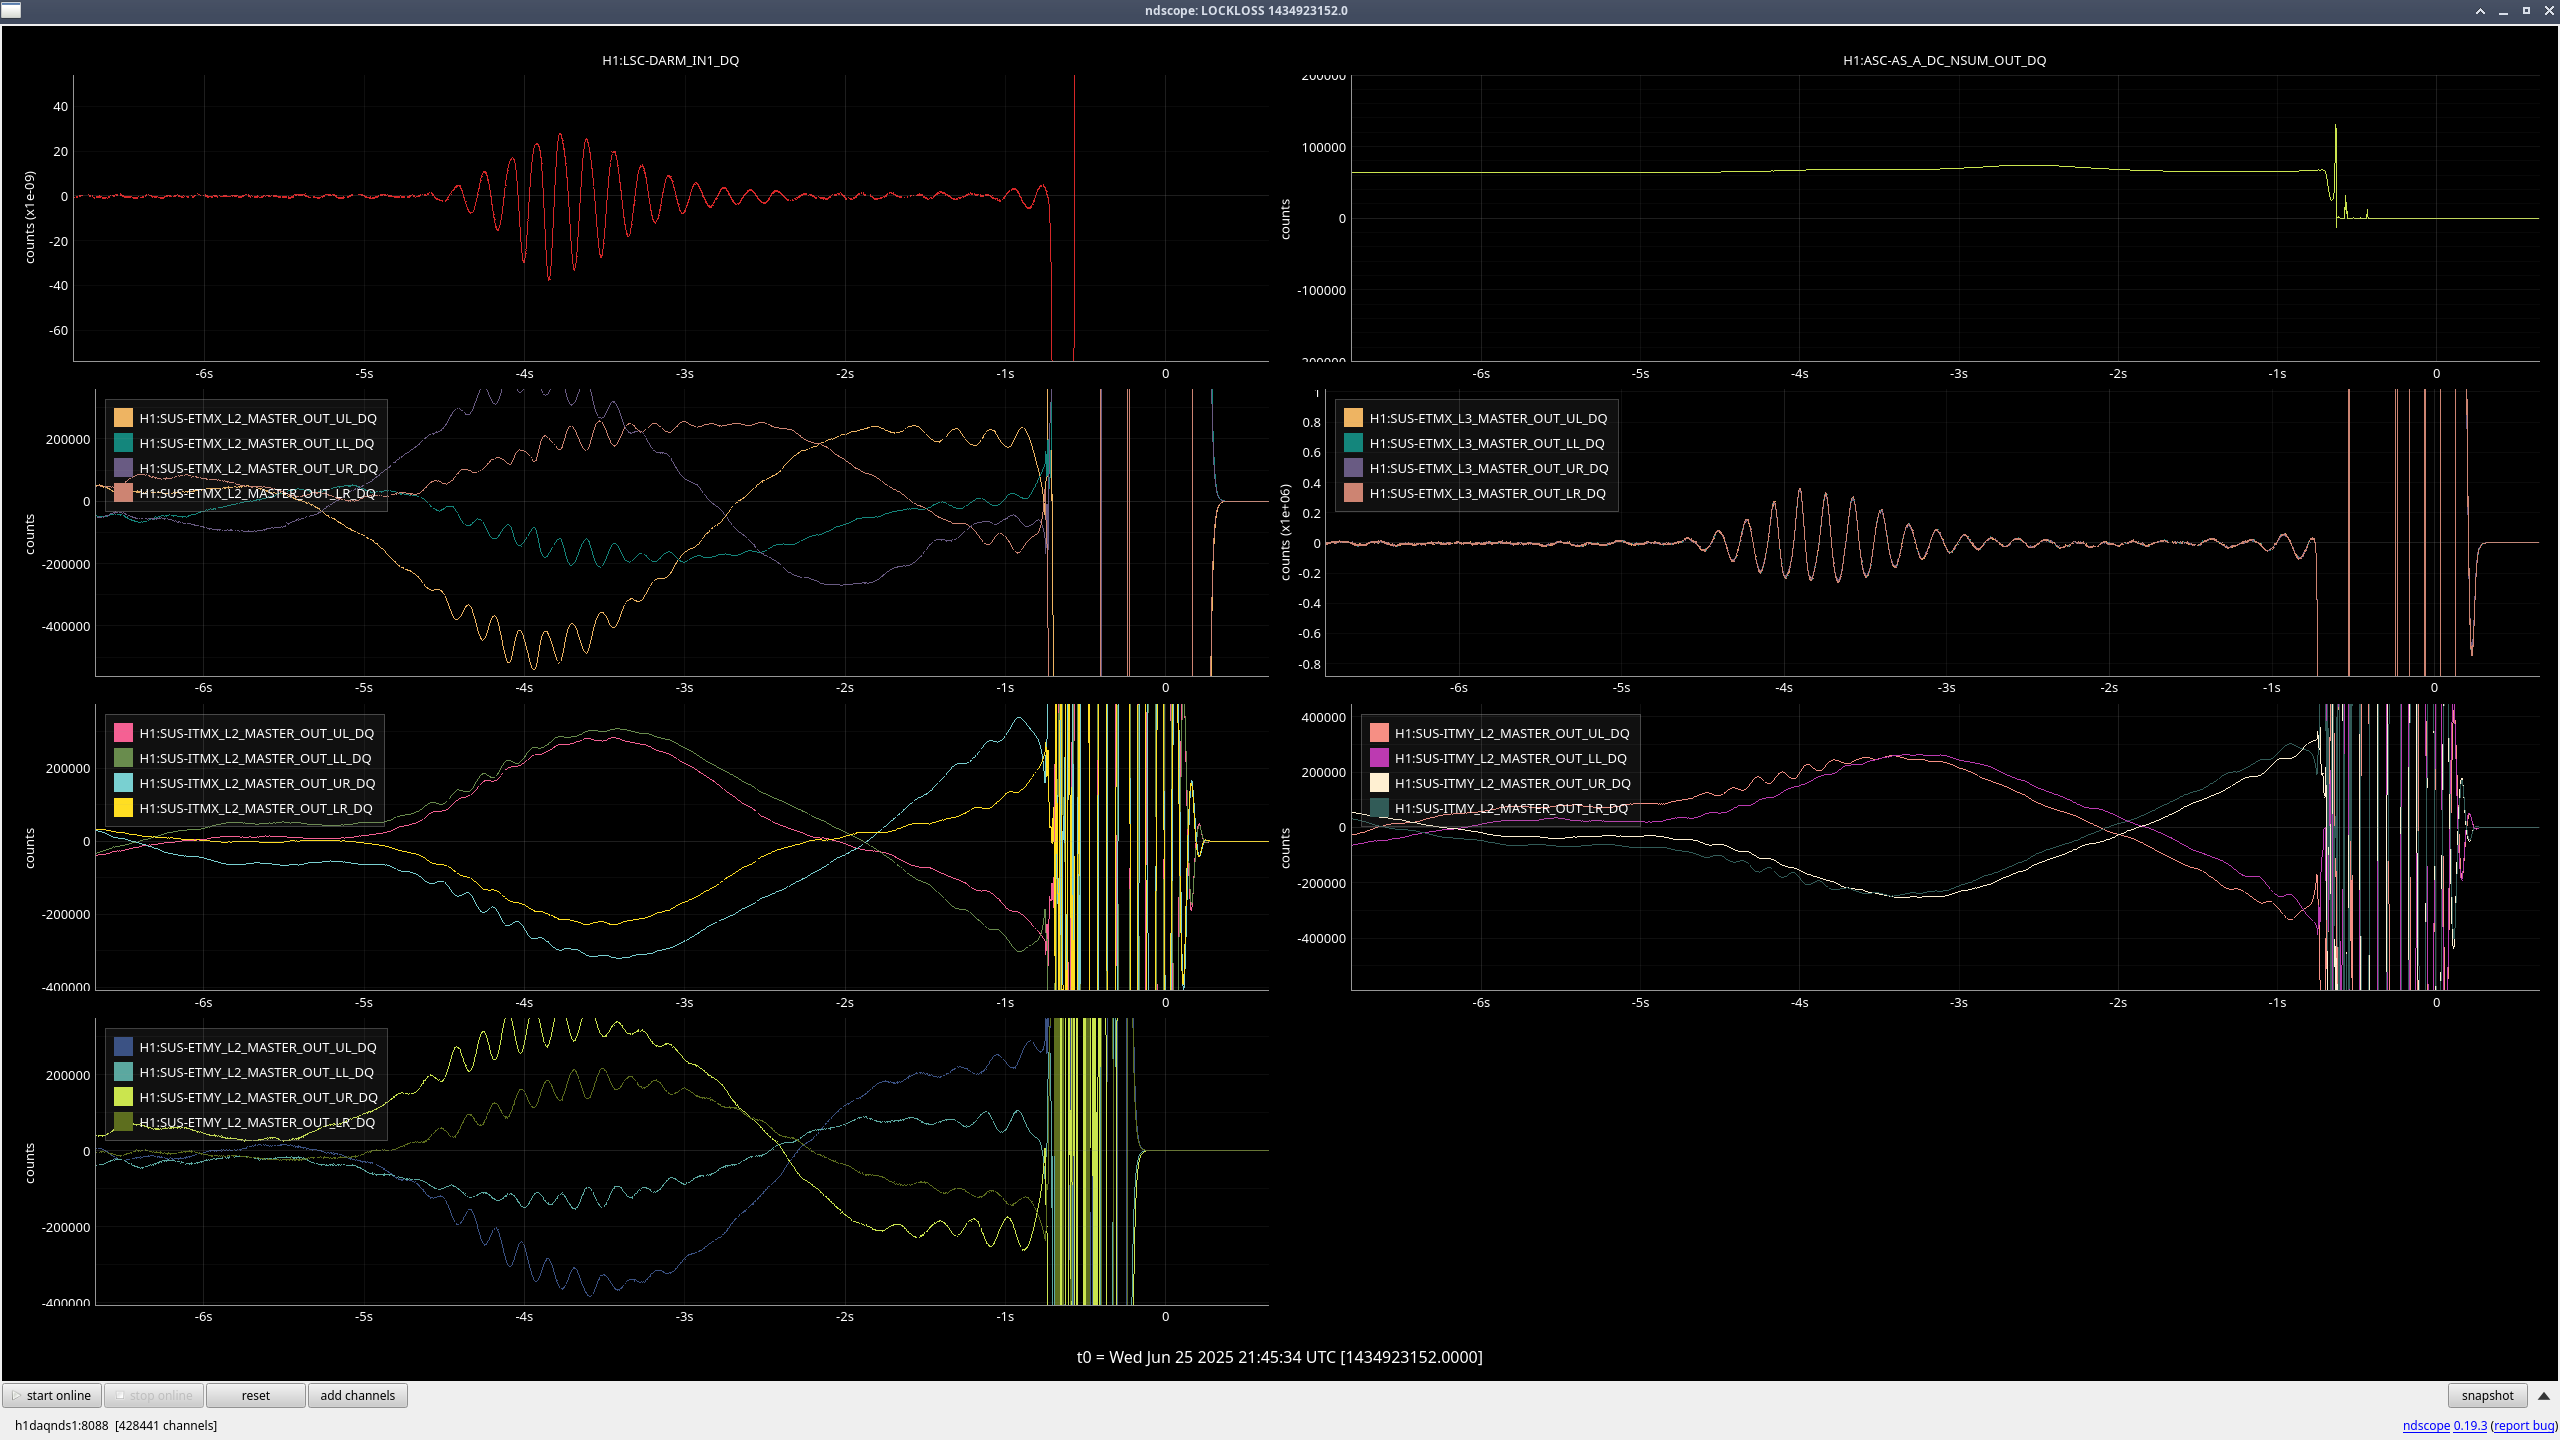
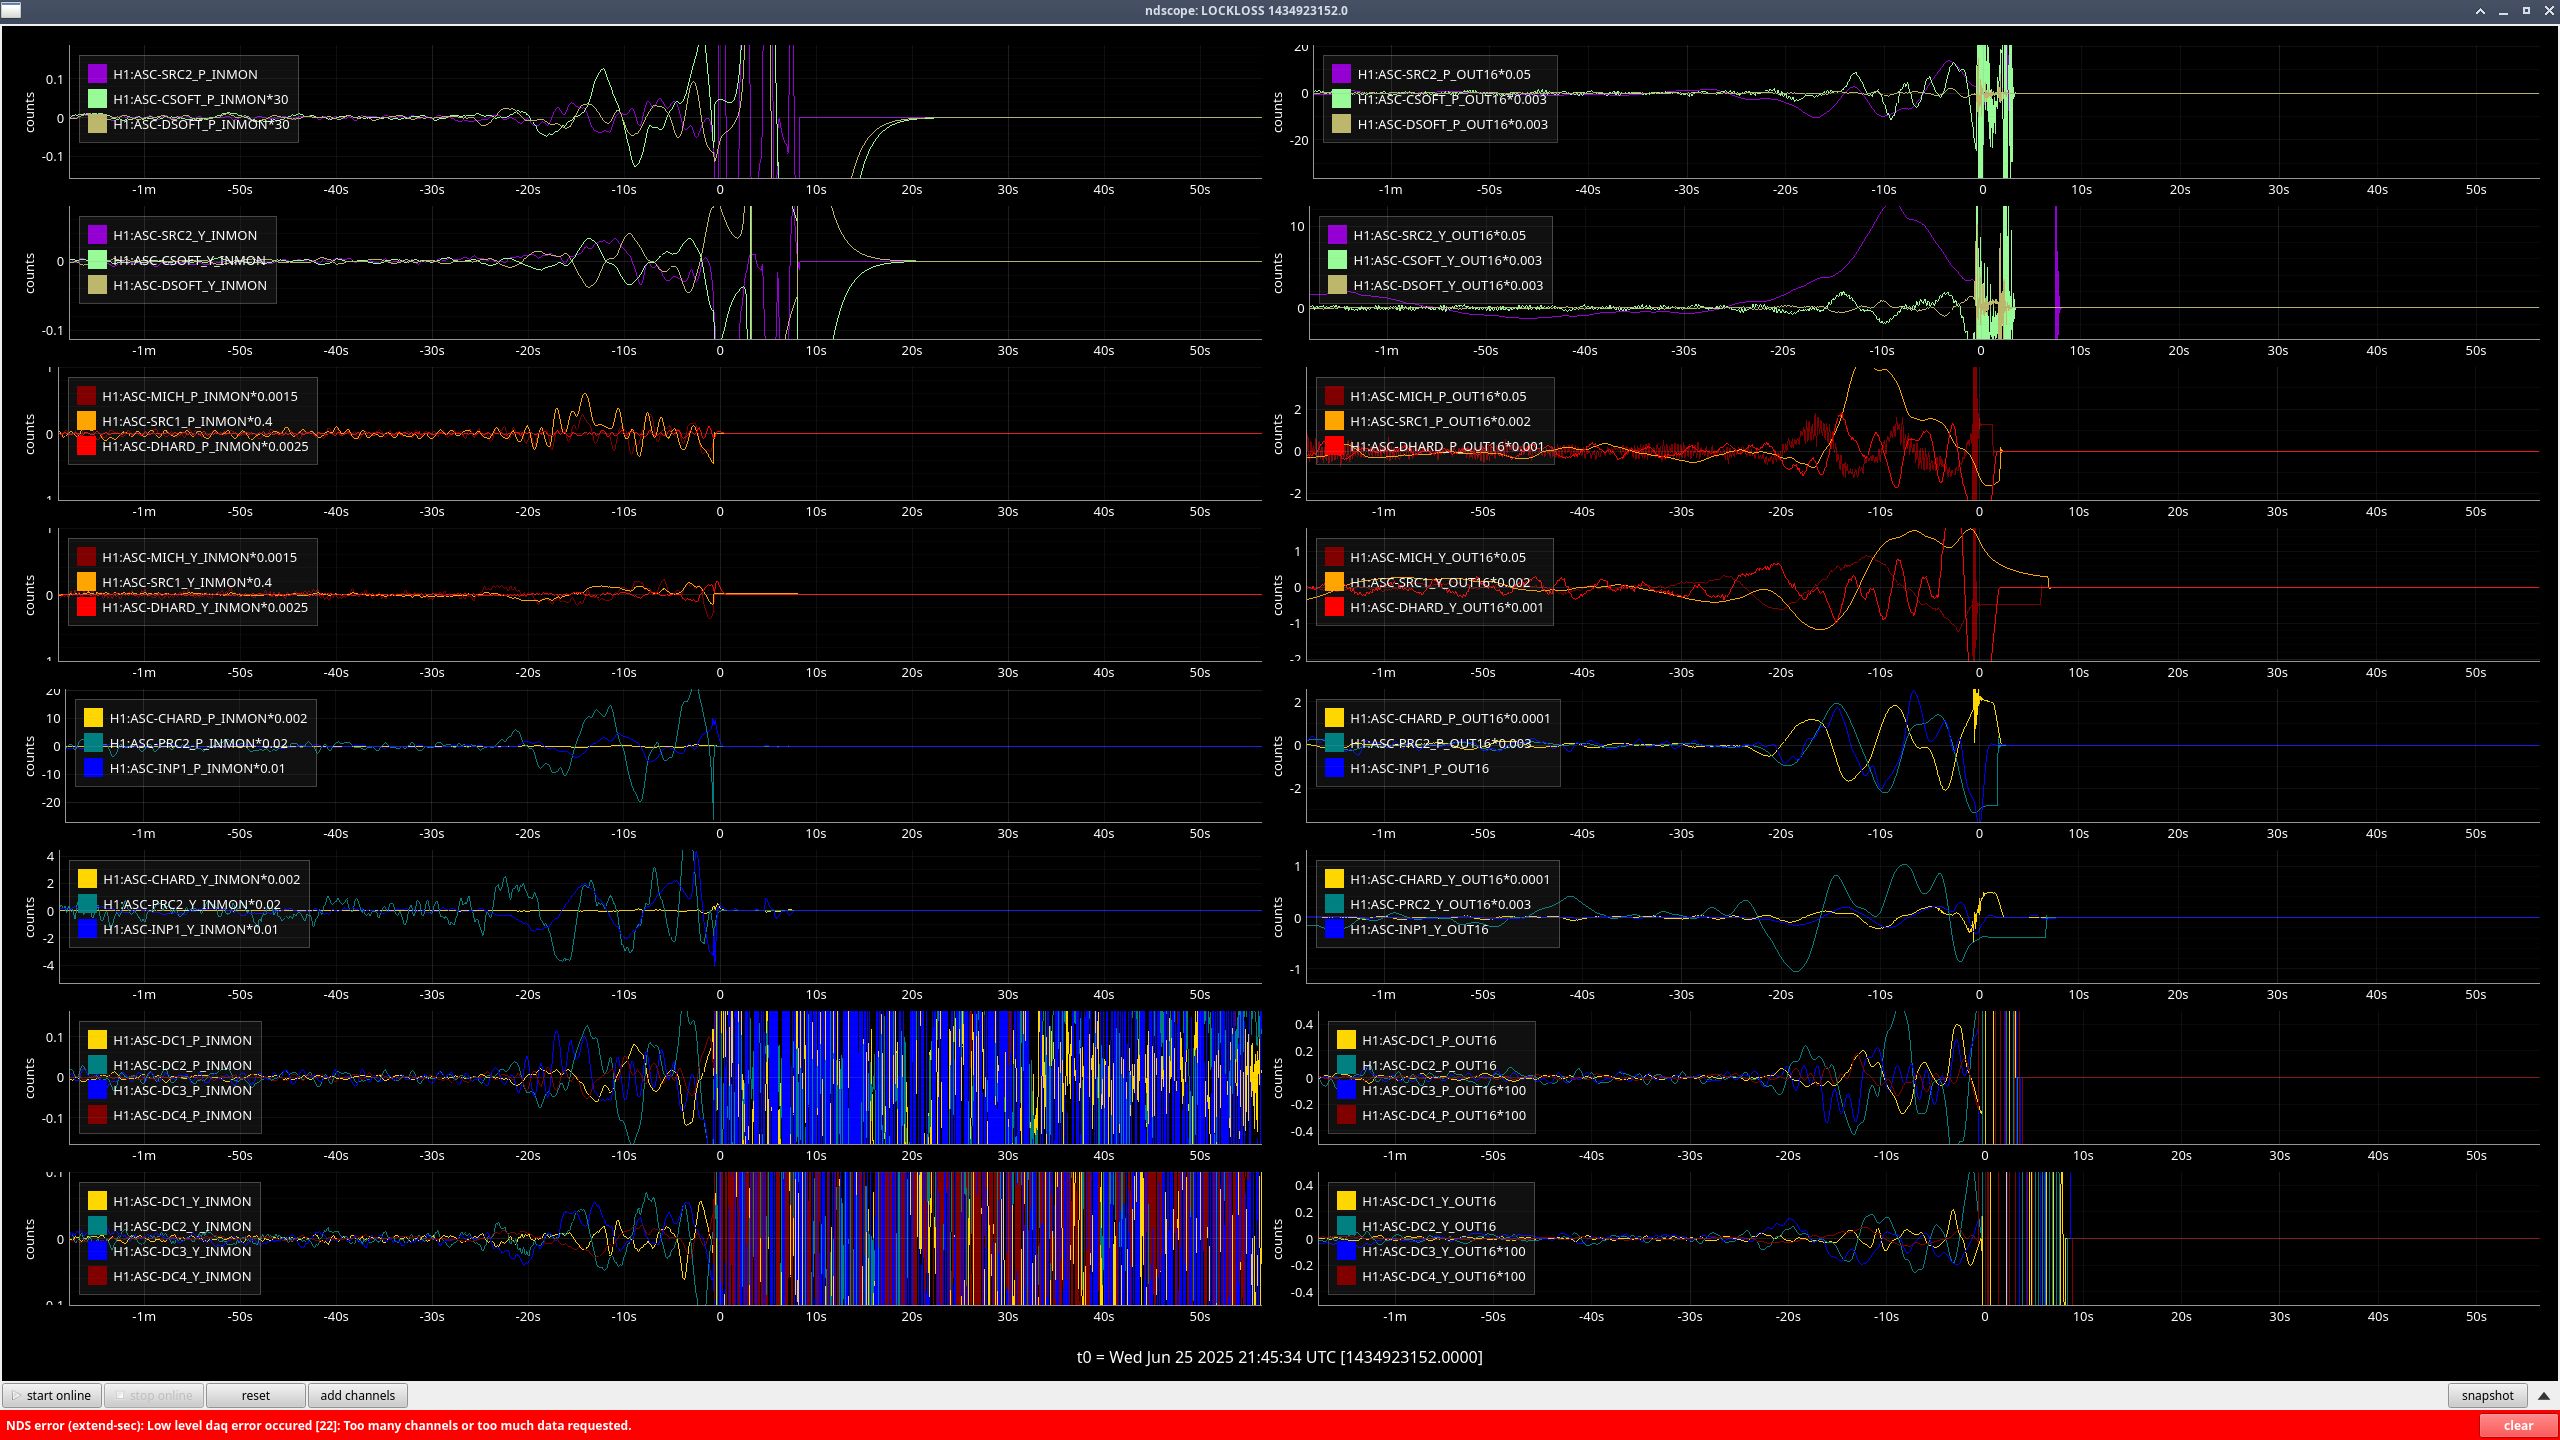
Lockloss at 2025-06-25 21:45 UTC probably from the wind. Three seconds before the lockloss, we had an EX saturation. Wind jumped up all of a sudden, peakmon jumped up (although from very low to still pretty low but LSC CPSFF was affected), DARM had a bit oscillation, and almost all the ASC channels rang up starting 20-25 seconds before the lockloss
Ryan S., Elenna
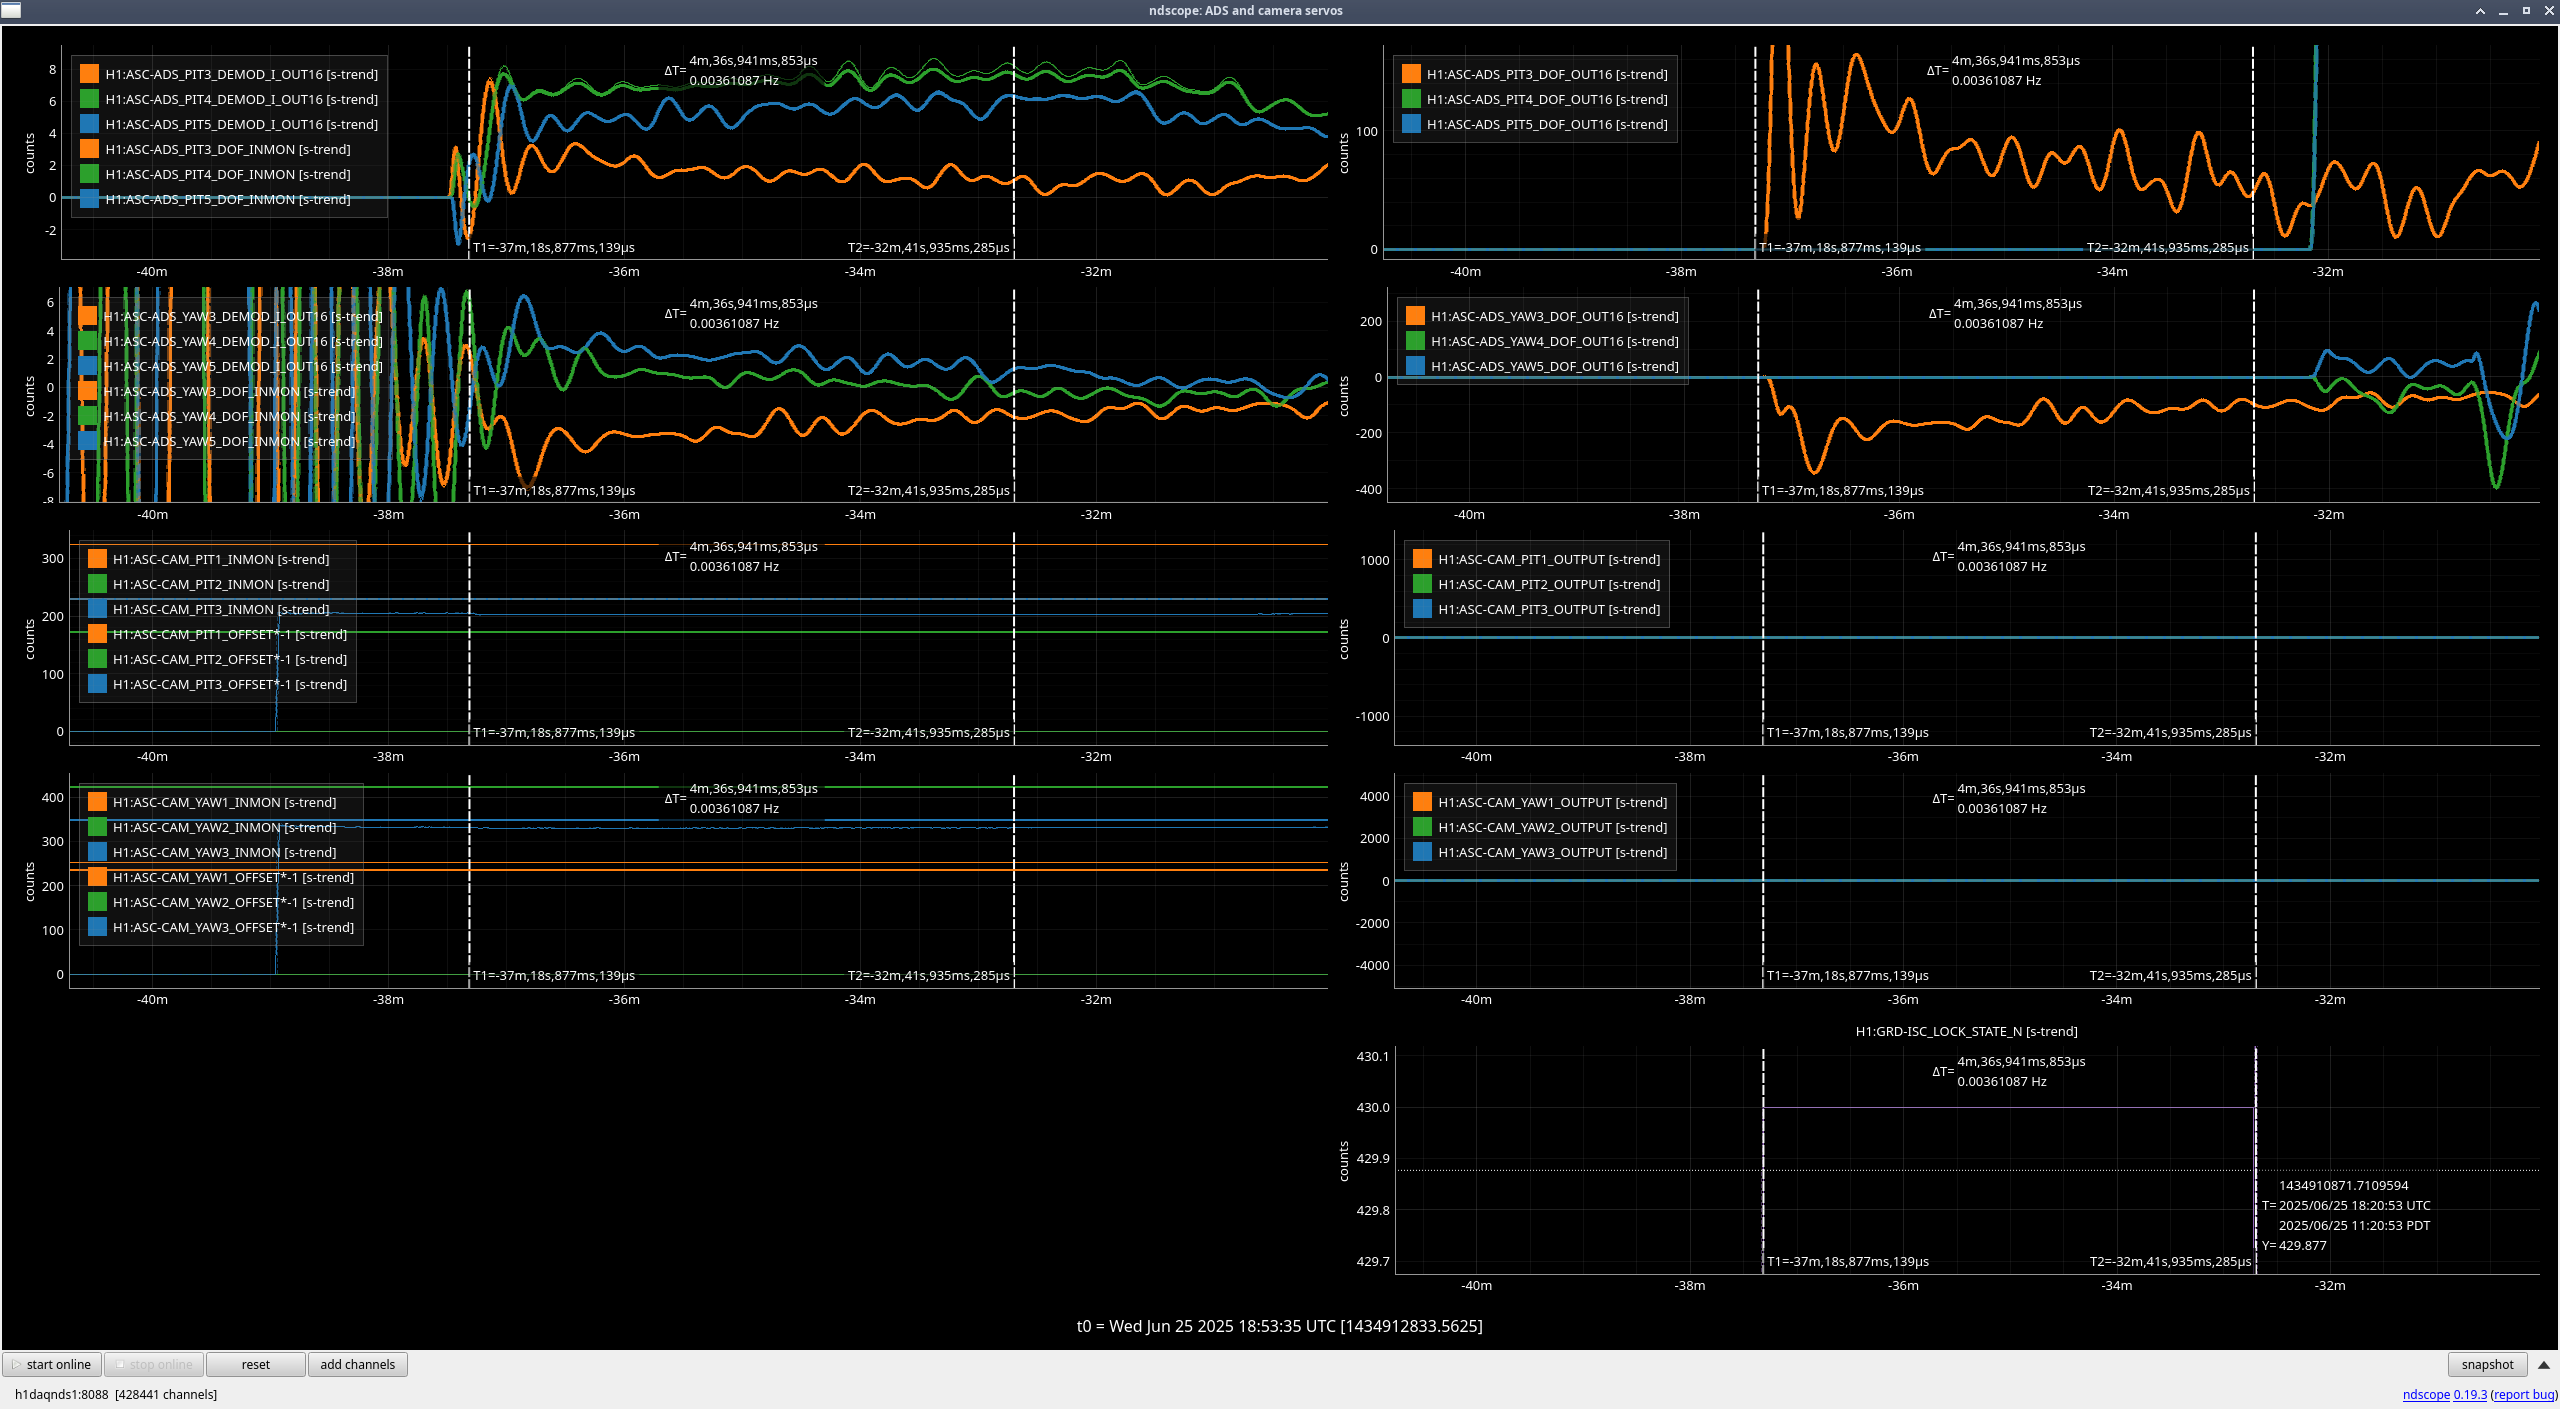
Ryan and I are still trying to speed up the MOVE_SPOTS state. Today, Ryan implemented new code that checks the convergence of the loops and only ramps up the ADS gains of loops that are not yet converged to help them converge faster. This appeared to work well, although the state is still slow. We are now taking the spots to the FINAL spots that the camera servos go to, instead of some old spot, so it's possible that which loops that are far off have changed.
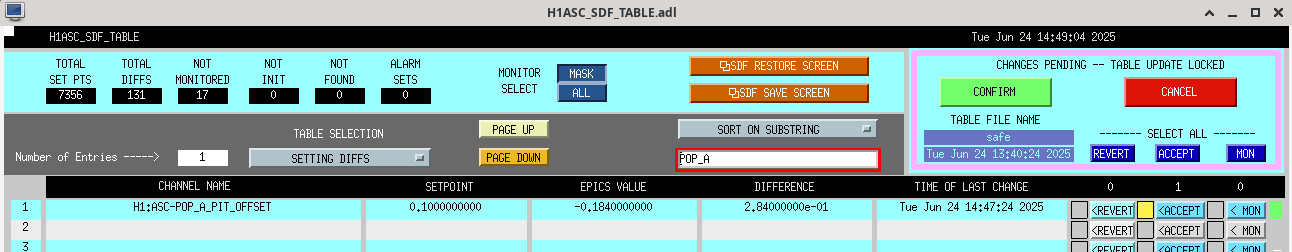
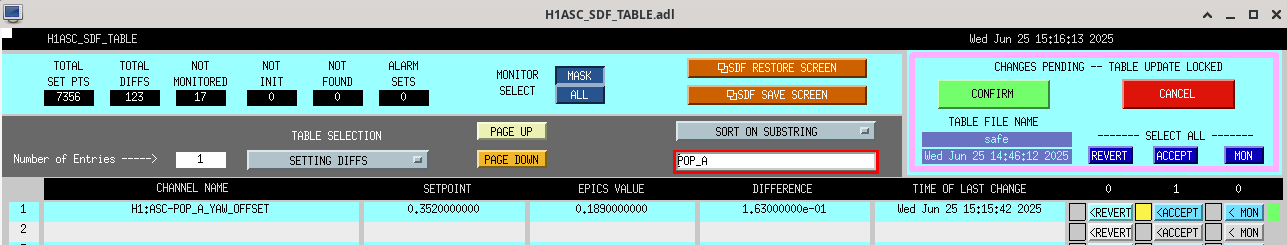
Ryan also pointed out that the ENGAGE_ASC_FOR_FULL_IFO state is taking a while because it is limited by the convergence of the PIT3 ADS. This is likely because the POP A offset used in DRMI ASC is not quite right, so I adjusted it for pitch so the PRM should be closer to the full lock position. SDFed.
With regards to ENGAGE_ASC_FOR_FULL_IFO, the three locks that we've had after the adjustment made yesterday have made the state take an average of 4.5 minutes to get through. Before making this change, it was taking us an average of 8.5 minutes (looking at the four locks before this change), so this has made a big improvement for this state!
However, it looks like the main reason why this state still takes a pretty long time compared to most other states is because it's still needing to wait a long time for the PIT3 and YAW3 ADS to converge (ndscope). Here's the log from this last time that we went through ENGAGE_ASC and you can see that most of the time is waiting for ADS. The actual wait timers in there are only 50 seconds of waiting, so the rest of the wait timers (the one second timers) are just from the convergence checker.
I updated the POP A yaw offset so that PRC1 in DRMI will bring the PRM closer to the full lock point and hopefully make convergence in this state faster.
Ansel, Sheila, Camilla
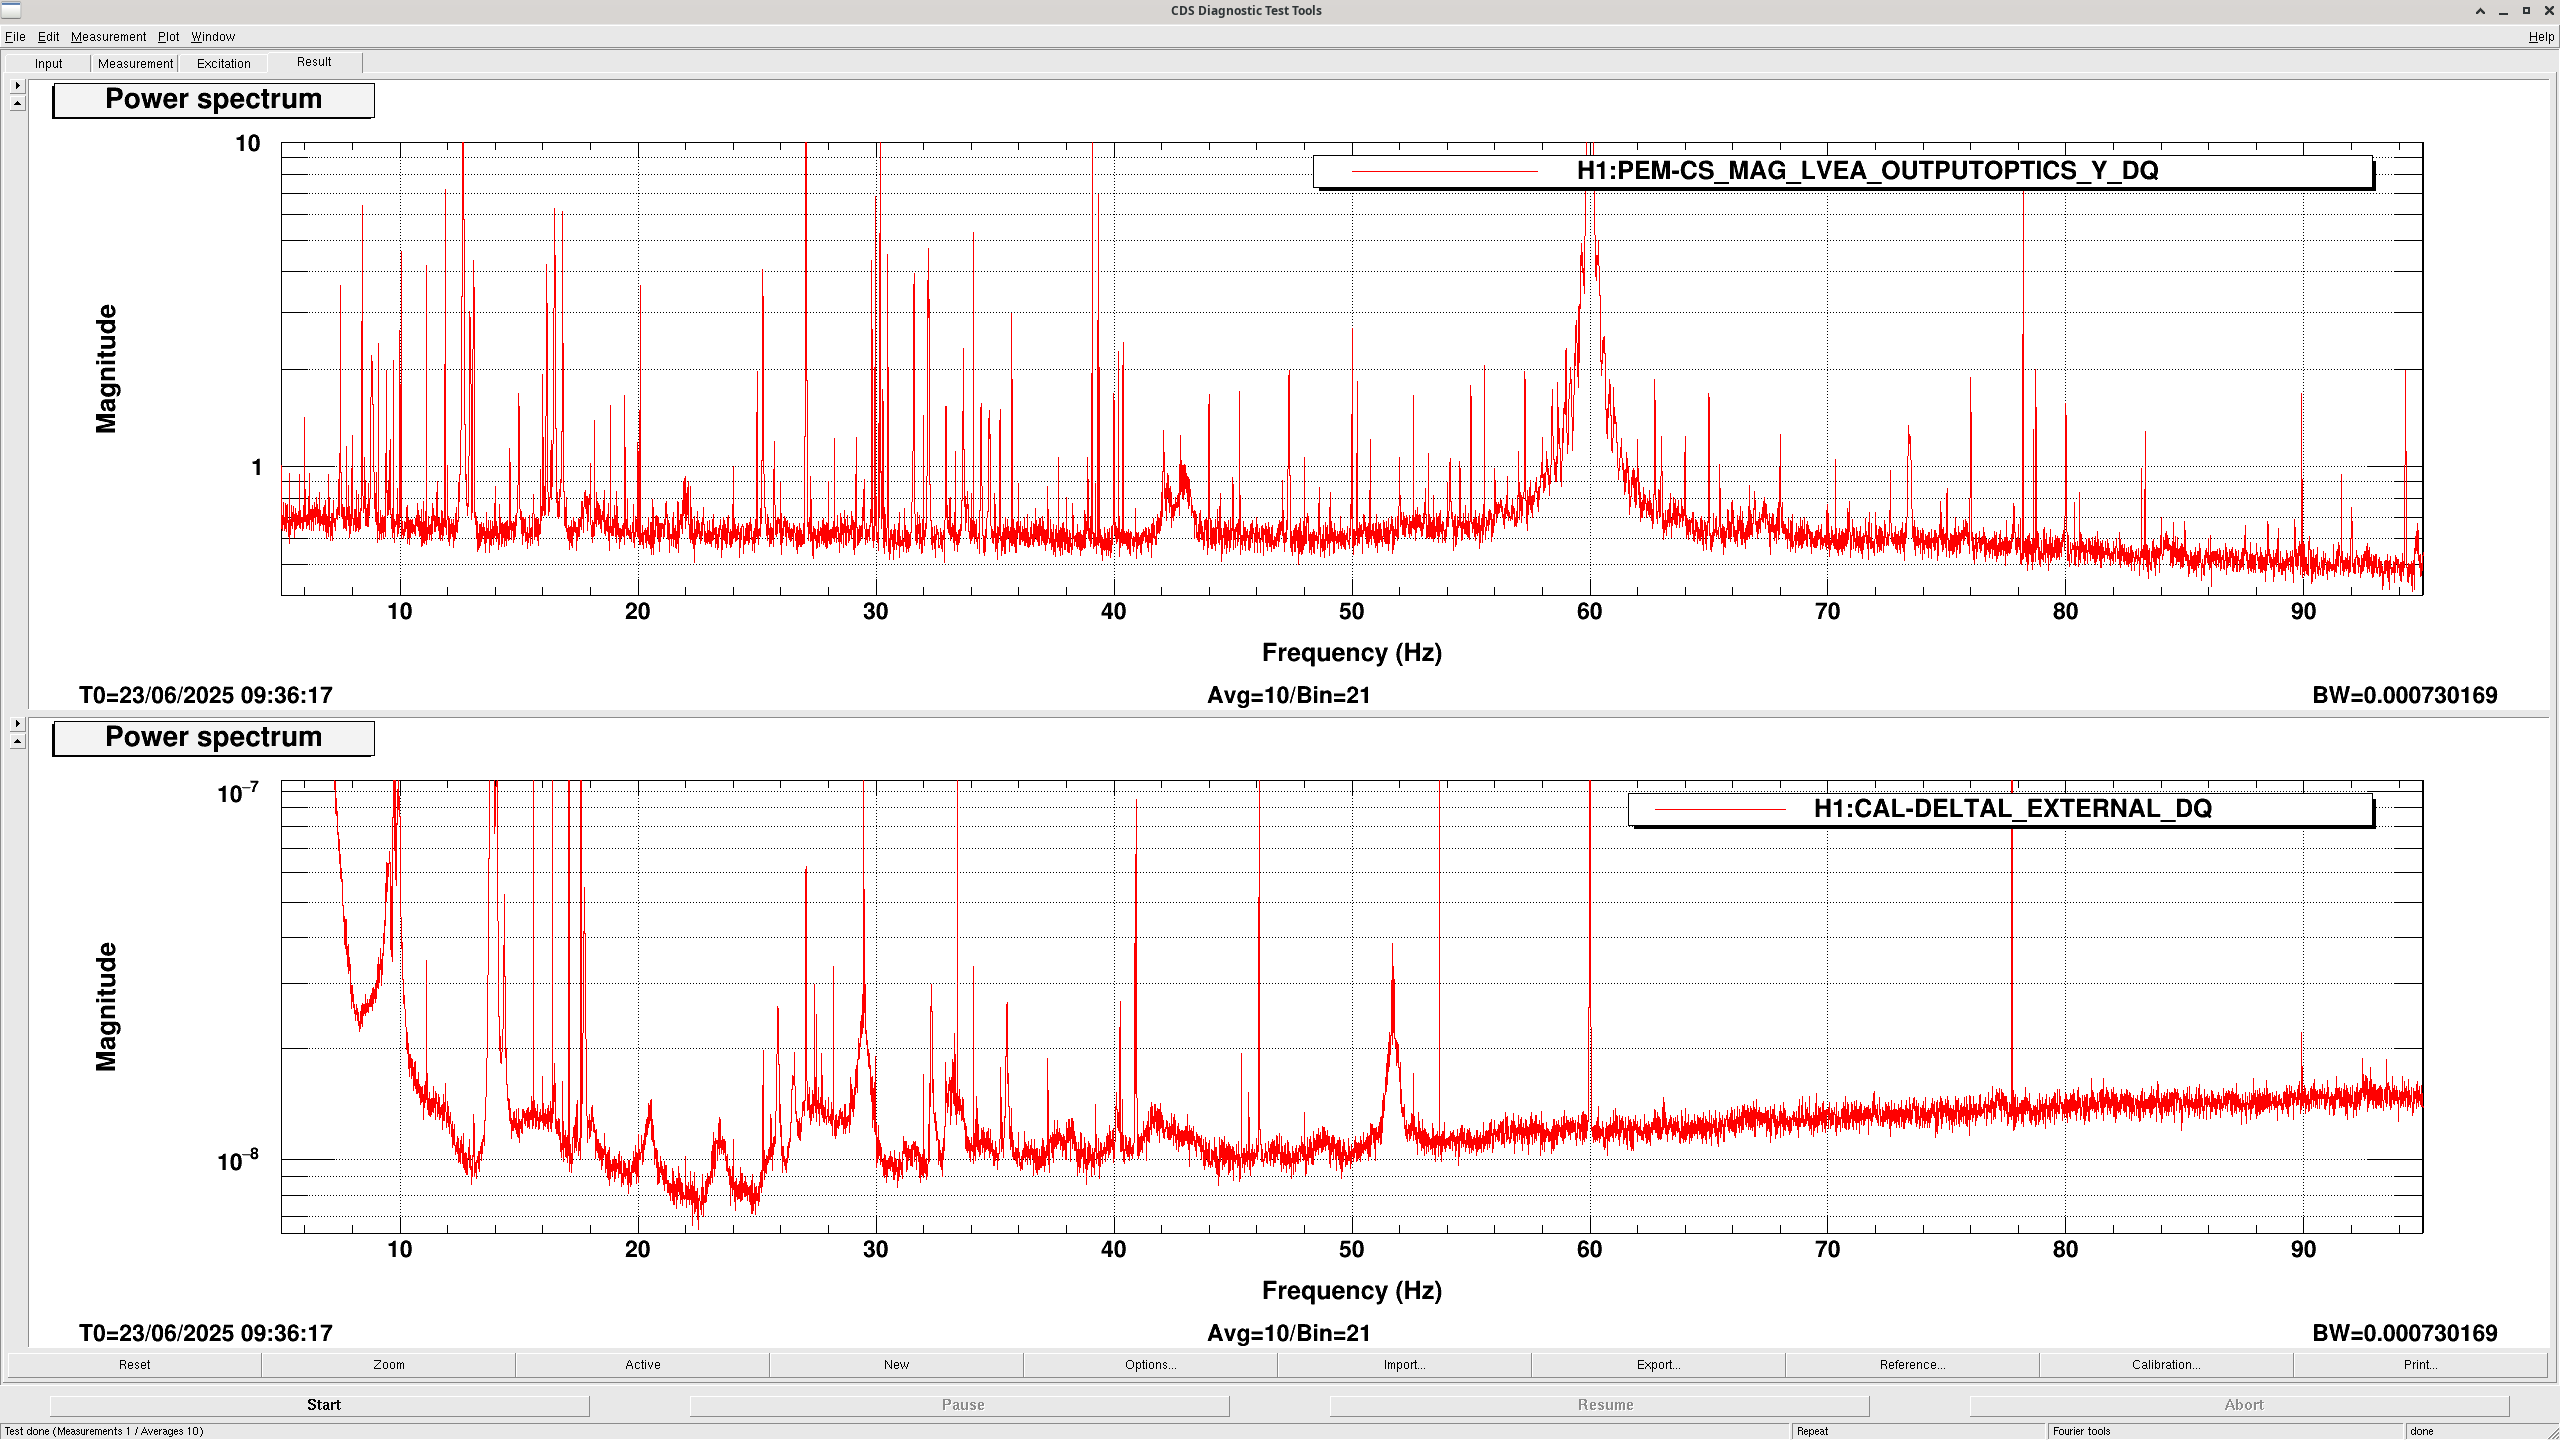
Last week, Ansel noticed that there is a 2Hz comb in DARM since the break, similar to that that we've seen from the HWS camera sync frequency and power supplies and fixed in 75876. The cabling has not been changed since, the camera sync frequency has been changed.
Our current camera sync frequencies are: ITMX = 2Hz, ITMY = 10Hz. We have typically seen these combs in H1:PEM-CS_MAG_LVEA_OUTPUTOPTICS_Y_DQ. With a 0.0005Hz BW on DTT I can't easily see these combs, see attached.
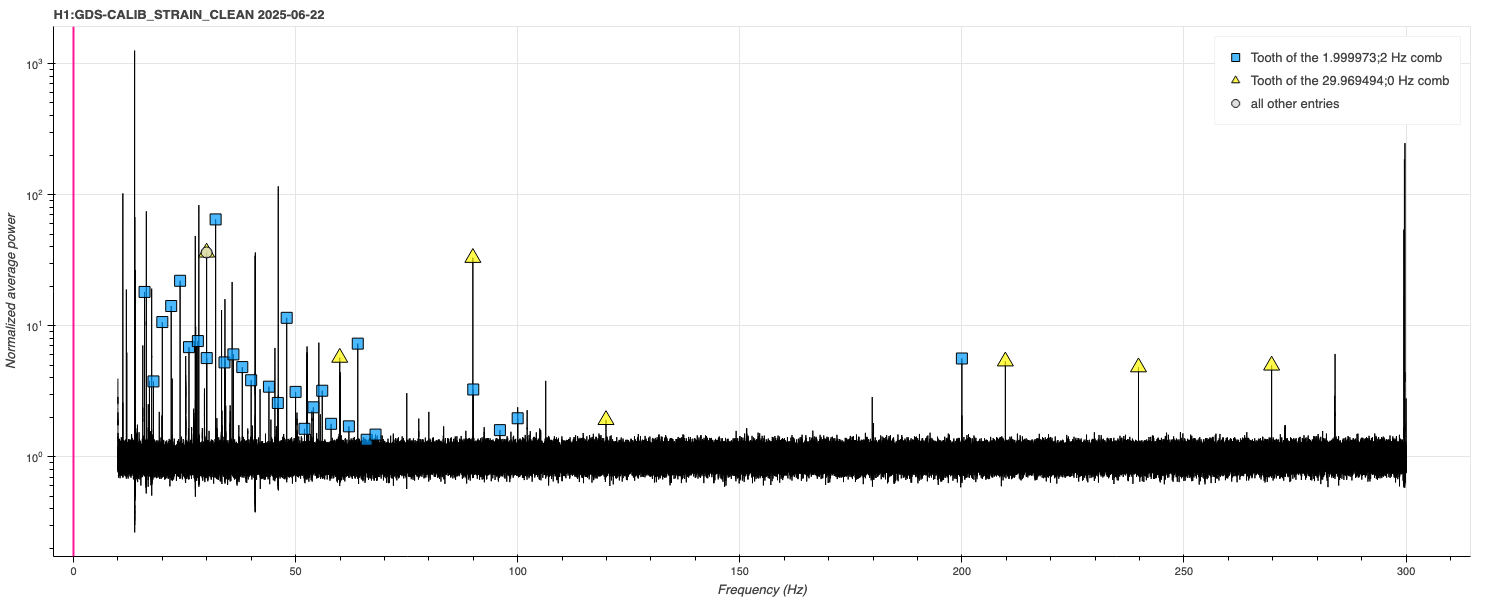
It may be difficult to see in a standard spectrum, but can be clearly seen in Fscan plots linked off of the summary pages. For the "observing" Fscan, the interactive spectrum plot shows the 2 Hz comb marked automatically. See the attached image of H1:GDS-CALIB_STRAIN_CLEAN
Verifed that the cabling has not changed since 75876.
Next steps we should follow, as listed in 75876 would be to try using a different power supply or lowering the voltage to +12V. Or, there is a note suggesting Fil could make a new cable to power both the camera and CLink's via the external supply (14V is fine for both).
Thanks Camilla. If anything can be done more rapidly than waiting another week, it would be very much appreciated. Continuing to collect contaminated data is bad for CW searches.
Matt and I turned down the Voltage supplied from 14V to 12V for each camera at ~22:00UTC when the IFO was relocking. Verified HWS cameras and code still running.
We also will plan to have Dave reimpliemnt the hws_camera_control.py script he wrote in 74951 to turn the HWS's off in Observing until we fix this issue.
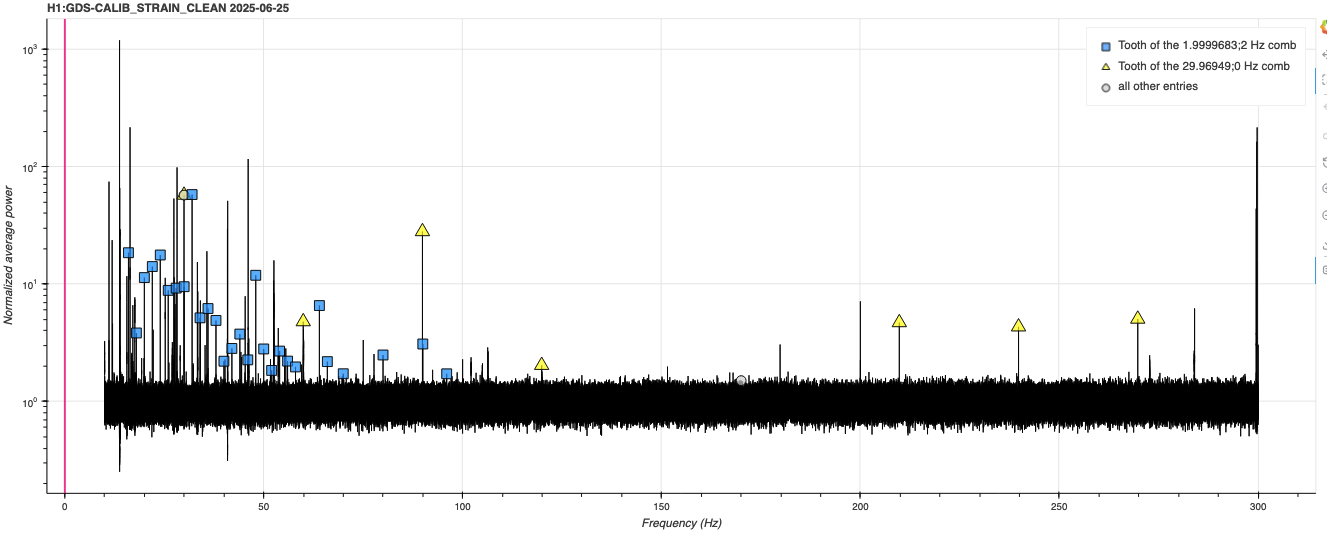
The 2 Hz comb is still present in H1:GDS-CALIB_STRAIN_CLEAN after the voltage change (before the software update)
alog 85678 showed this 2Hz comb appeared to not be the HWS camera.
I have been running opportunistic noise budget injections:
So far there seems to be no noise contribution from DC6 P and PRC2 P and Y. CHARD noise contributions are also down significantly with the ISI in place.
I ran SRCL and MICH injections today as a part of determining if the feedforward is performing well, but I repurposed those injection times in the noise budget templates so now SRCL and MICH are complete as well.
After running some PRCL injections to test the feedforward I was also able to update the PRCL noise budget template.
I also reran the jitter noise coupling measurement, since it seemed like the coupling was overestimated at low frequency. The jitter noise had been run very early on in vent recovery, so I am not sure what changed to affect the low frequency coupling (could be the pumps, LSC feedforward, ASC, etc) but now the low frequency coupling is very reduced.
Sheila, Elenna, Camilla
Sheila was questioning if something is drifting for us to need an initial alignment after the majority of relocks. Elenna and I noticed that BS PIT moves a lot both while powering up /moving spots and while in NLN. Unsure from the BS alignment inputs plot what's causing this.
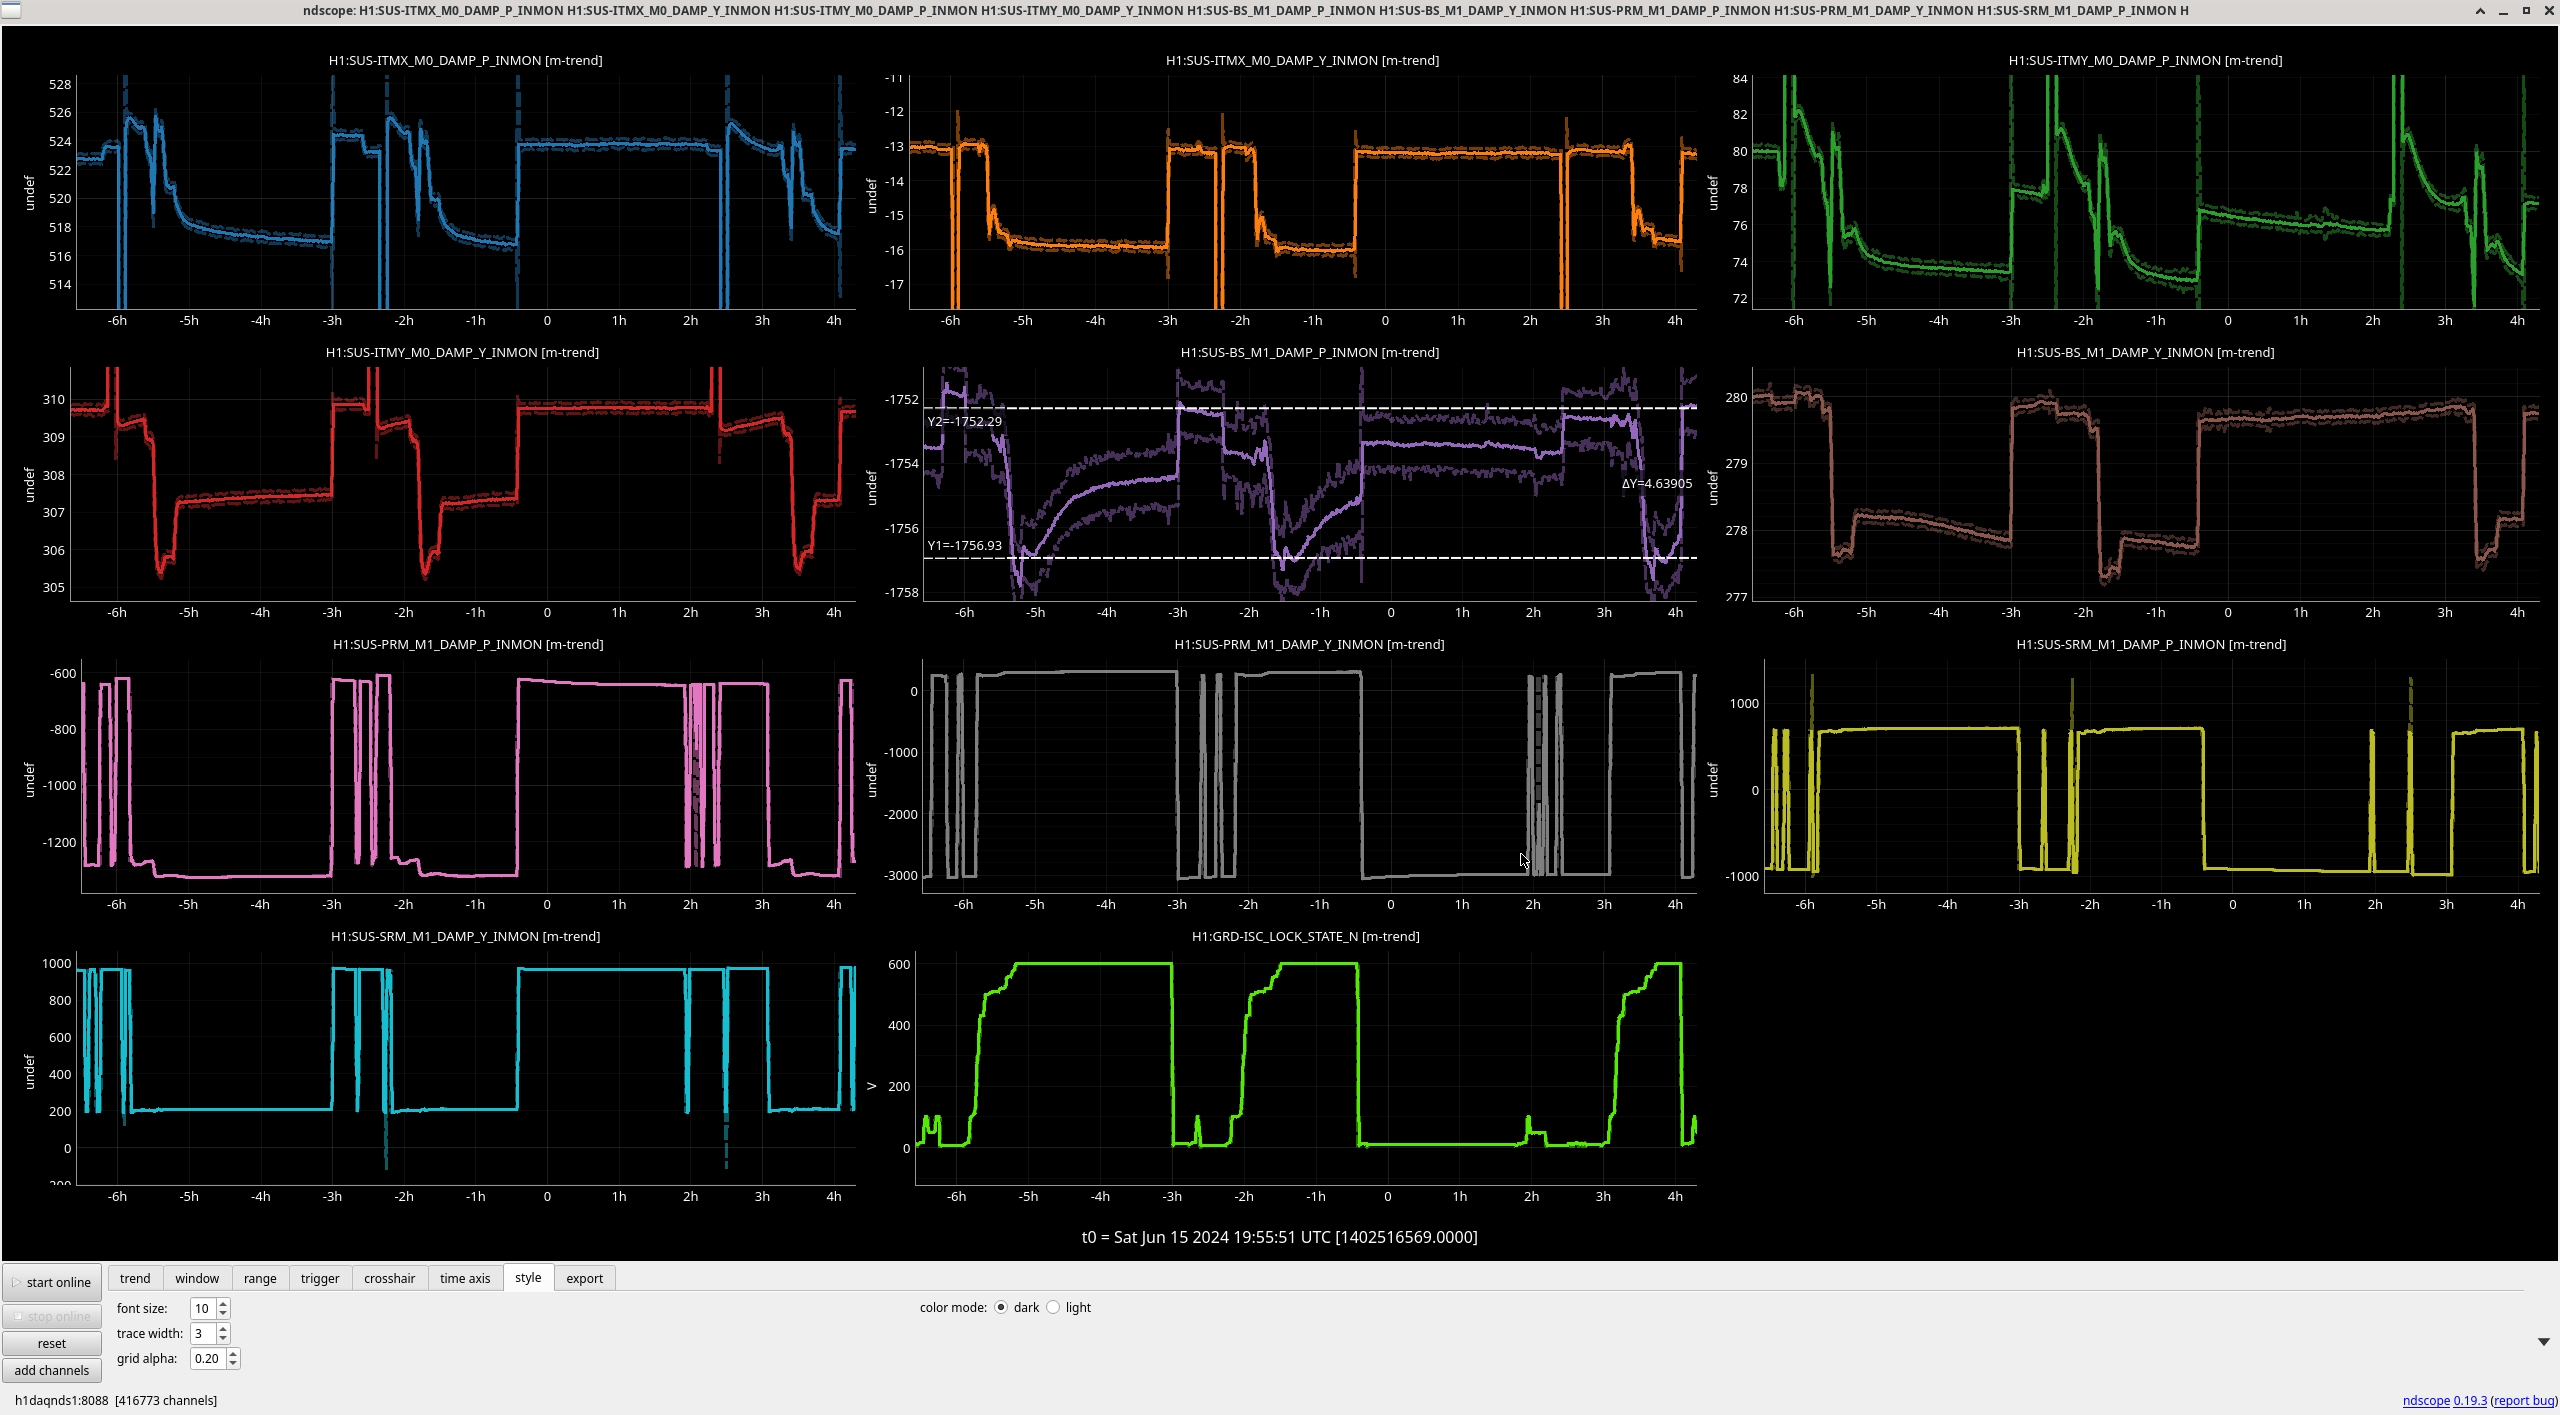
This was also happening before the break (see below) but the operators were similarly needing more regular initial alignments before the break too. 1 year ago this was not happening, plot.
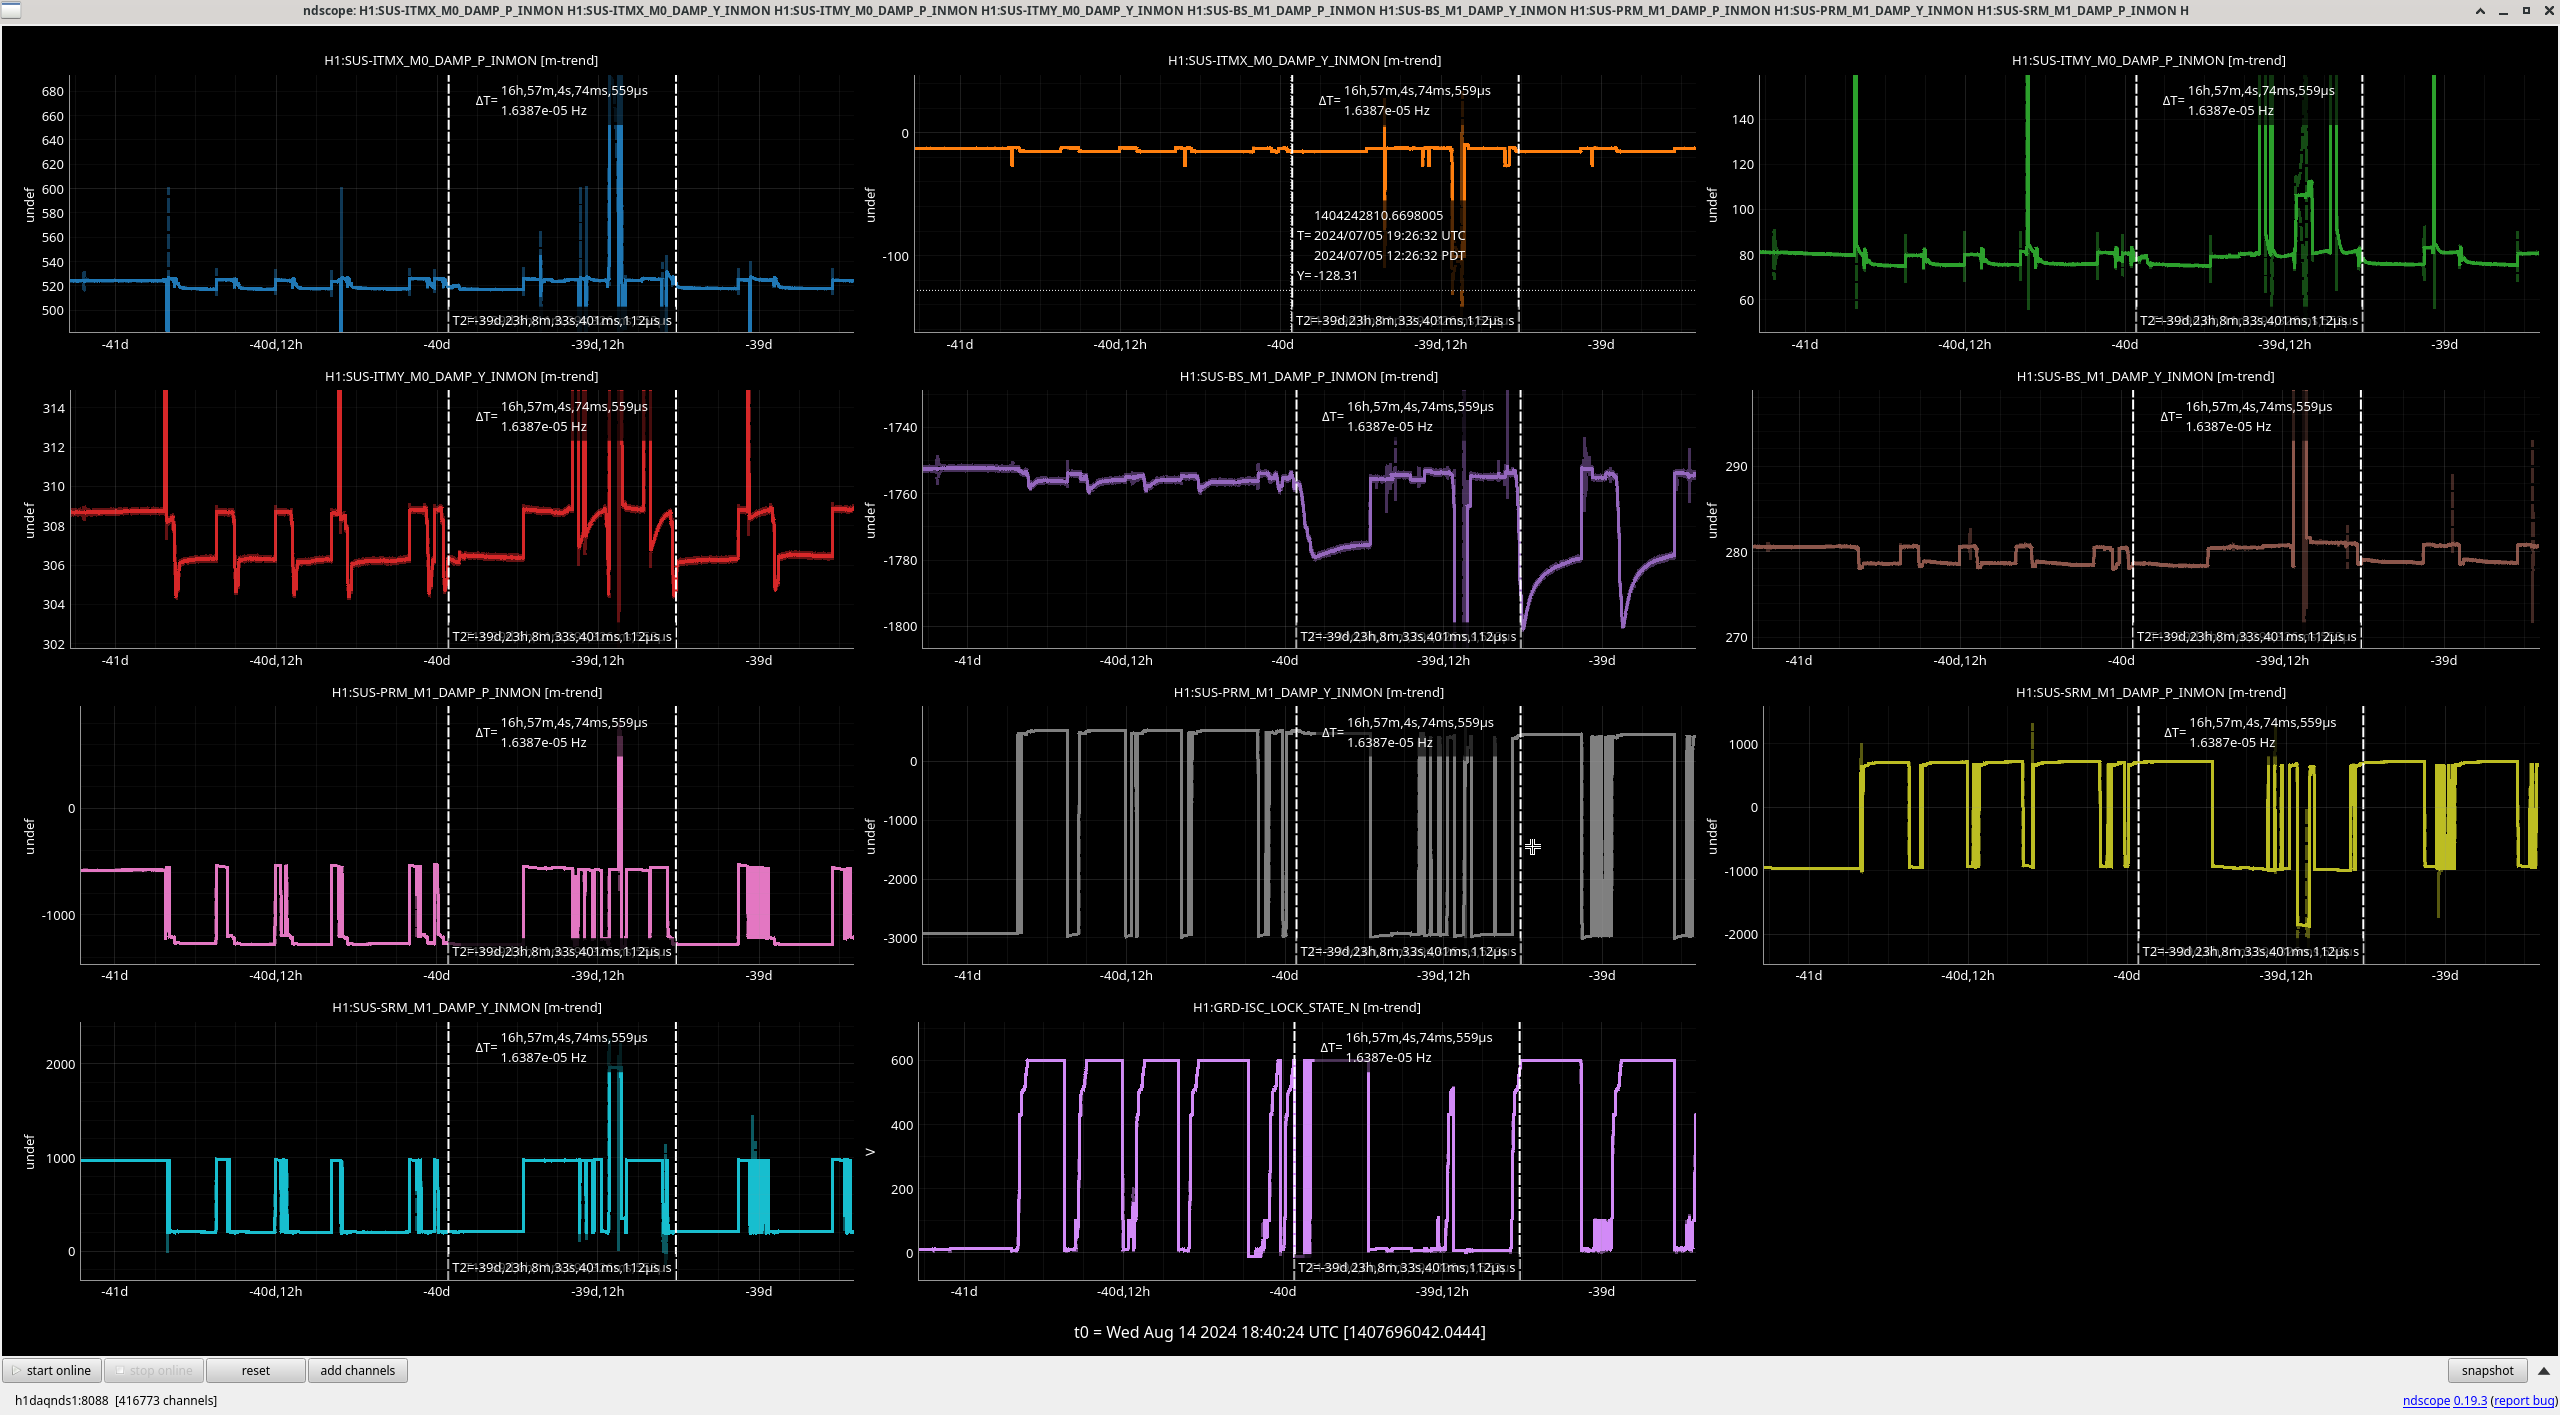
These large BS PIT changes began 5th to 6th July 2024 (plot). This is the day shift from the time that the first lock like this happened 5th July 2024 19:26UTC (12:26PT): 78877 at the time we were doing PR2 spot moves. There also was a SUS computer restart 78892 but that appeared to be a day after this started happening.
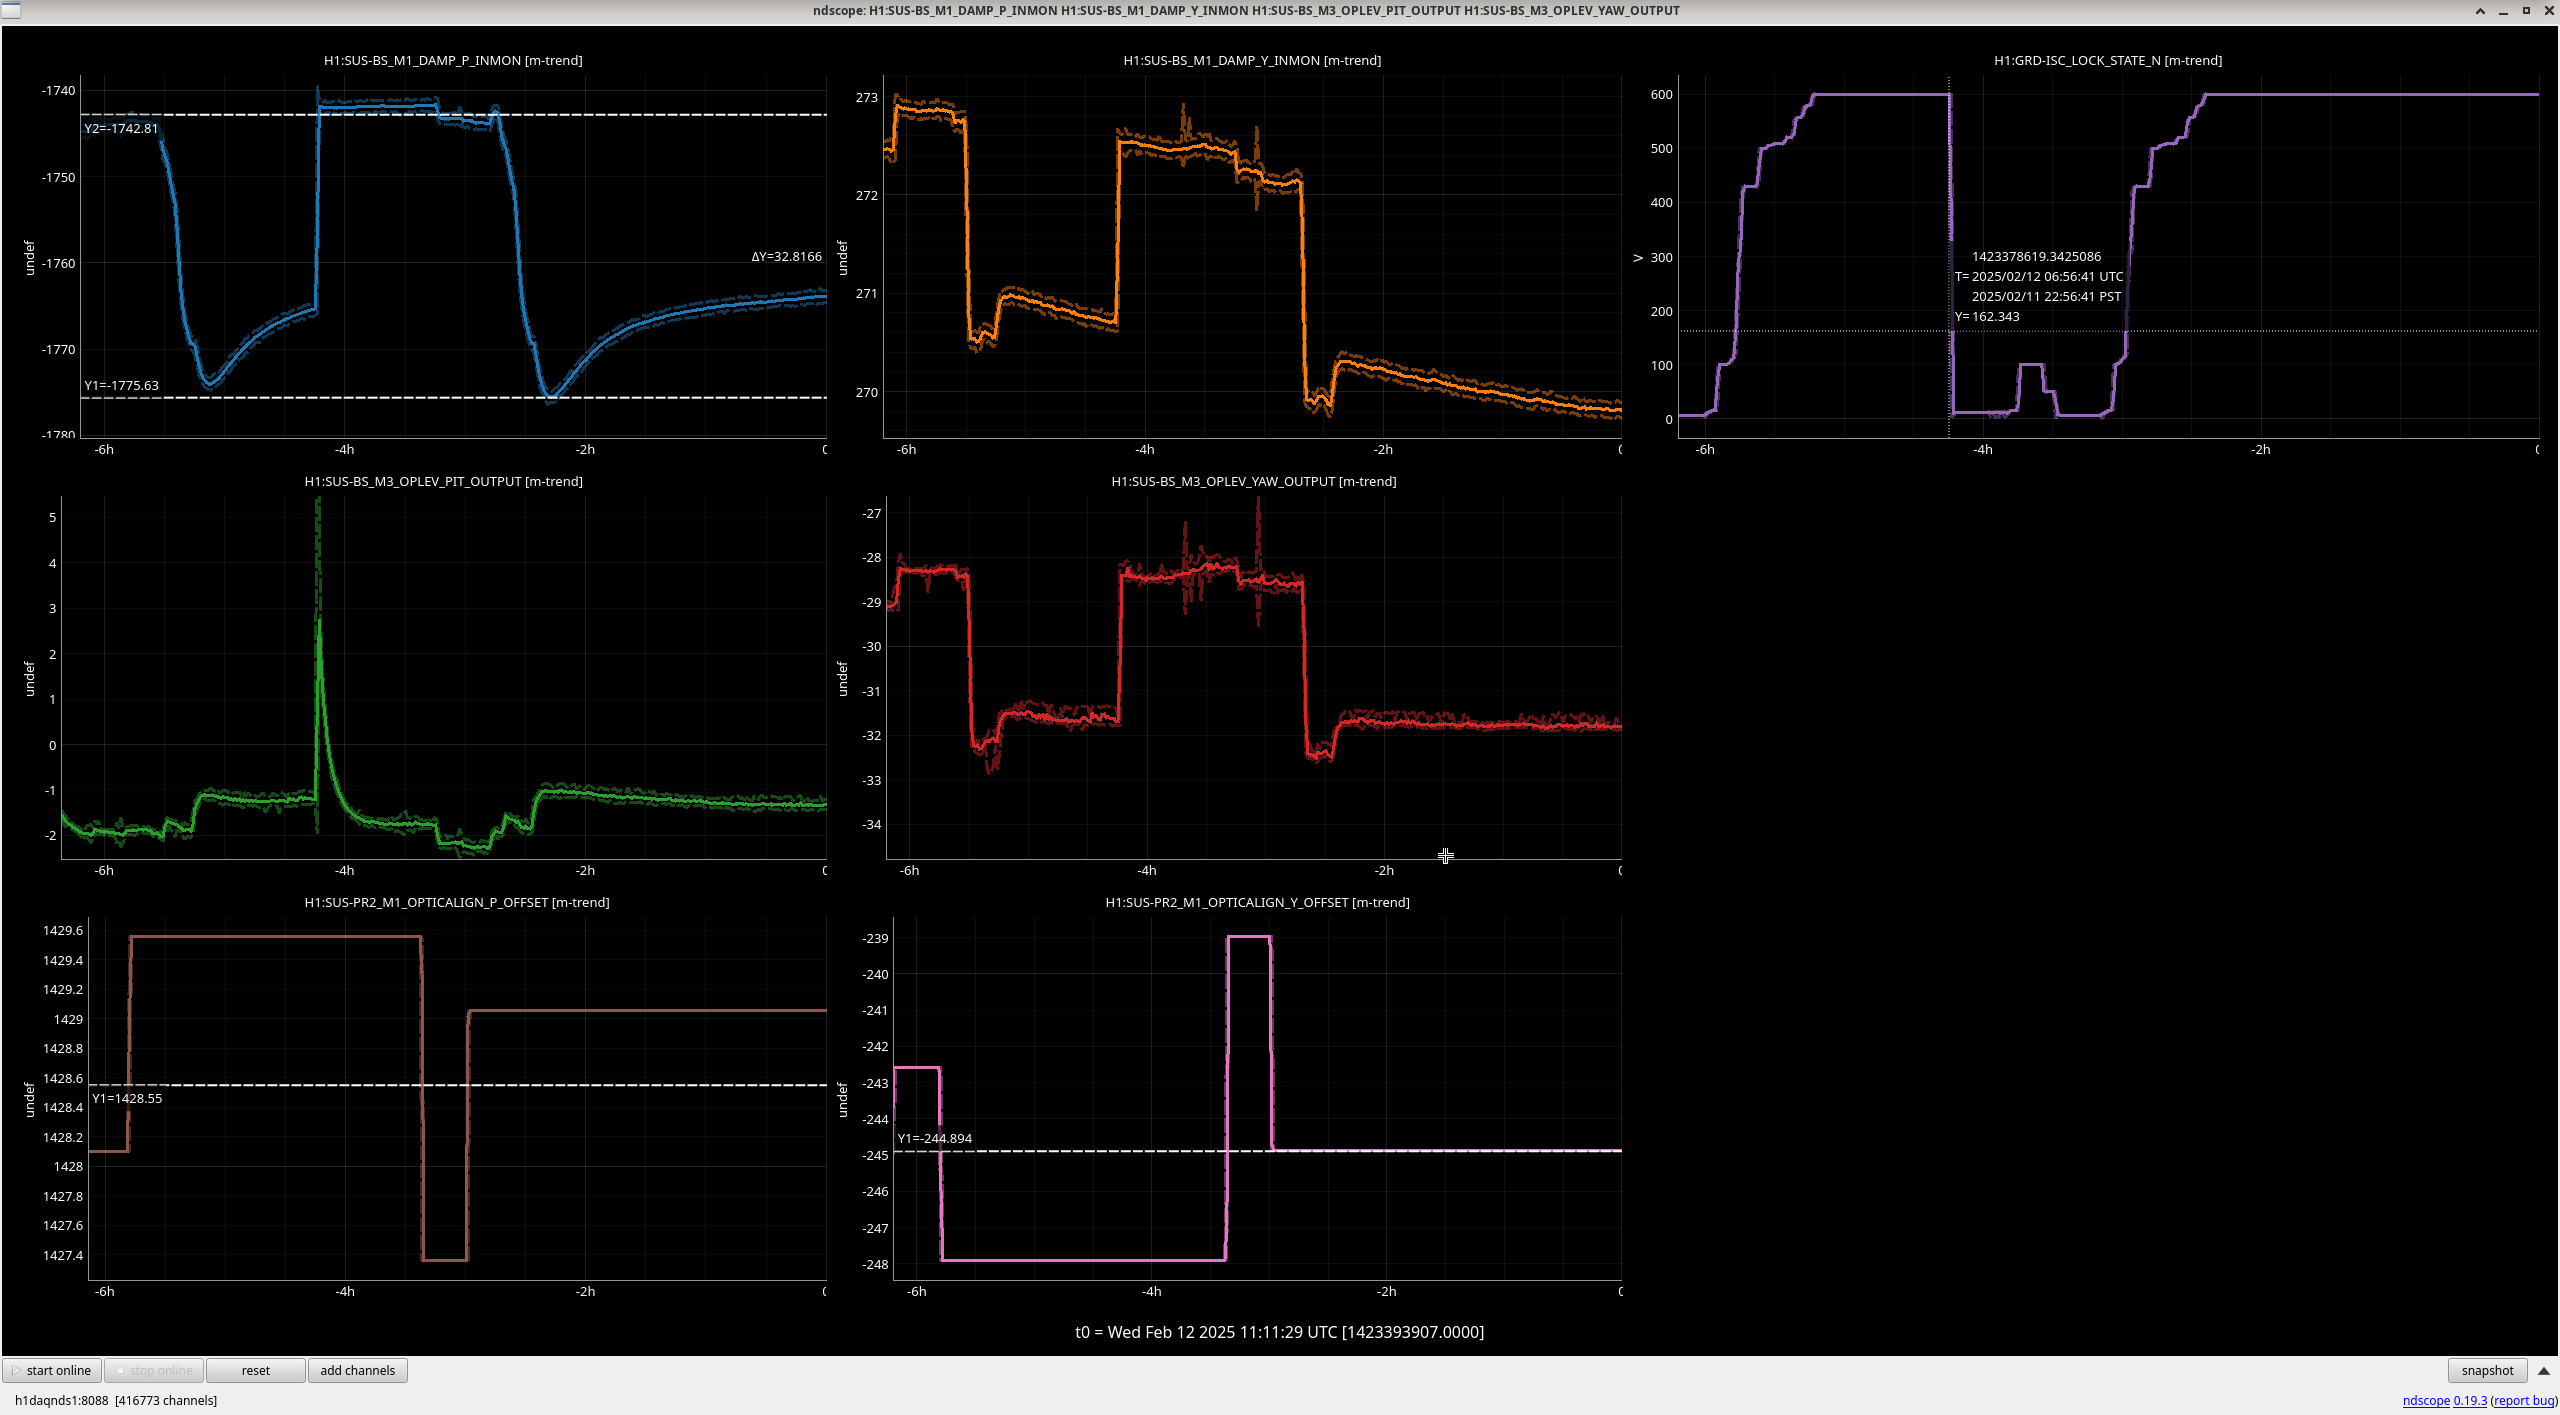
Sheila, Camilla
This reminded Sheila of when we were heating a SUS in the past and causing the bottom mass to pitch and the ASC to move the top mass to counteract this. Then after lockloss, the bottom mass would slowly go back to it's nominal position.
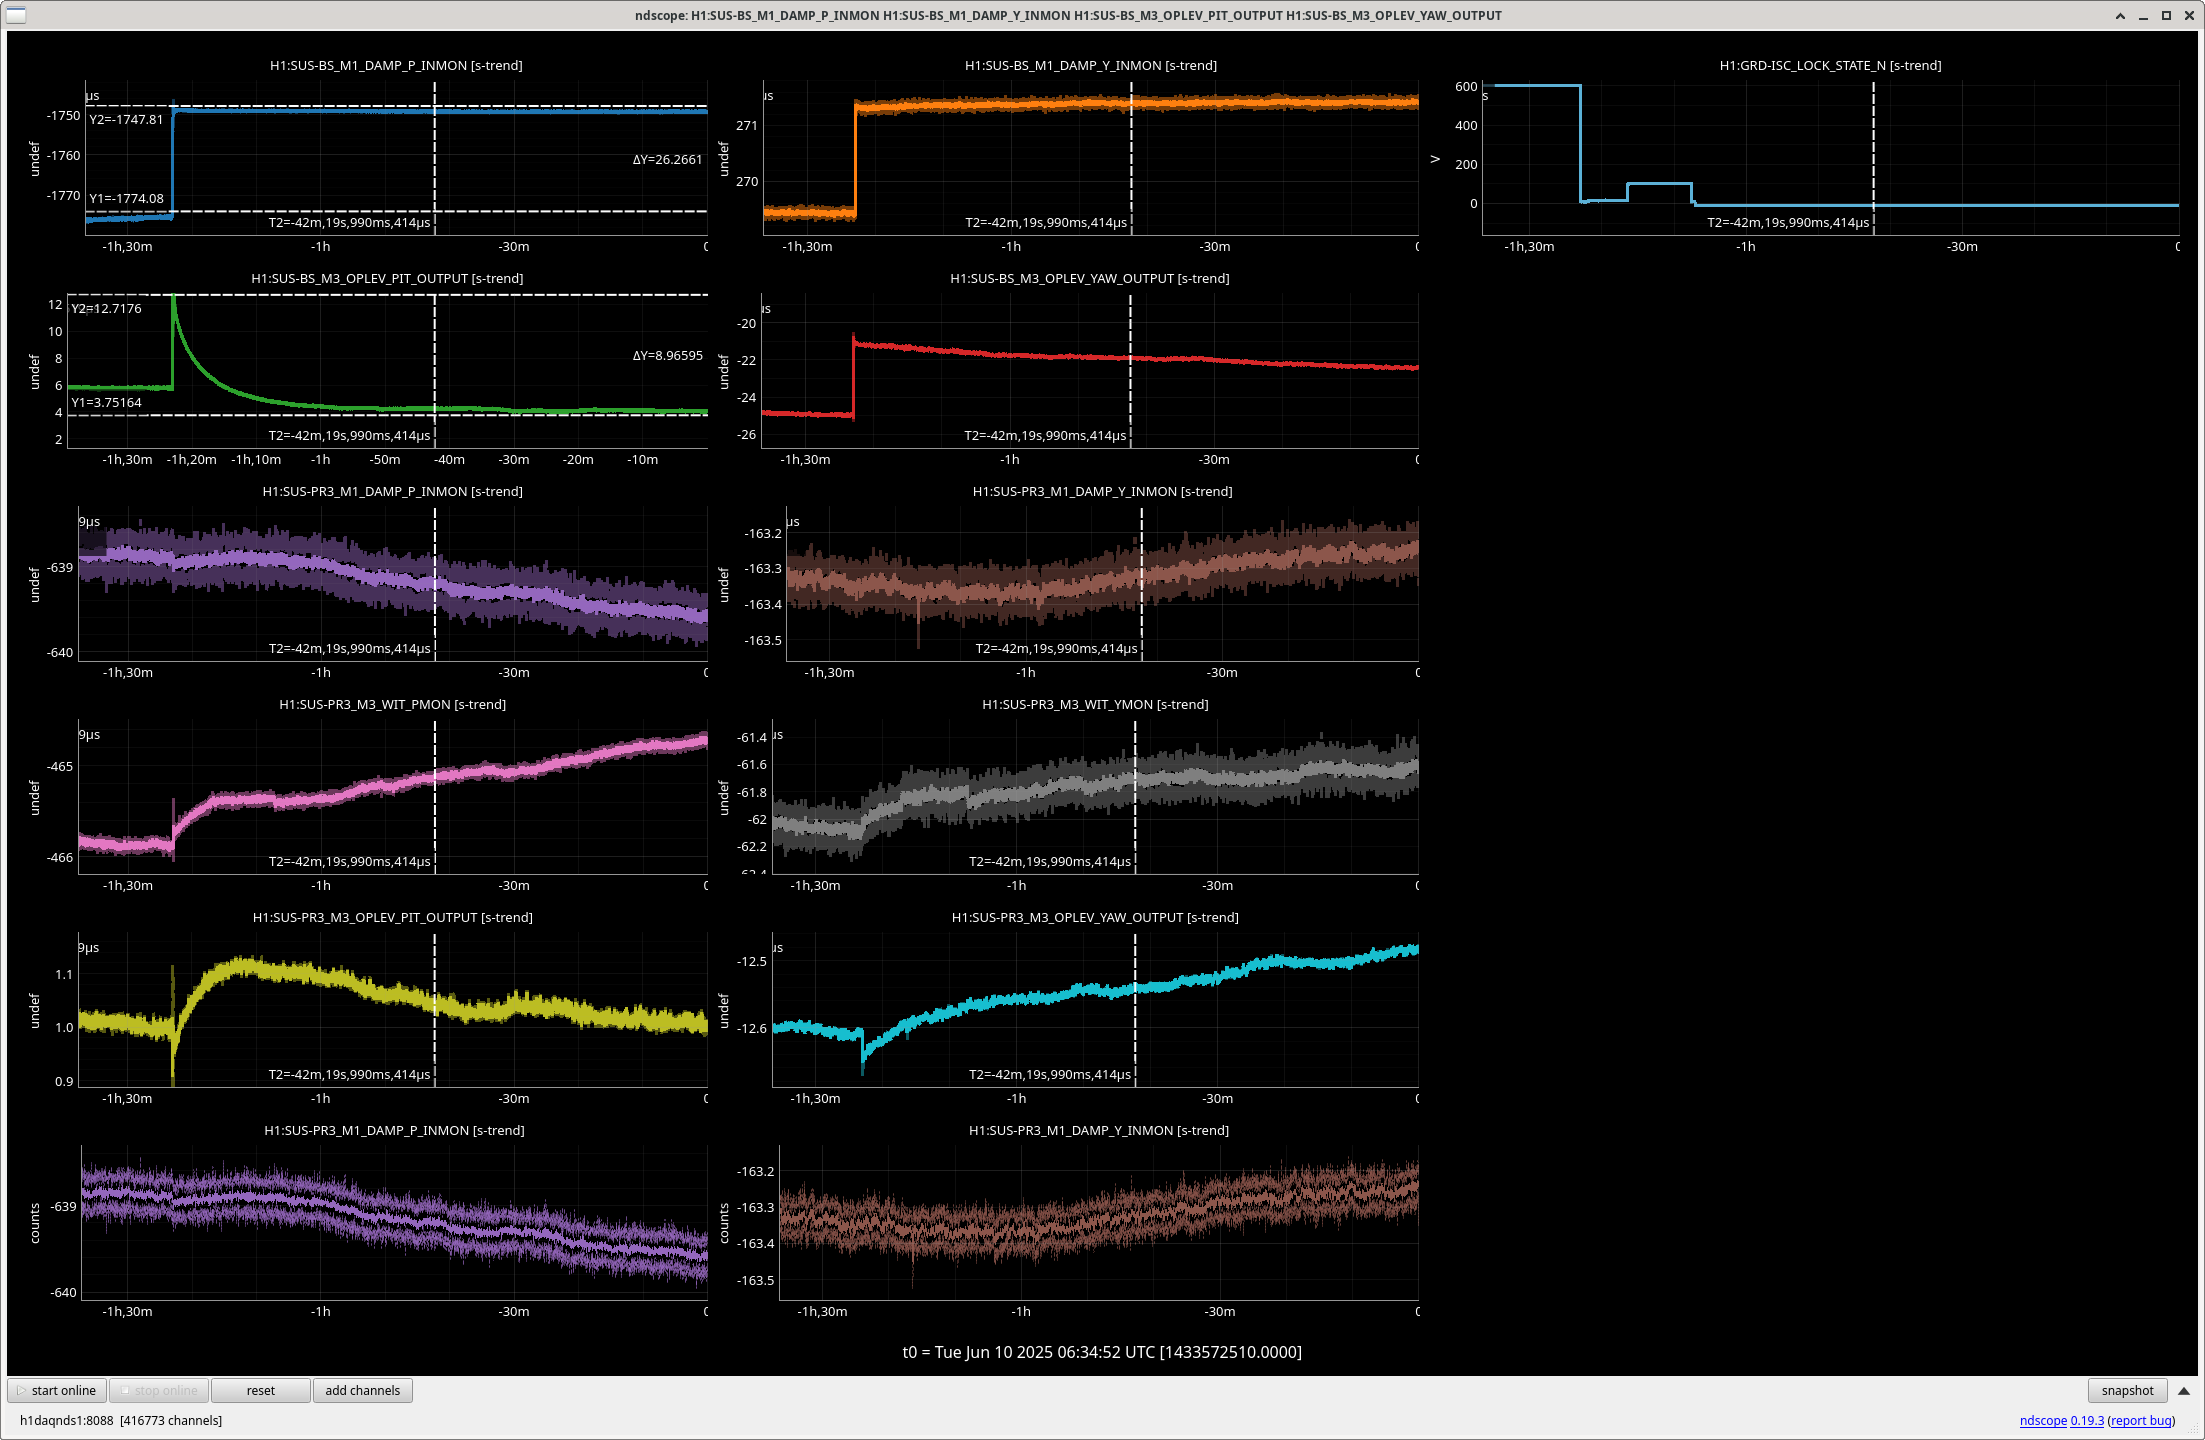
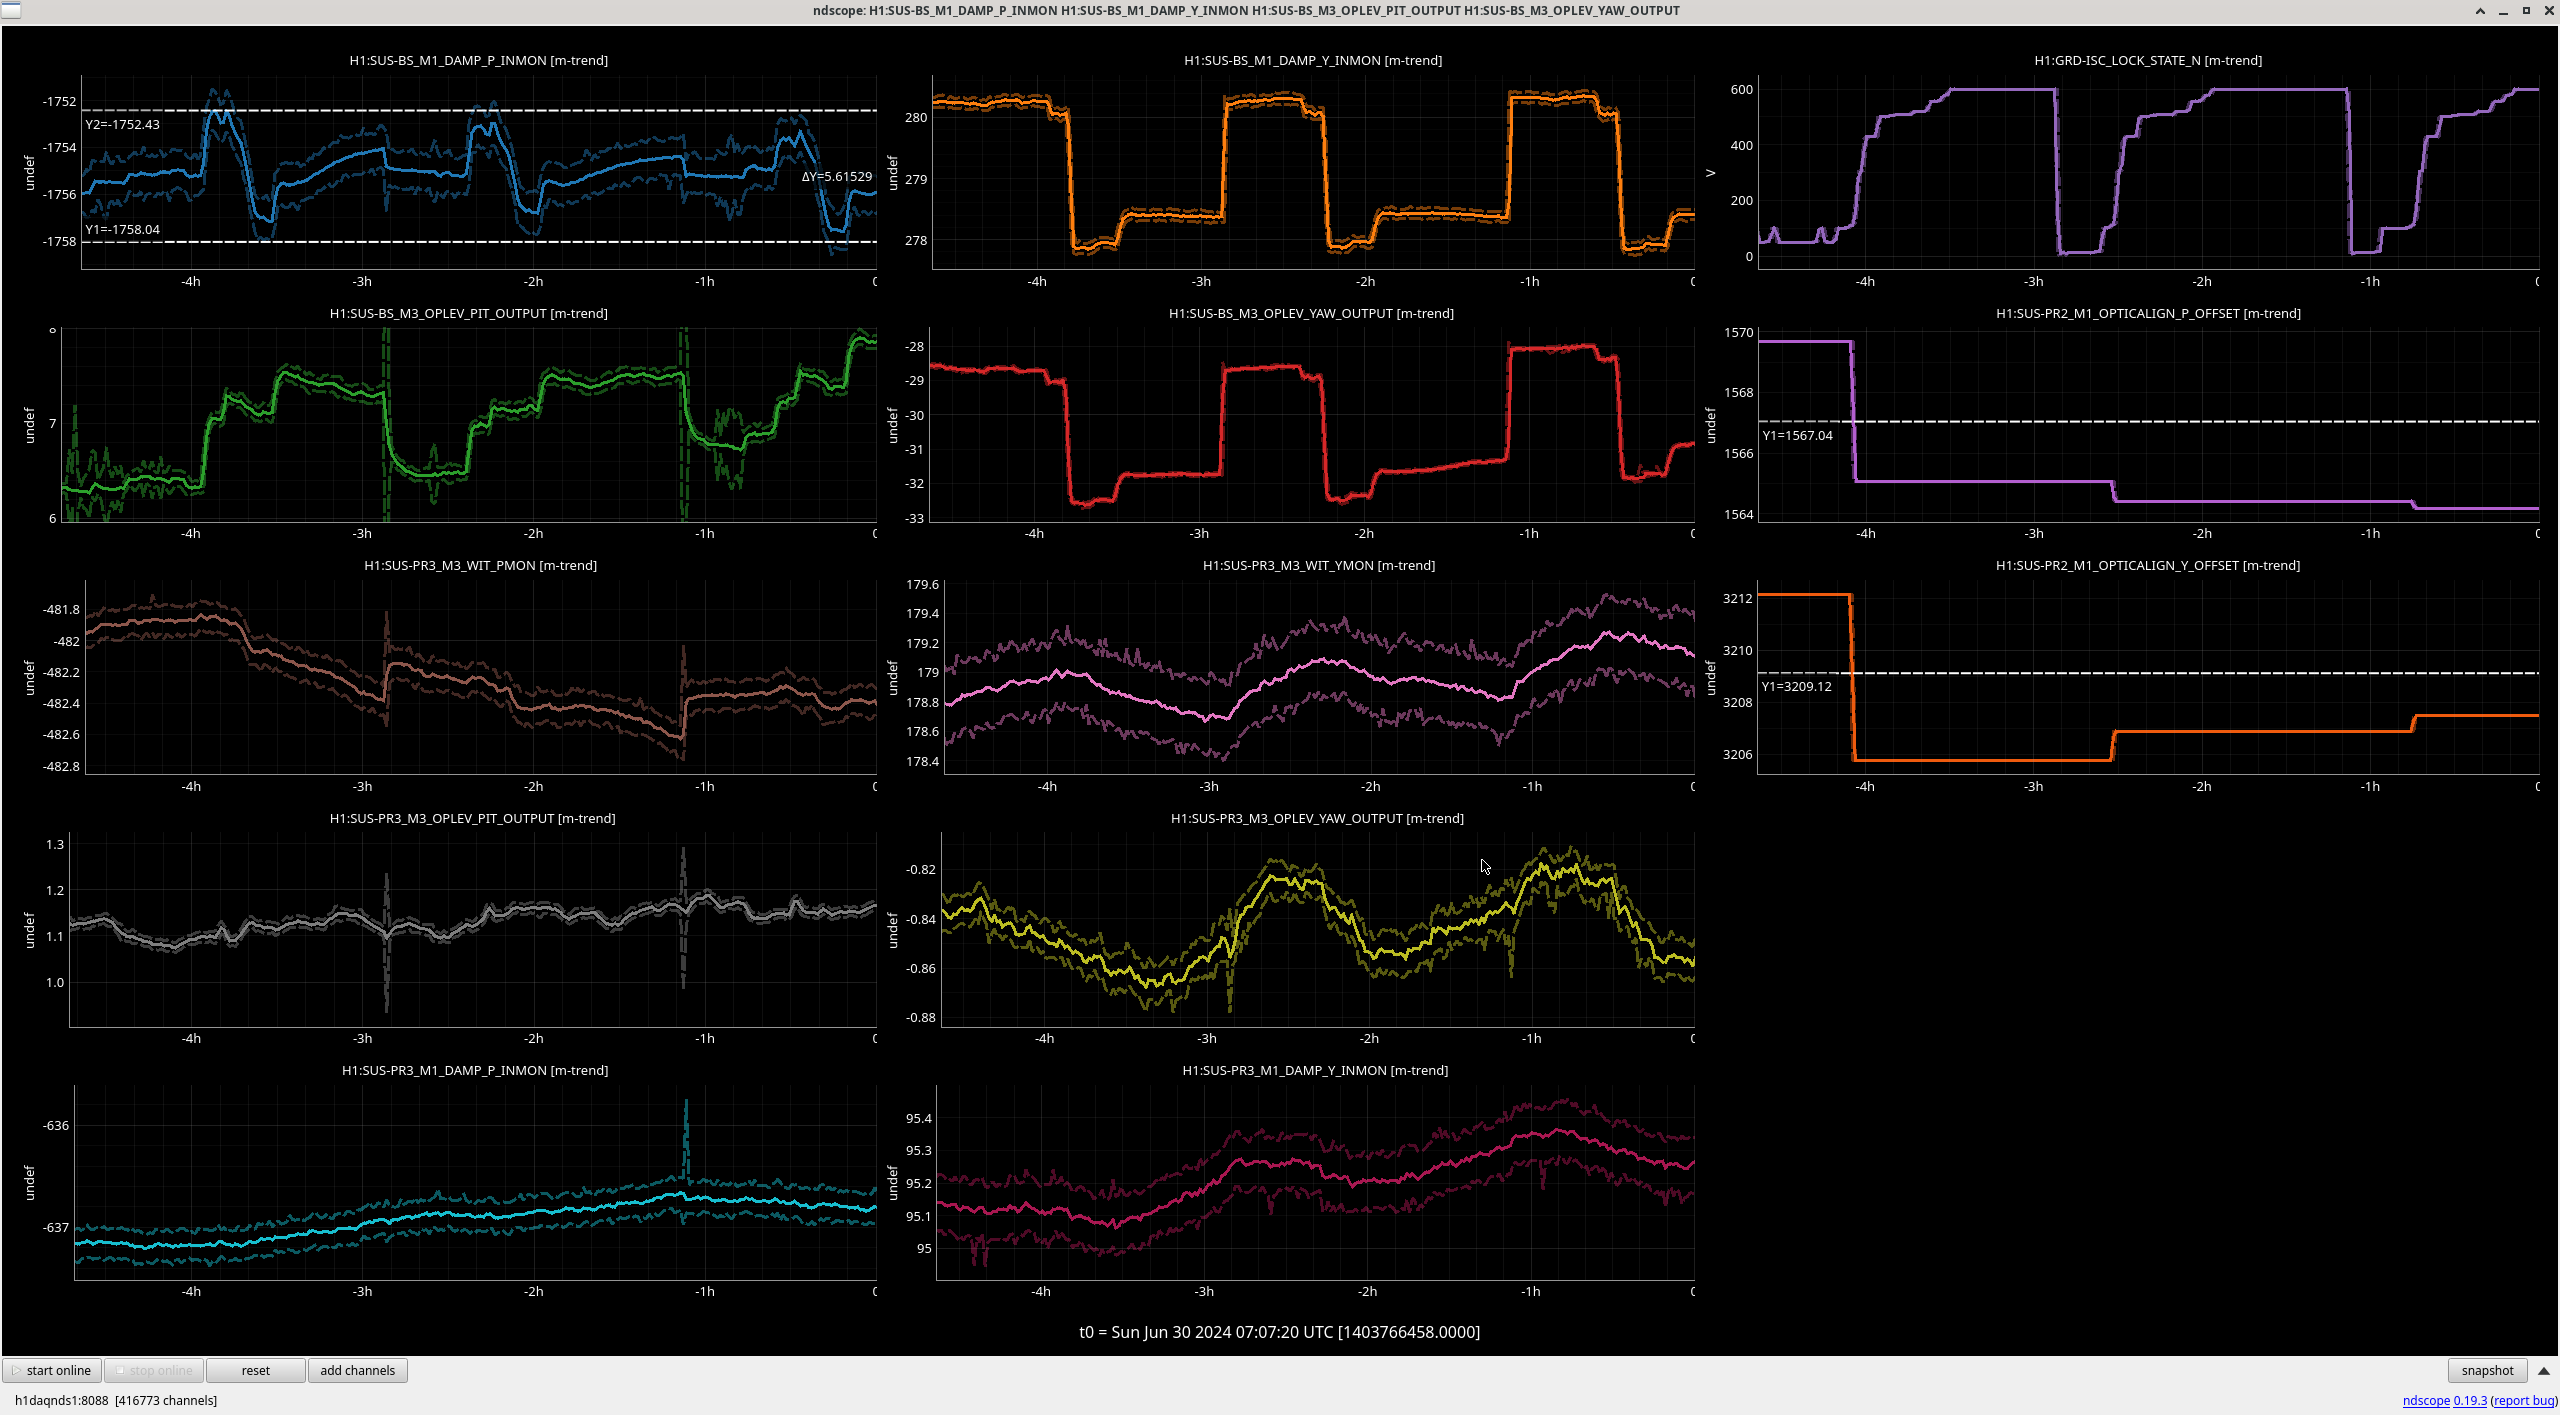
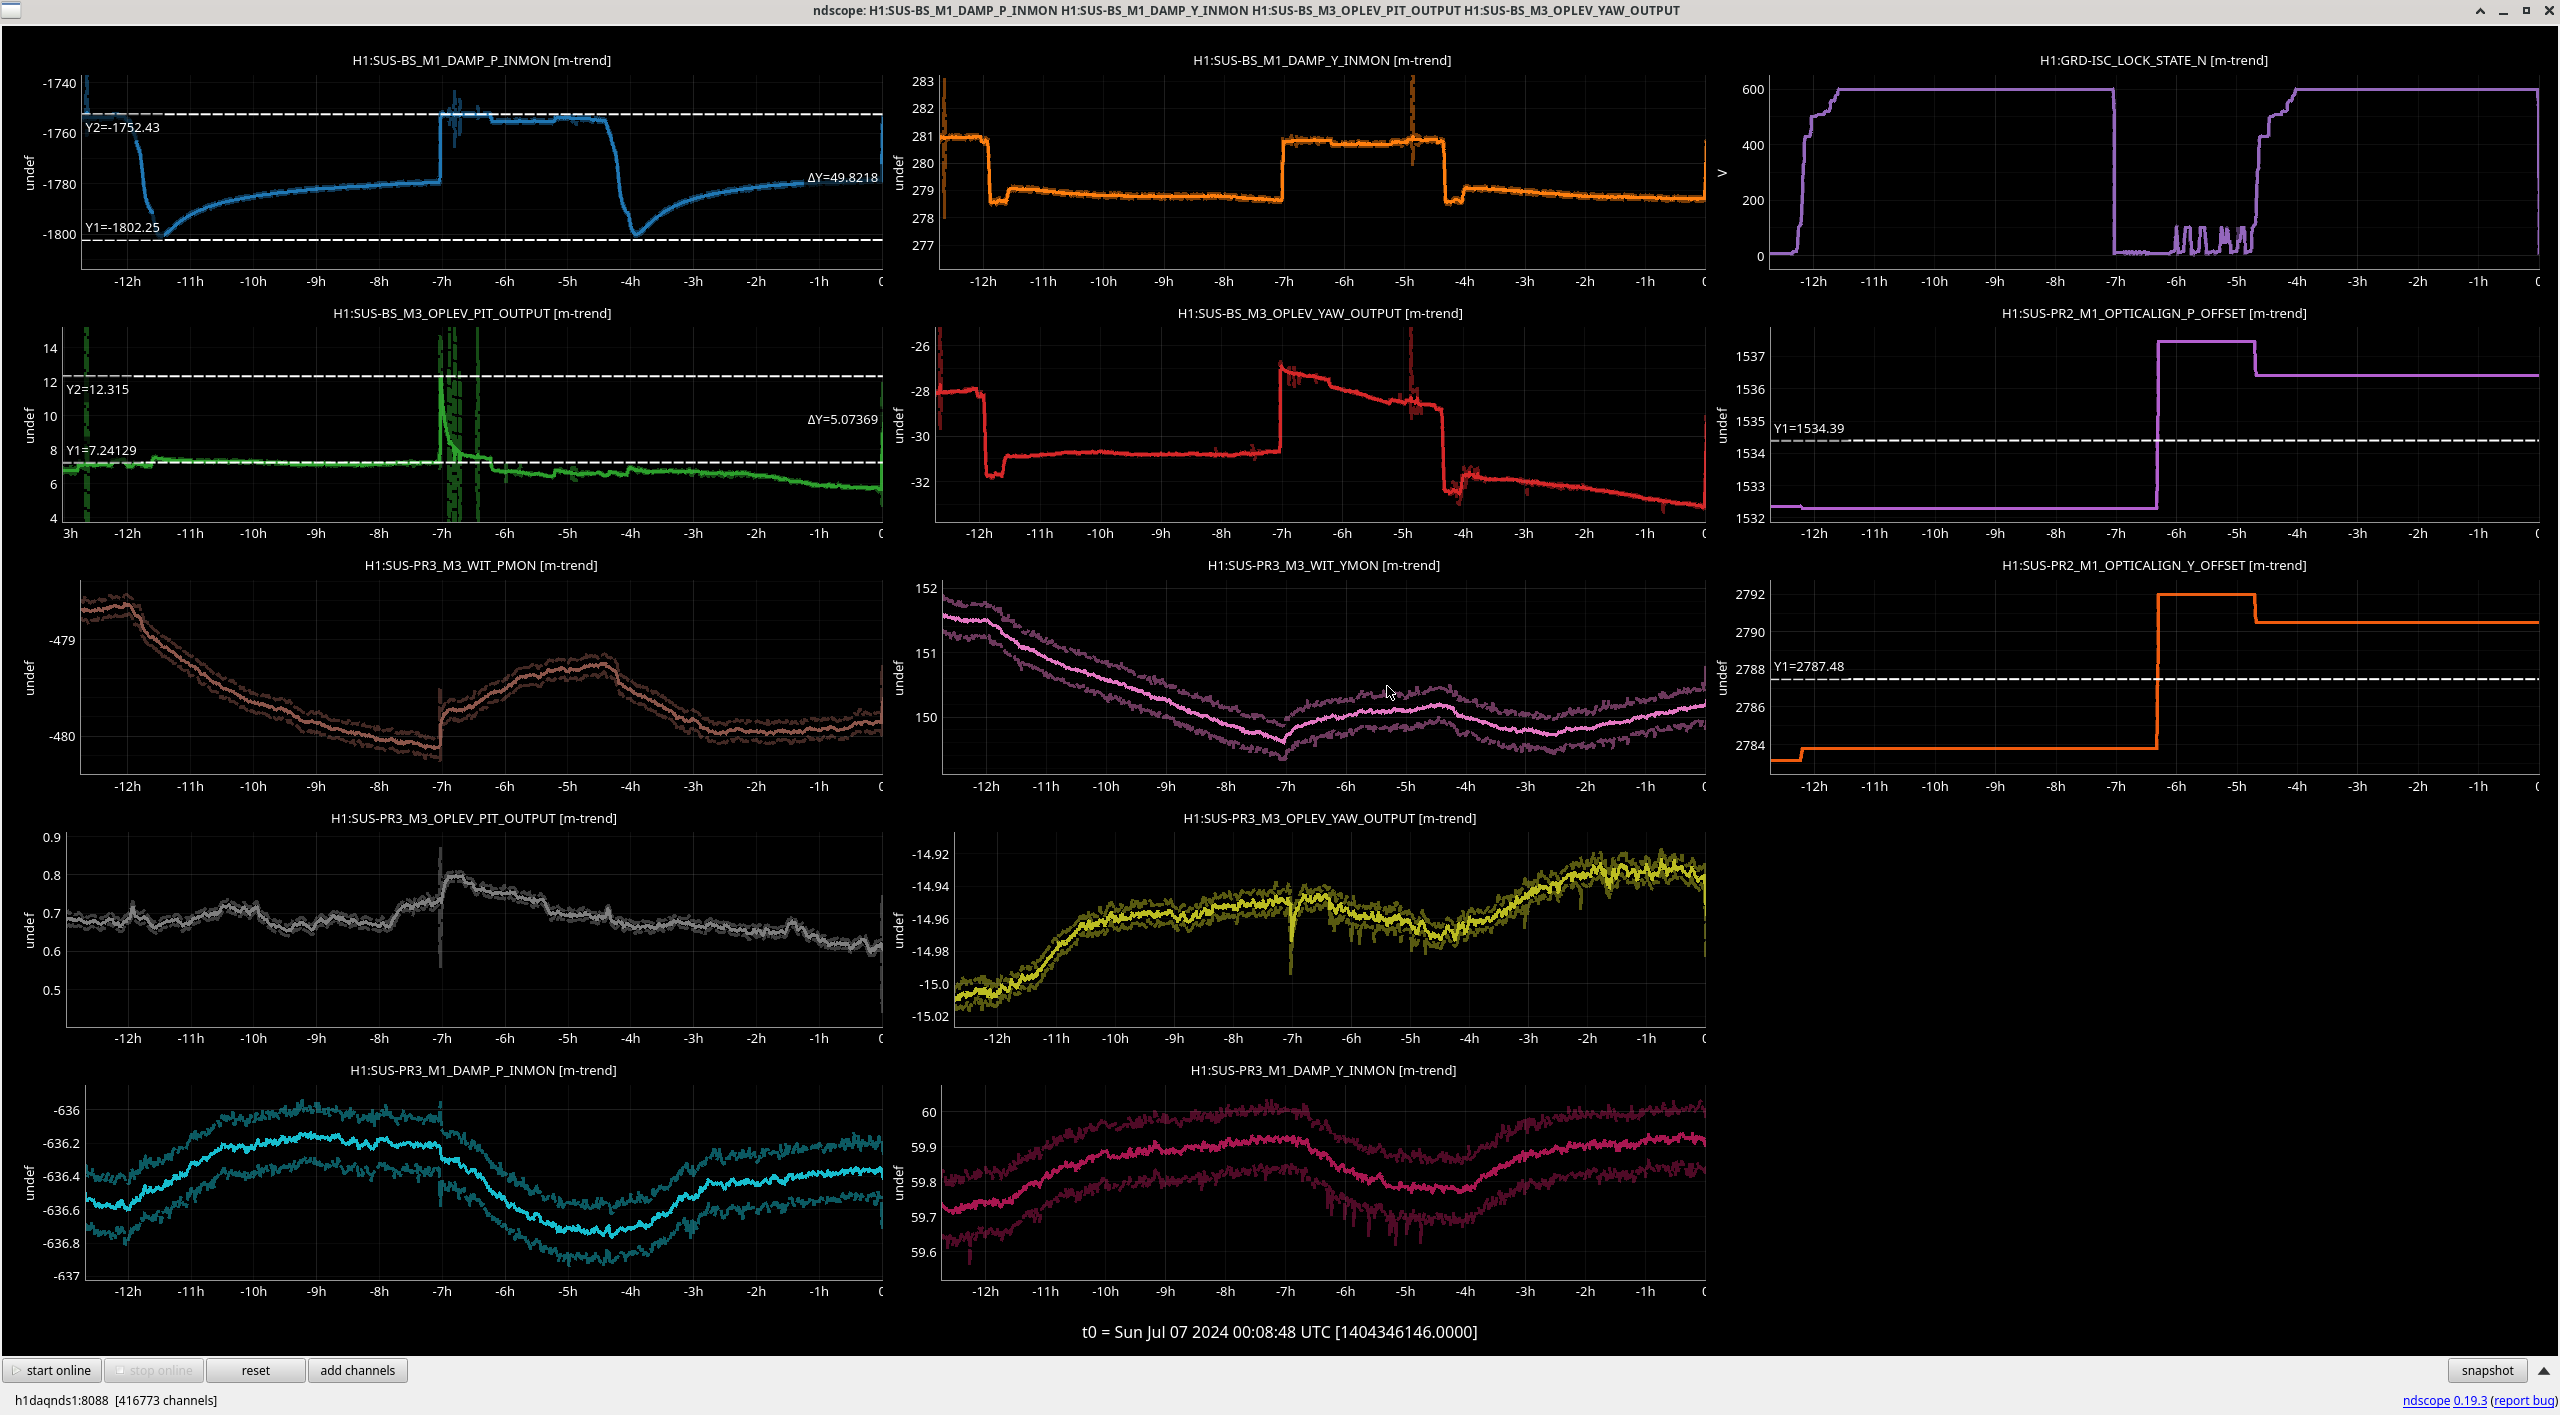
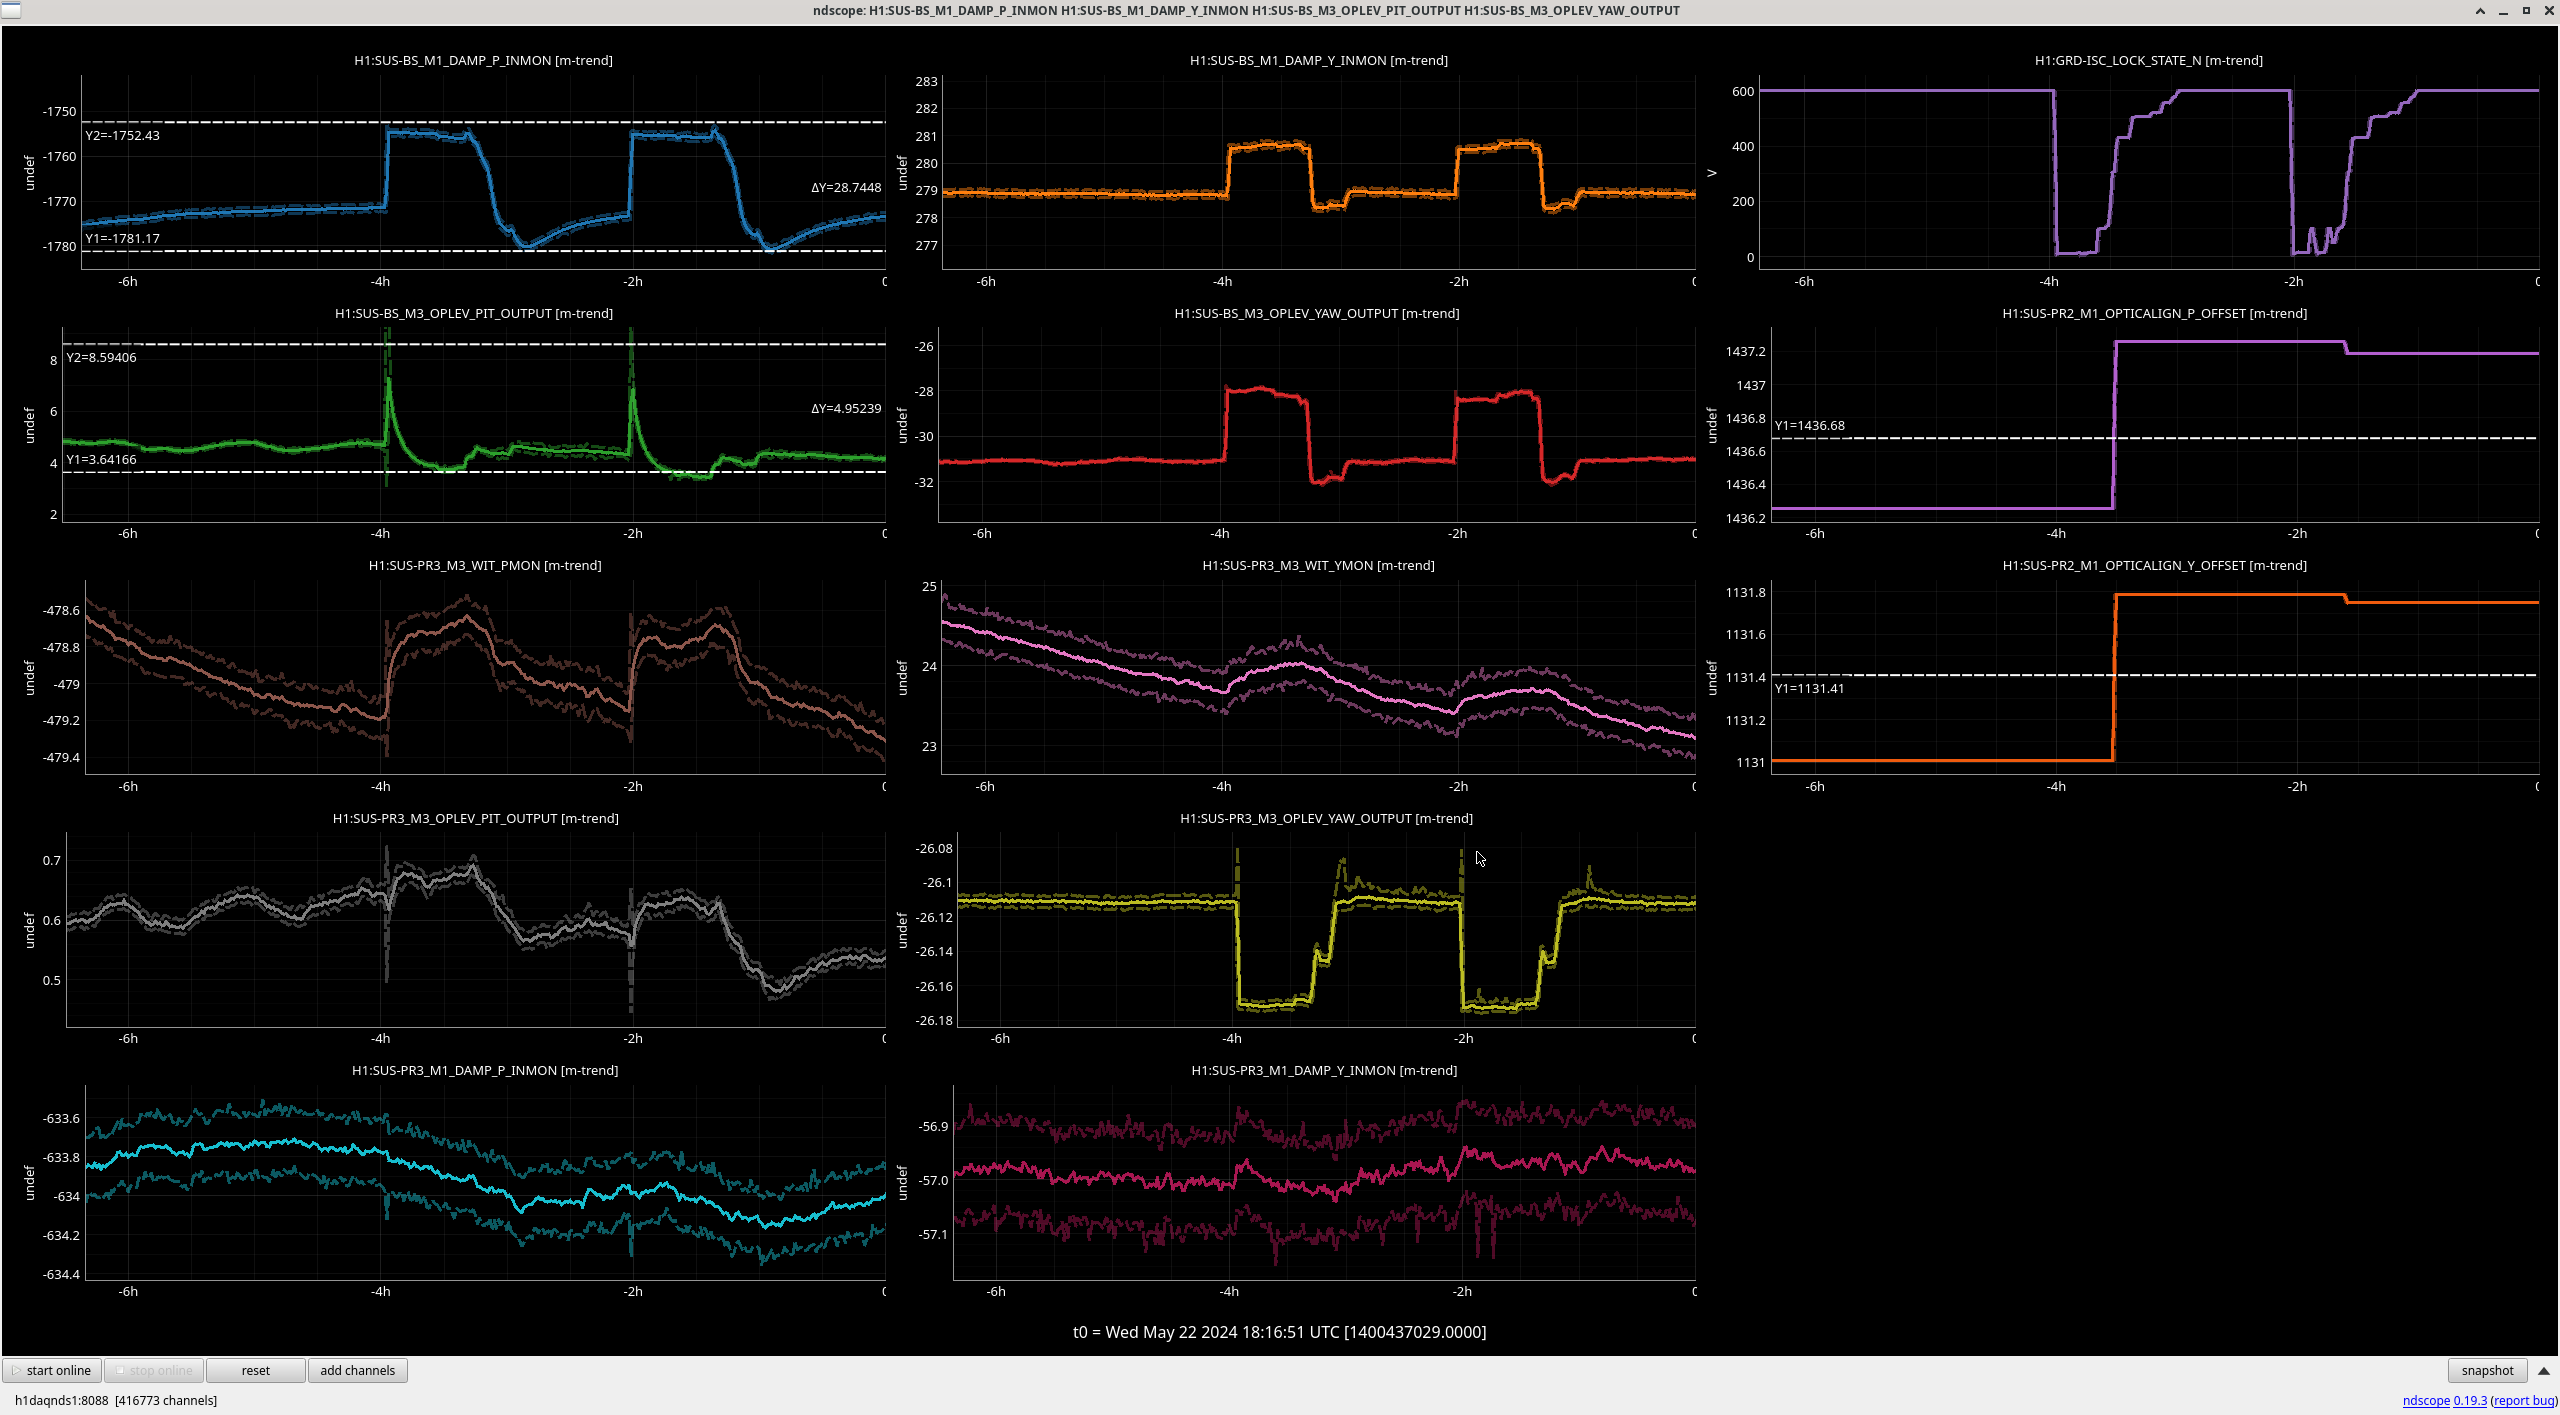
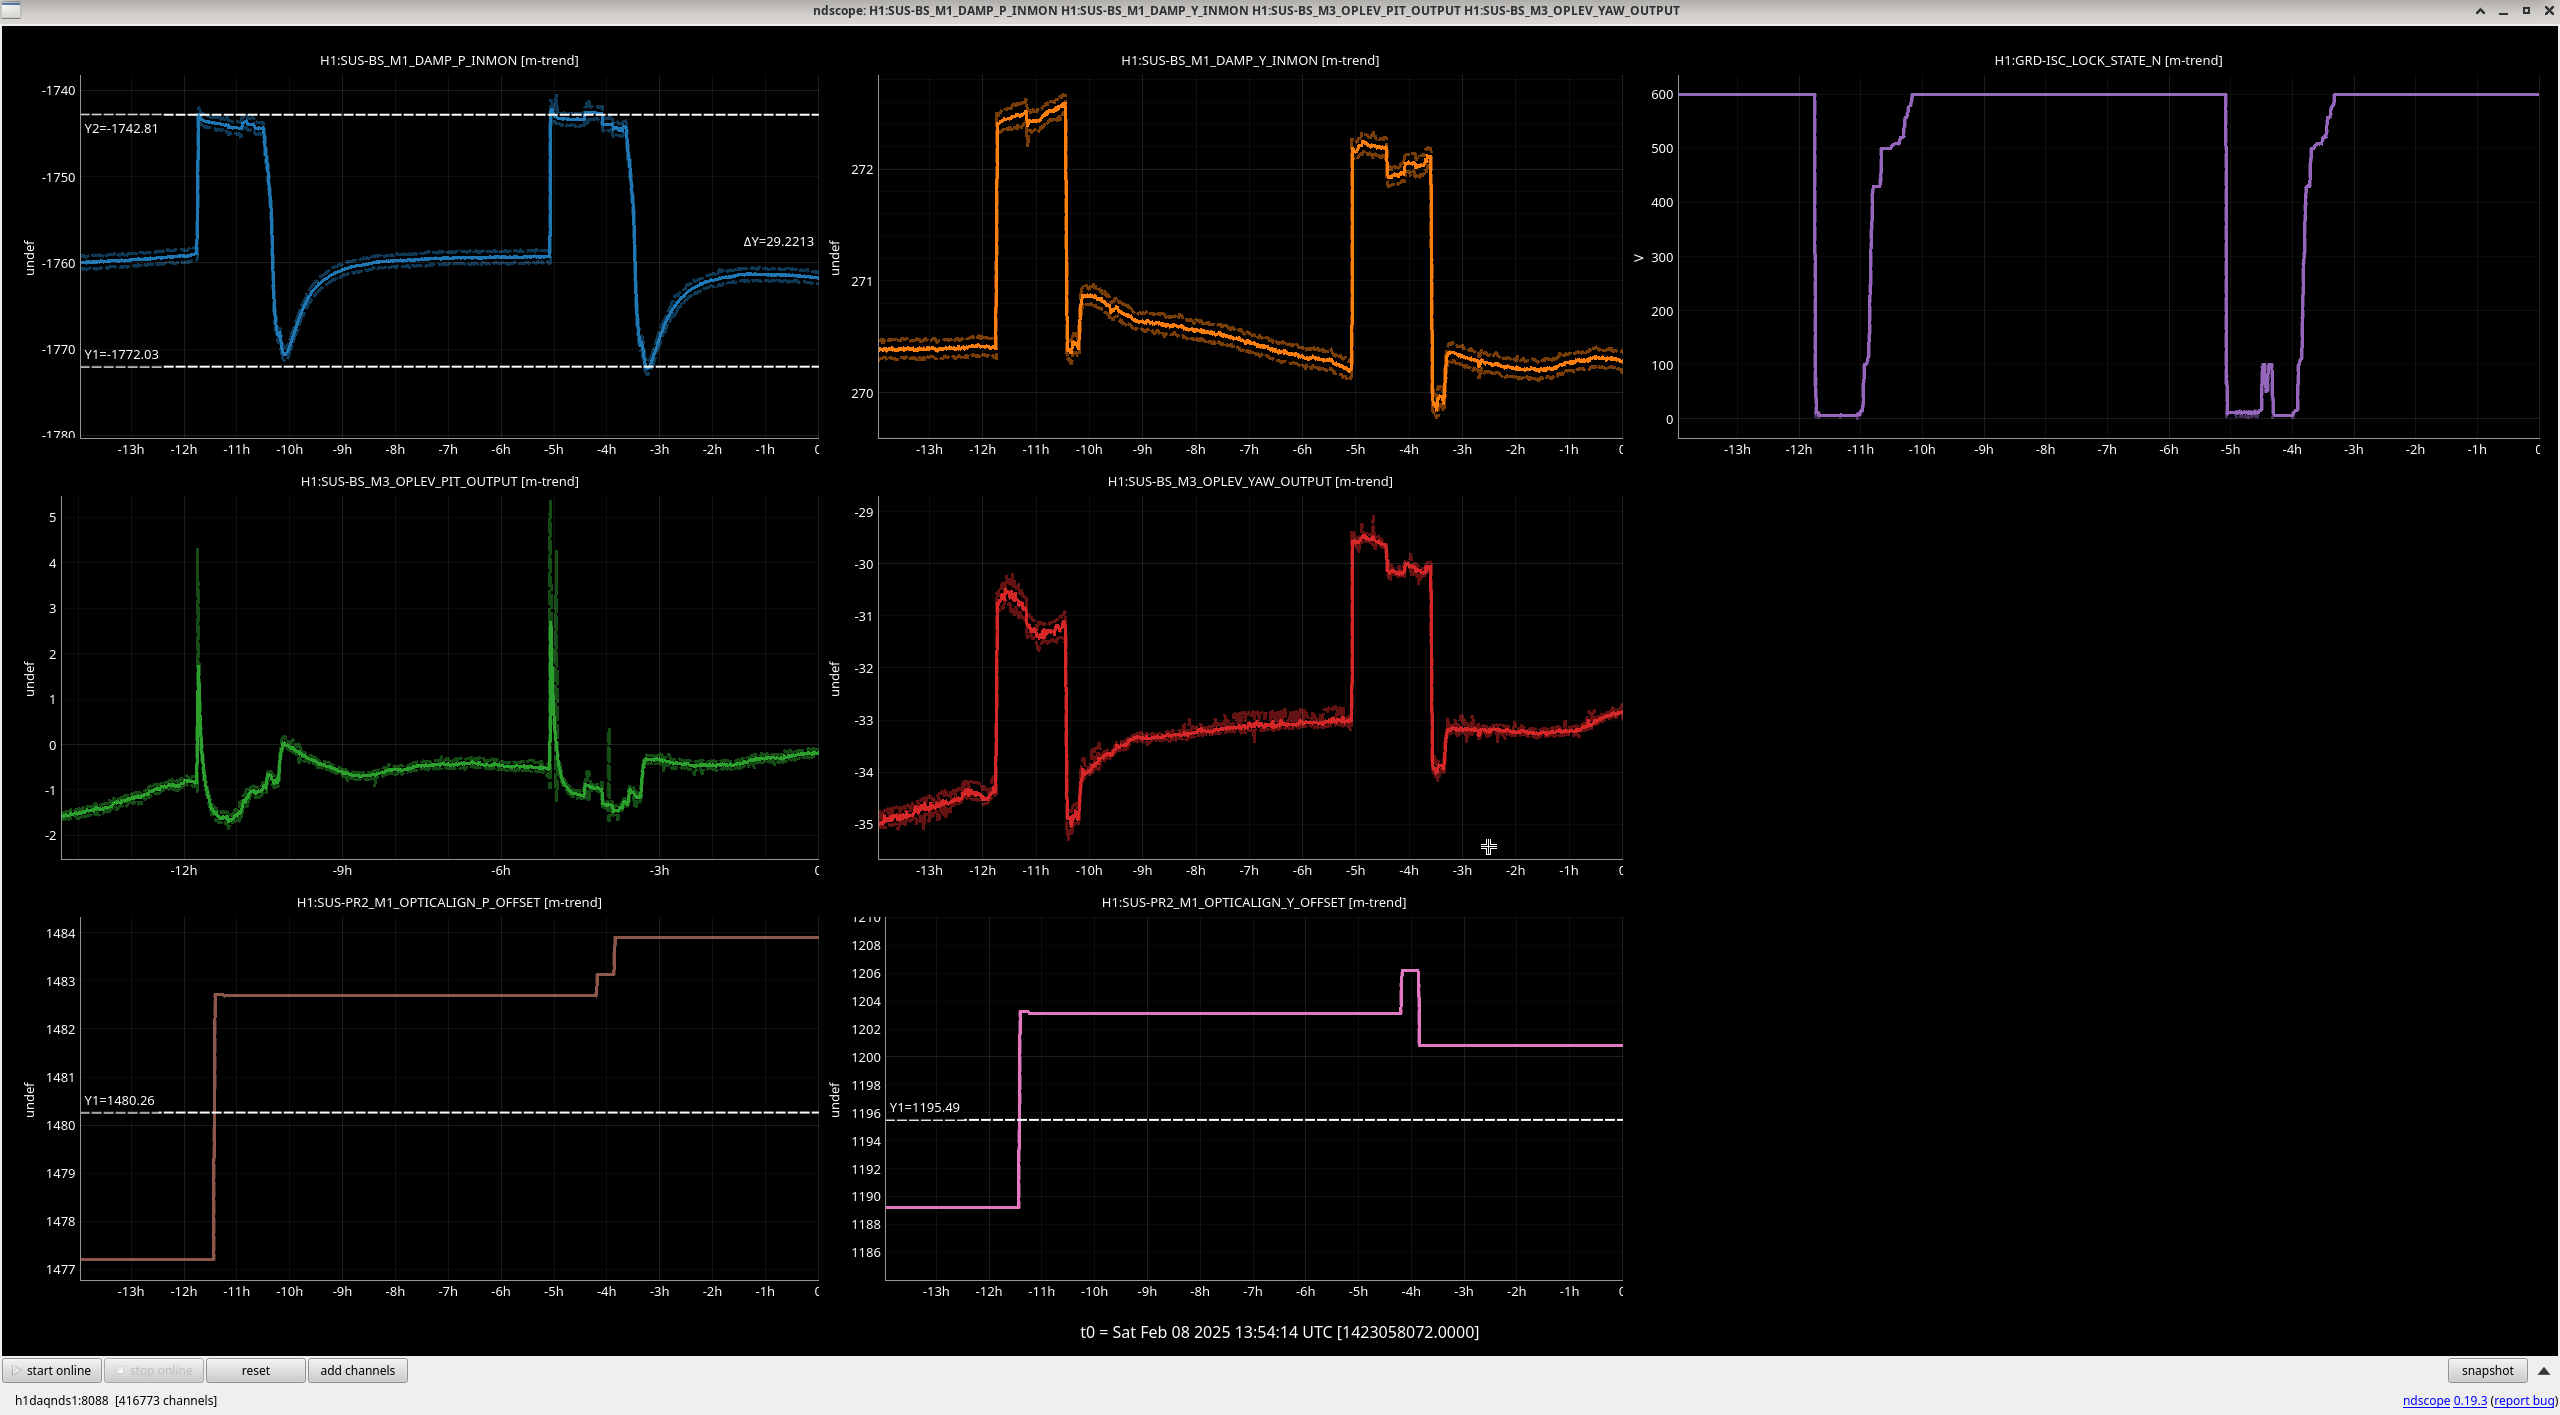
We do see this on the BS since the PR2 move, see attached (top 2 left plots). See in the green bottom mass oplev trace, when the ASC is turned off on lockloss, the BS moves quickly and then slowly moves again over the next ~30 minutes, do not see simular things on PR3. Attached is the same plot before the PR2 move. And below is a list of other PR2 positions we tried, all the other positions have also made this BS drift. The total PR2 move since the good place is ~3500urad in Yaw.
To avoid this heating and BS drift, we should move back towards a PR2 YAW of closer to 3200. But, we moved PR2 to avoid the spot clipping on the scrapper baffle, e.g. 77631, 80319, 82722, 82641.
I did a bit of alog archaeology to re-remember what we'd done in the past.
To put back the soft turn-off of the BS ASC, I think we need to:
Camilla made the good point that we probably don't want to implement this and then have the first trial of it be overnight. Maybe I'll put it in sometime Monday (when we again have commissioning time), and if we lose lock we can check that it did all the right things.
I've now implemented this soft let-go of BS pit in the ISC_DRMI guardian, and loaded. We'll be able to watch it throughout the day today, including while we're commissioning, so hopefully we'll be able to see it work properly at least once (eg, from a DRMI lockloss).
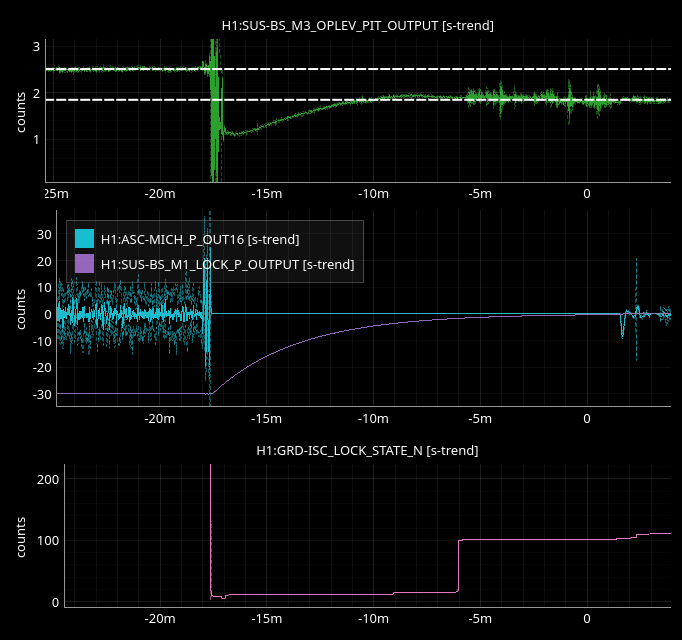
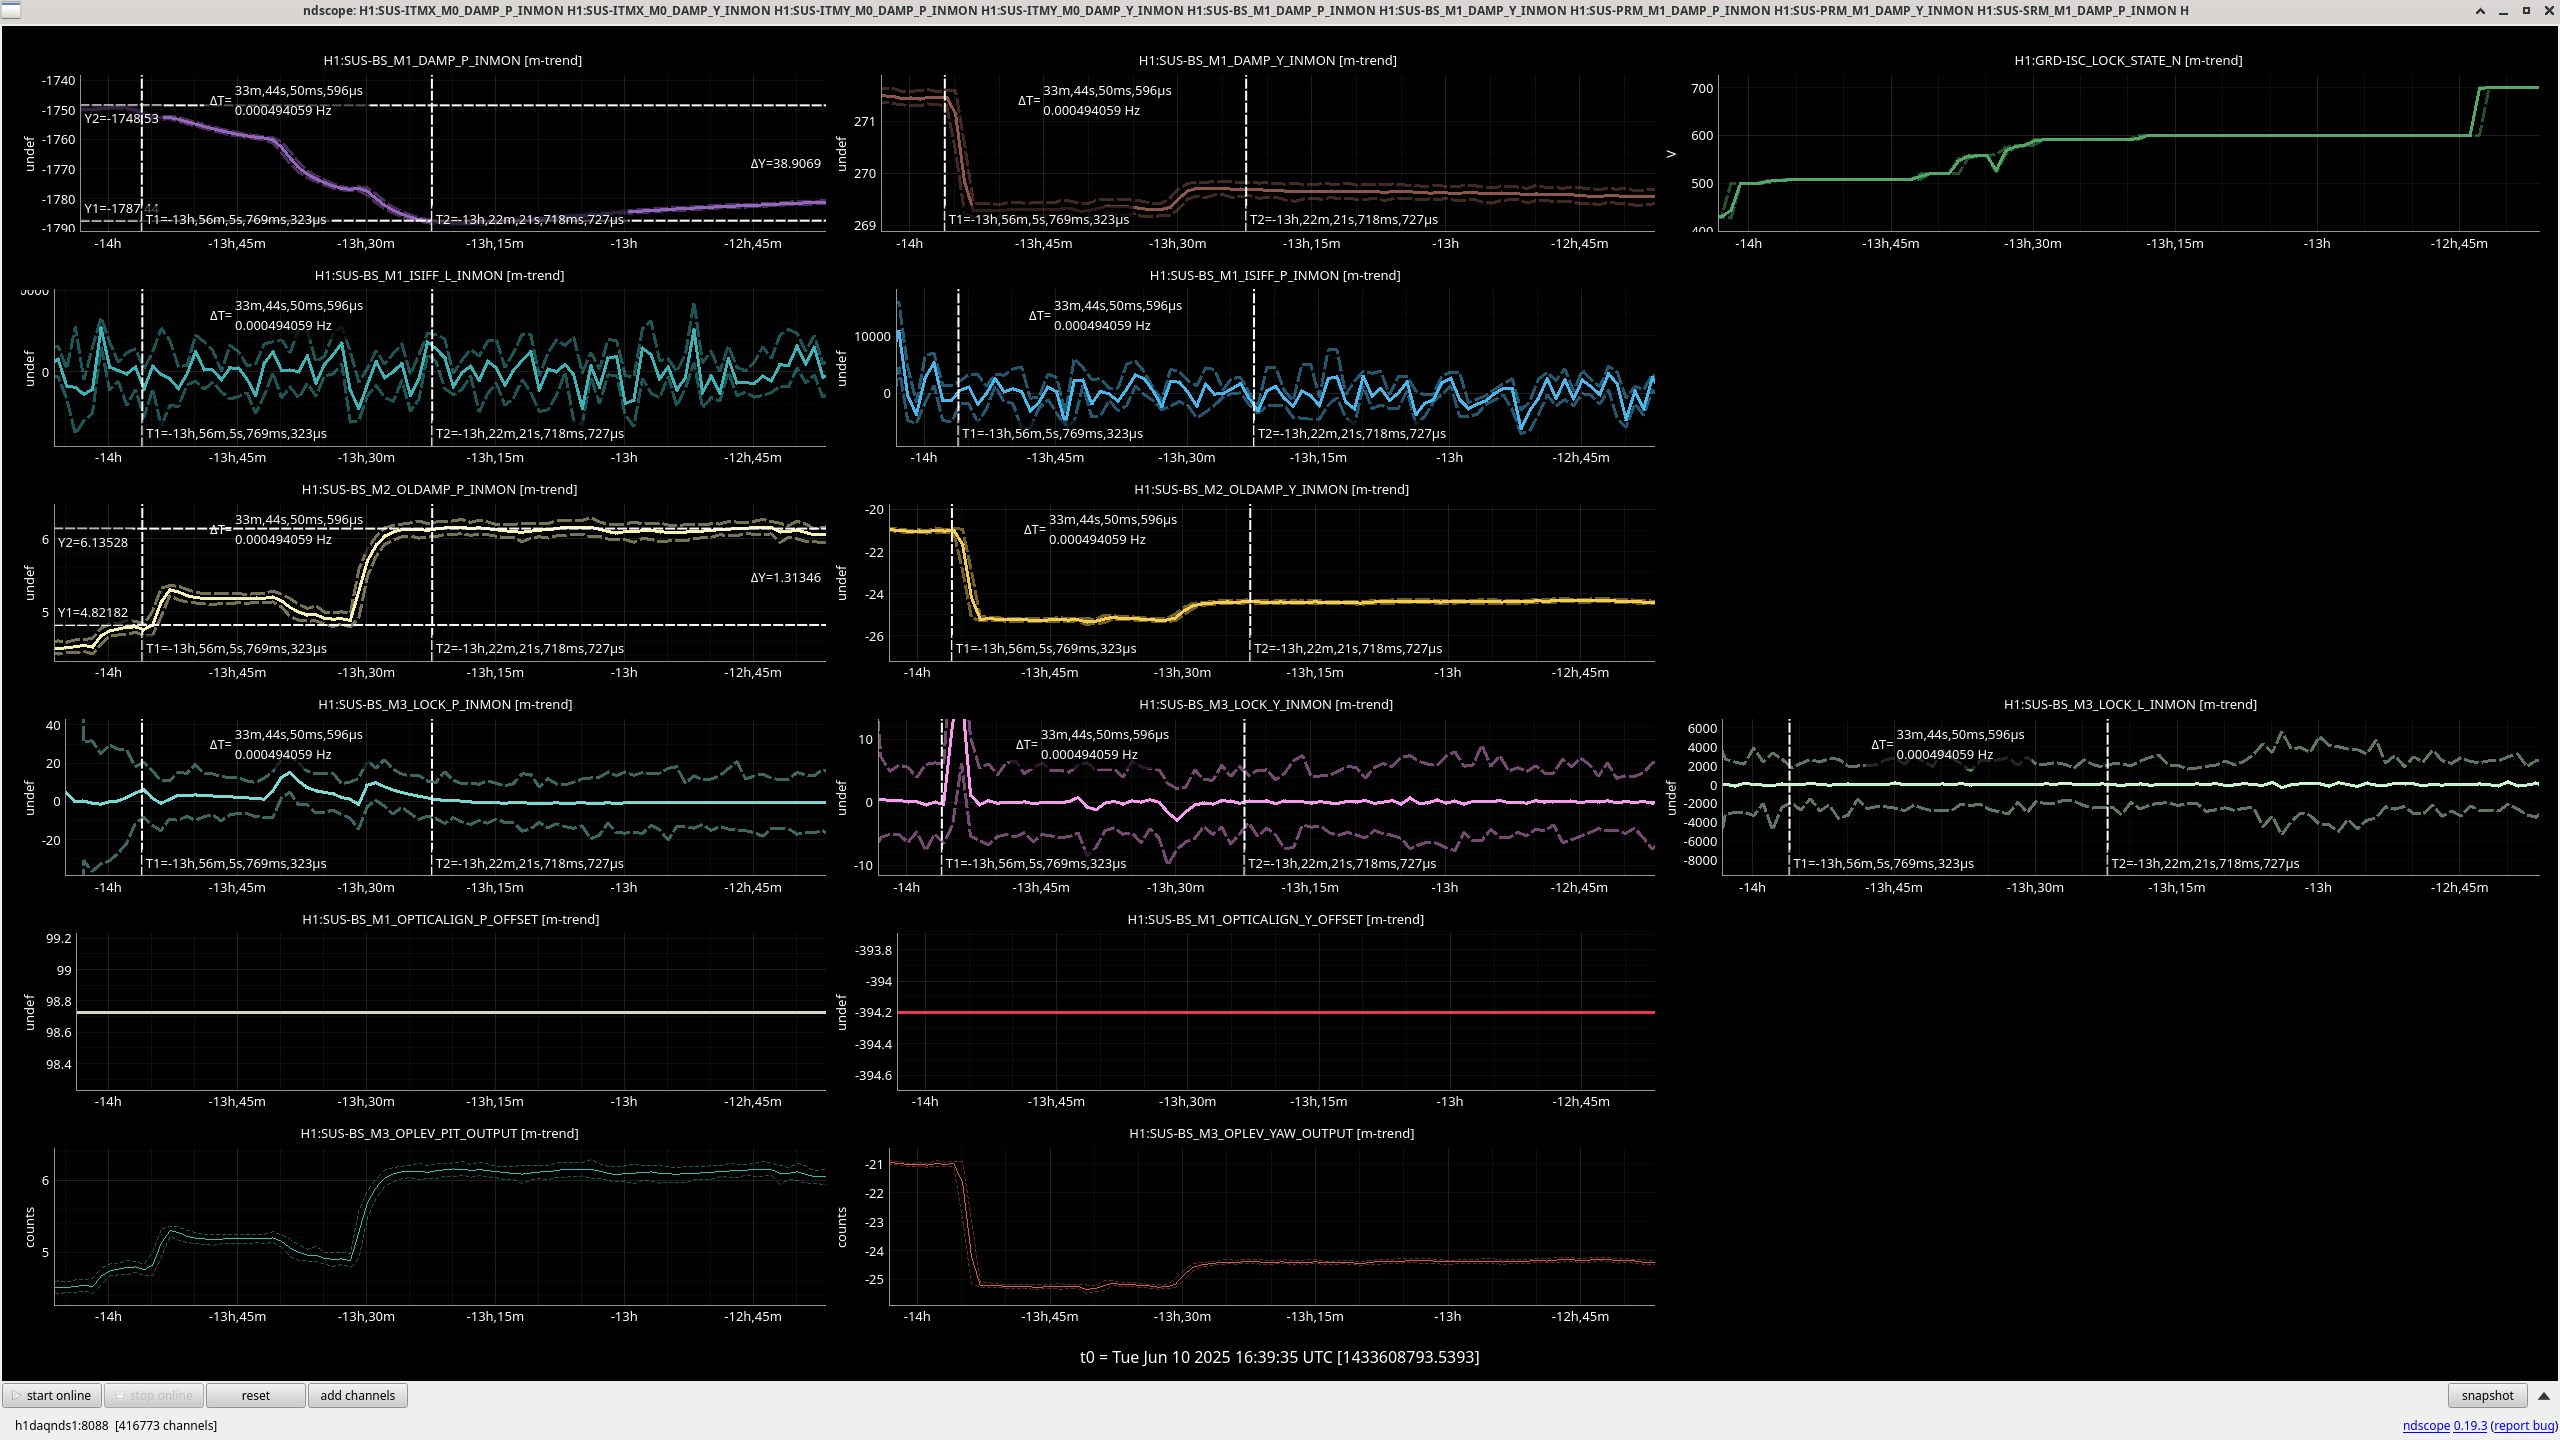
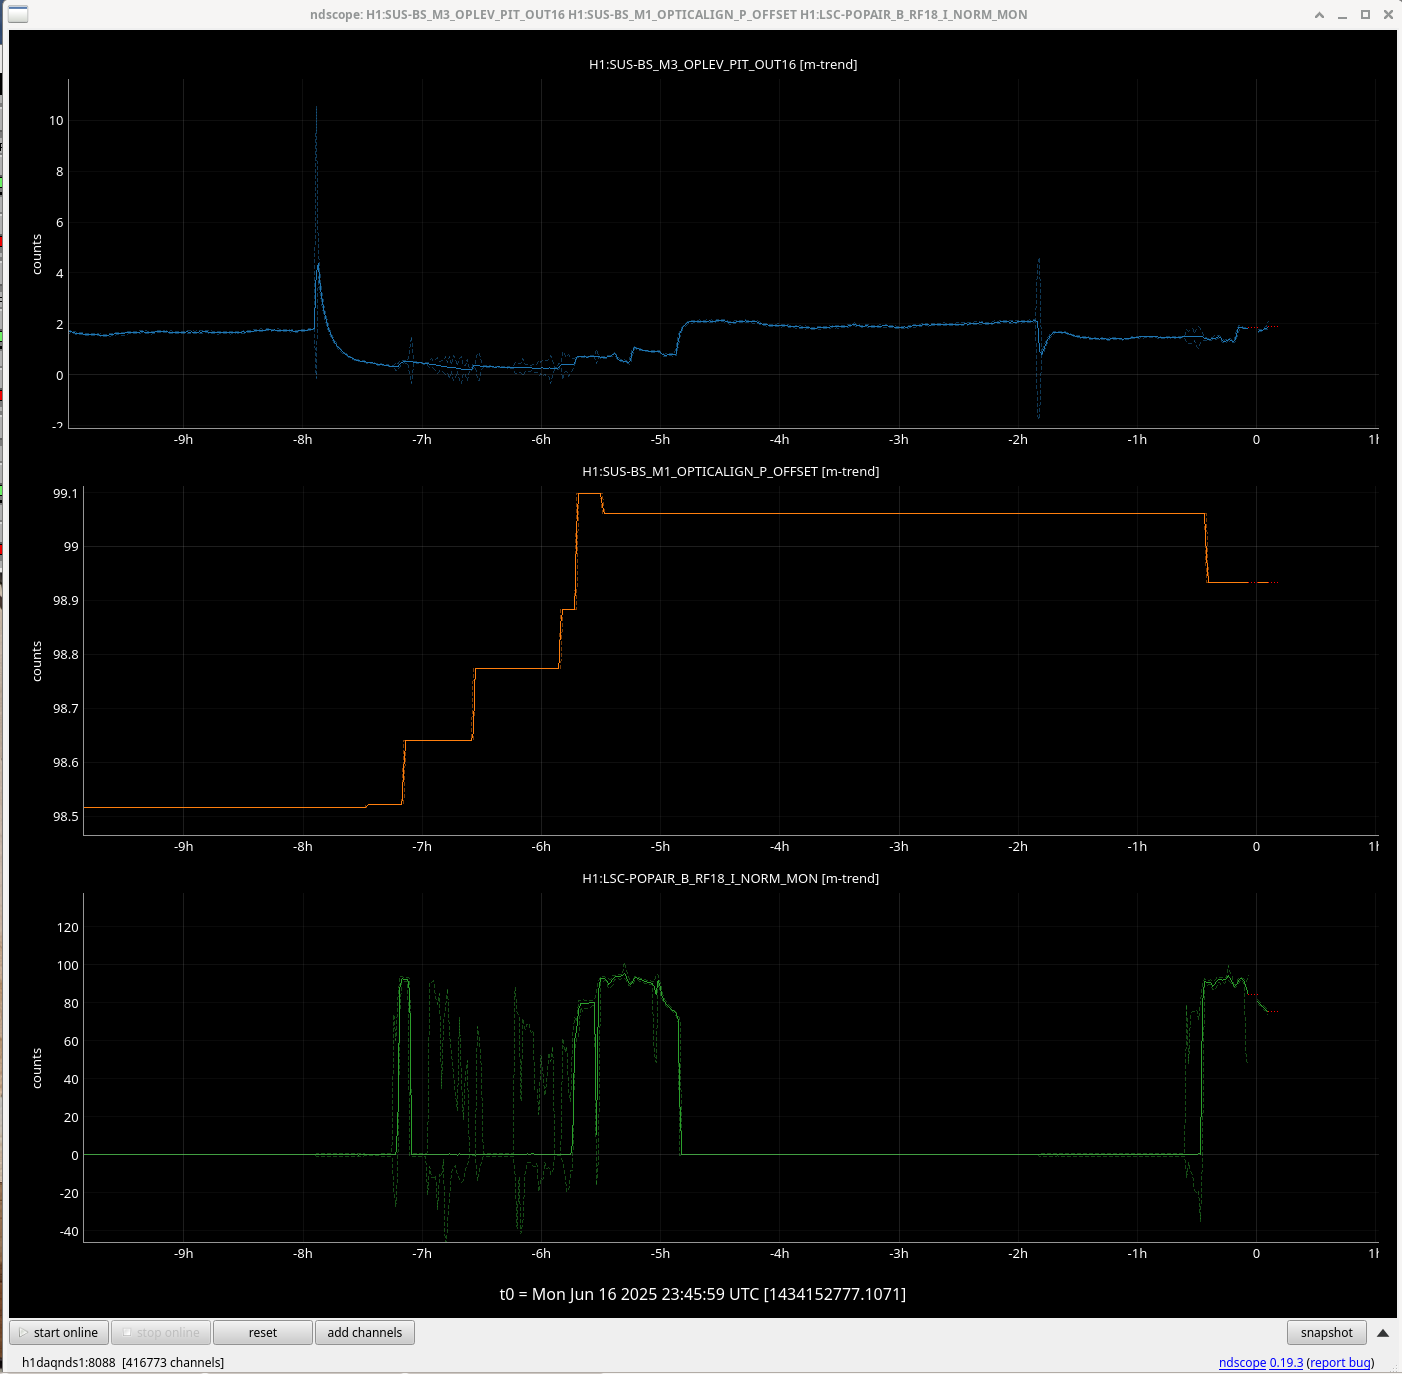
This 'slow let-go' mode for BS pitch certainly makes the behavior of the BS pit oplev qualitatively different.
In the attached plots, the sharp spike up and decay down behavior around -8 hours is how it had been looking for a long time (as Camilla notes in previous logs in this thread). Around -2 hours we lost lock from NomLowNoise, and while we do get a glitch upon lockloss, the BS doesn't seem to move quite as much, and is mostly flattened out after a shorter amount of time. I also note that this time (-2 hours ago) we didn't need to do an initial alignment (which was done at the -8 hours ago time). However, as Jeff pointed out, we held at DOWN for a while to reconcile SDFs, it's not quite a fair comparison.
We'll see how things go, but there's at least a chance that this will help reduce the need for initial alignments. If needed, we can try to tweak the time constant of the 'soft let-go' to further make the optical lever signal stay more overall flat.
The SUSBS SDF safe.snap file is saved with FM1 off, so that it won't get turned back on in SDF revert. The PREP_PRMI_ASC and PREP_DRMI_ASC states both re-enable FM1 - I may need to go through and ensure it's on for MICH initial alignment.
RyanS, Jenne
We've looked at a couple of times that the BS has been let go of slowly, and it seems like the cooldown time is usually about 17 minutes until it's basically done and at where it wants to be for the next acquisition of DRMI. Attached is one such example.
Alternatively, a day or so ago Tony had to do an initial alignment. On that day, it seemed like the BS took much longer to get to its quiescent spot. I'm not yet sure why the behavior is different sometimes.
Tony is working on taking a look at our average reacquisition time, which will help tell us whether we should make another change to further improve the time it takes to get the BS to where it wants to be for acquisition.