edmond.merilh@LIGO.ORG - posted 09:07, Monday 27 March 2017 (35106)
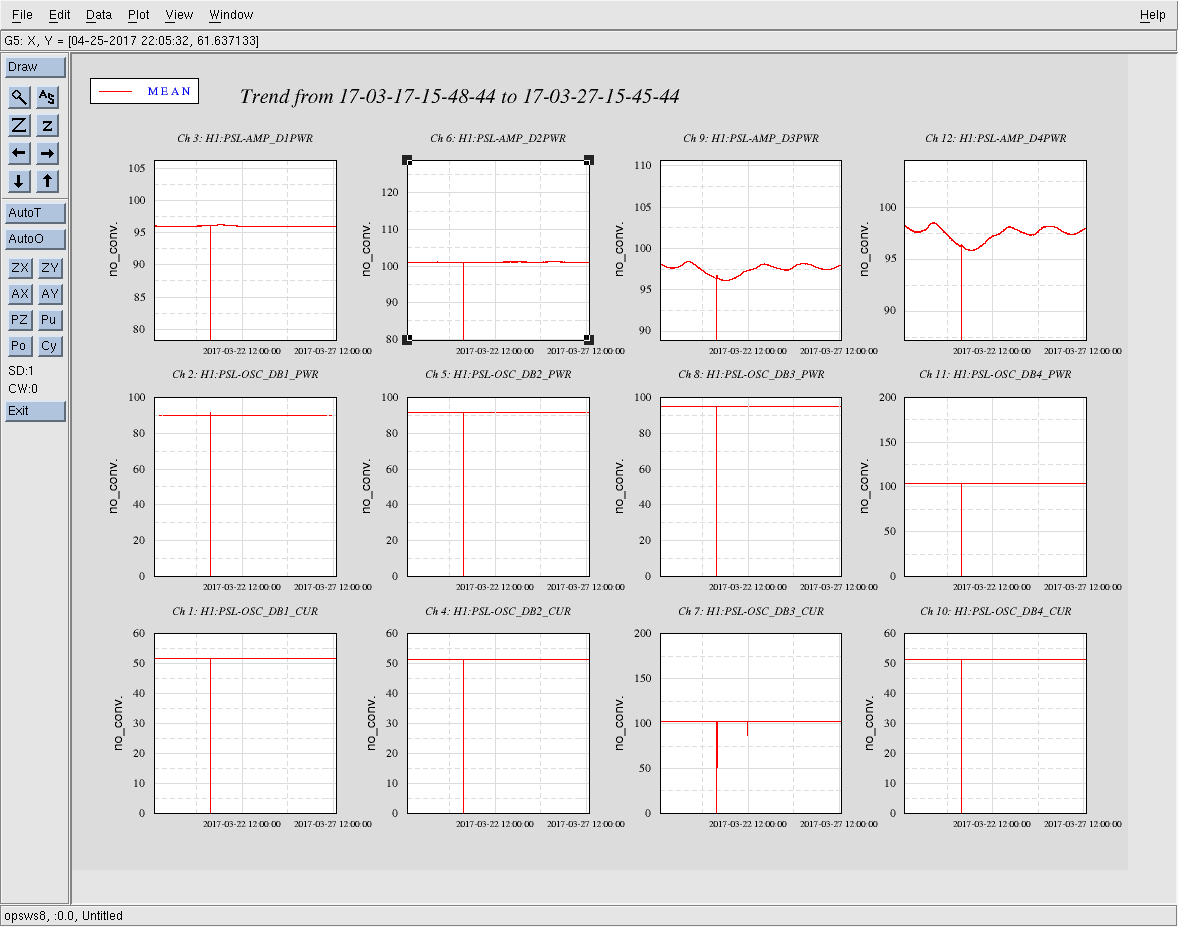
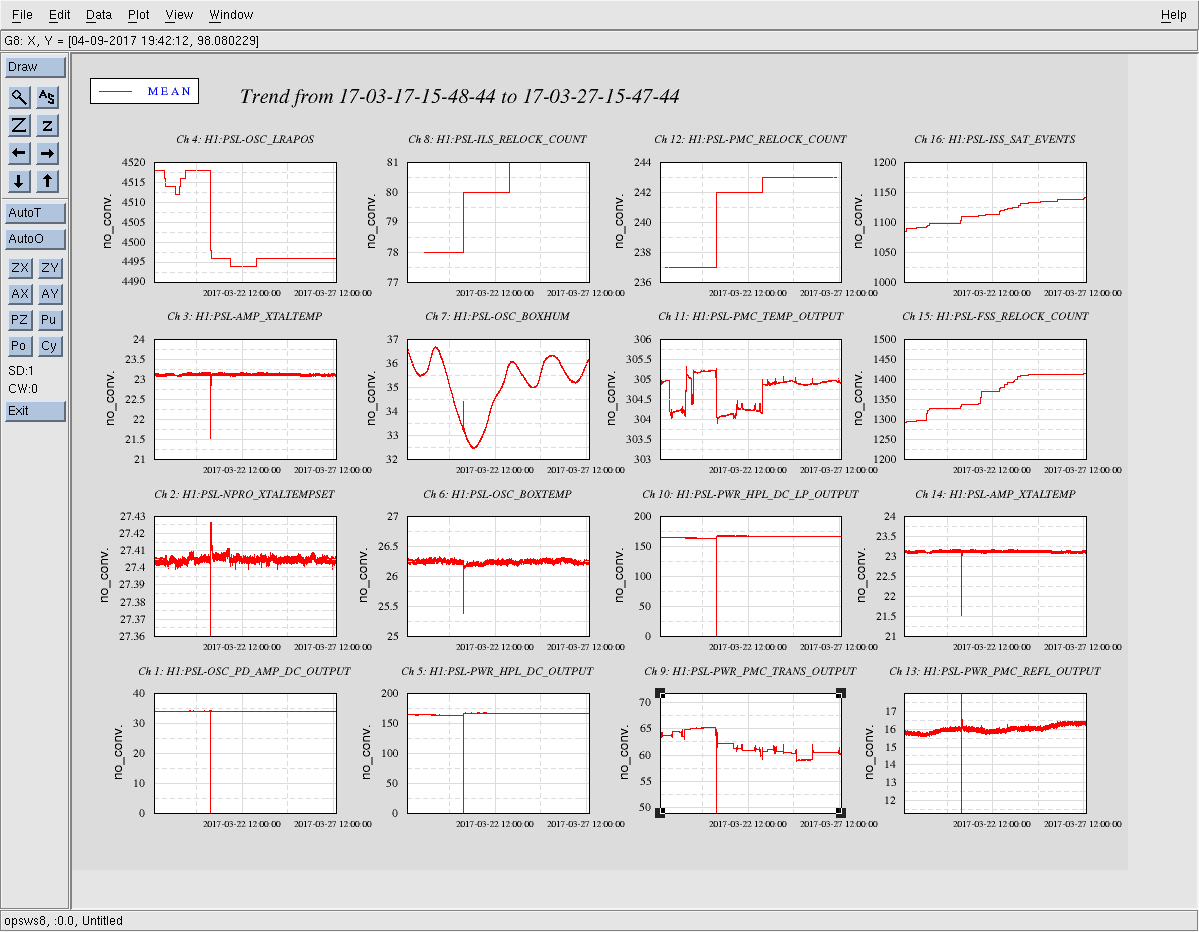
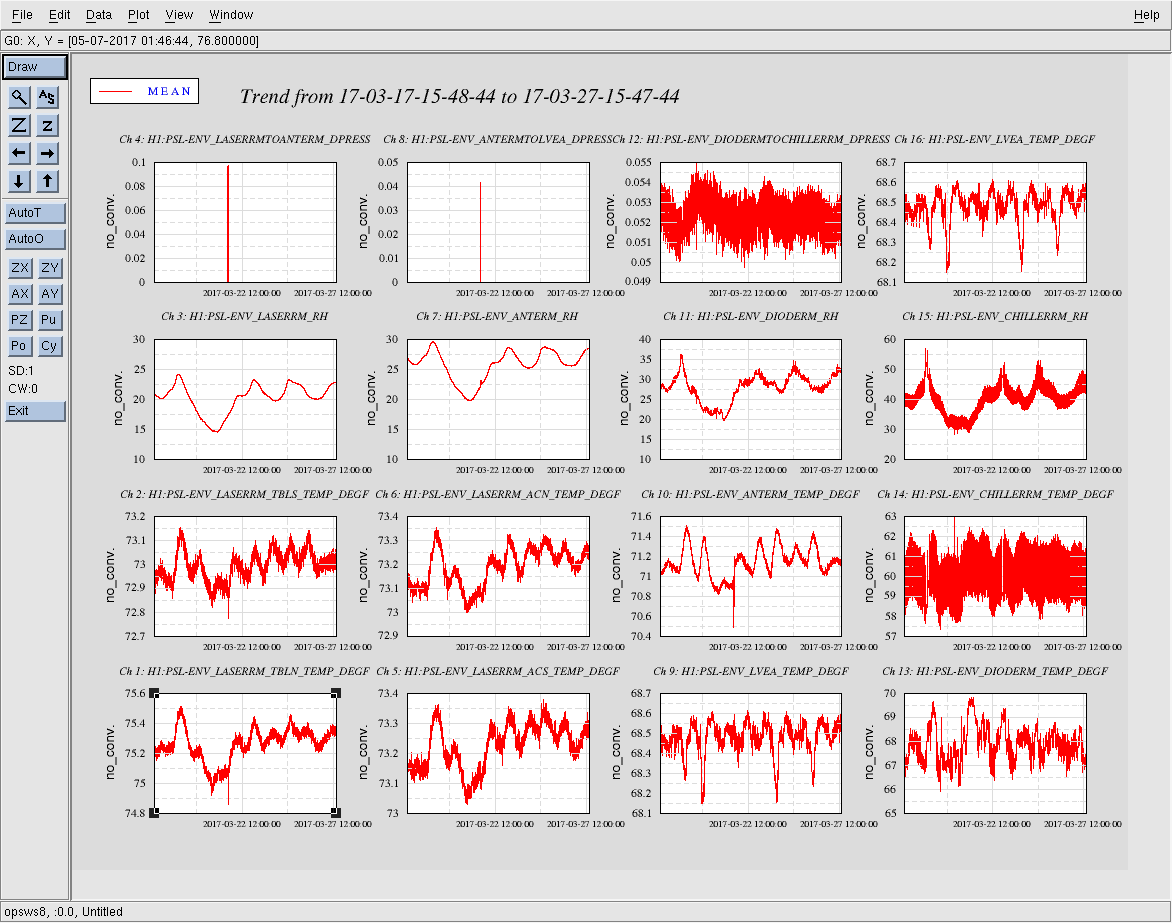
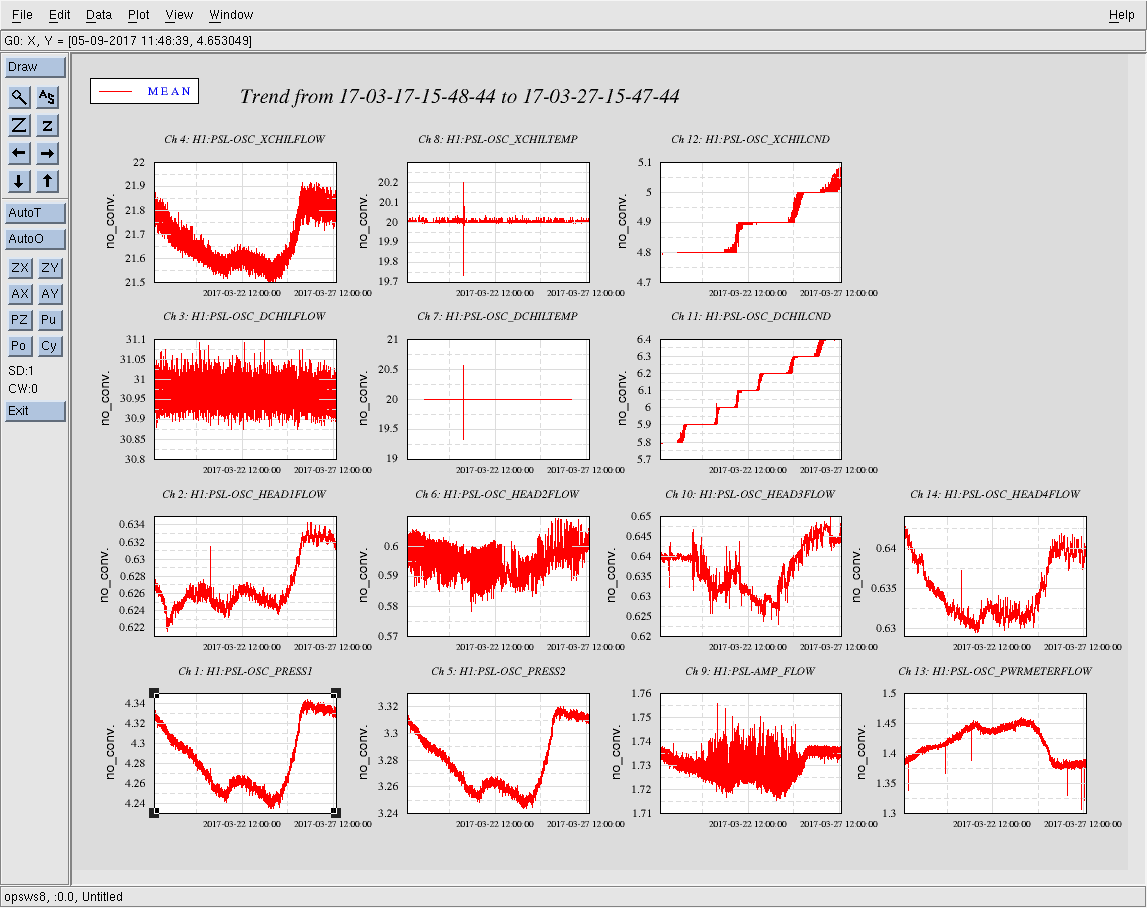
PSL 10 Day Weekly Trends: FAMIS #6141
Everything appears normal.
Images attached to this report
Everything appears normal.
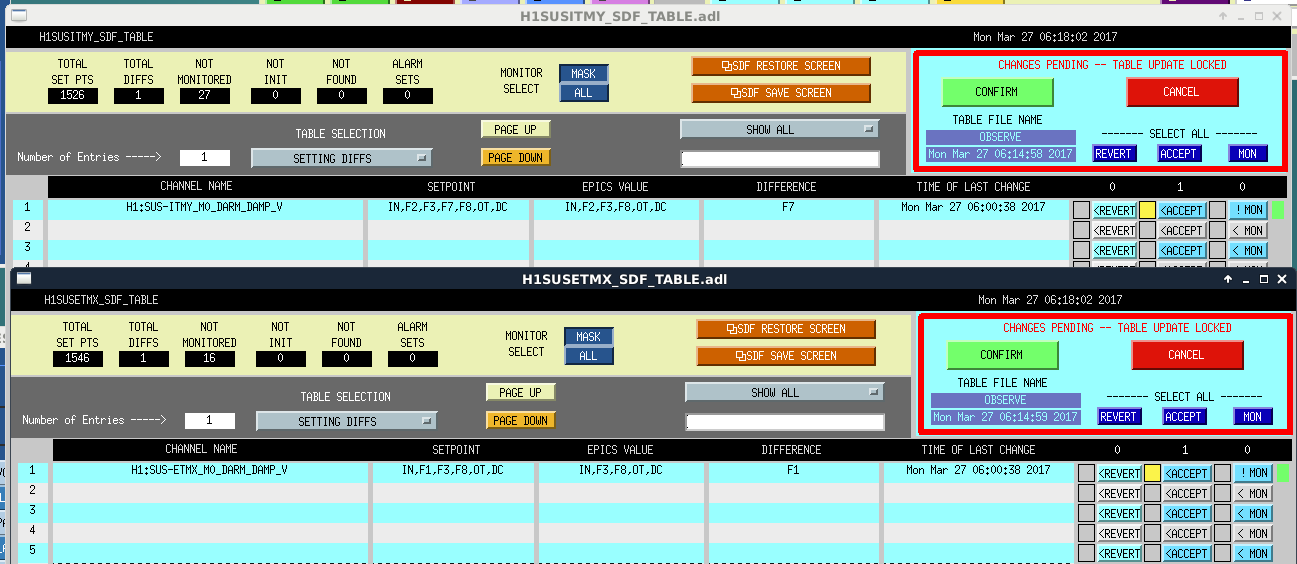
TITLE: 03/27 Owl Shift: 07:00-15:00 UTC (00:00-08:00 PST), all times posted in UTC
STATE of H1: Observing at 63Mpc
INCOMING OPERATOR: Jim
SHIFT SUMMARY: One lock loss from 6.1 mag earthquake west of Alaska. No issues relocking after seismic settled down. Accepted SDF differences from Cheryl's bounce mode damping filter changes.
LOG:

07:22 UTC Powercycled video0
11:13 UTC Lock loss (earthquake). Set to down. Set observing bit to earthquake.
13:18 UTC Back to observing. Accepted SDF differences for Cheryl's bounce mode damping filter changes (see attached).
13:25 UTC Powercycled video2
13:40 UTC Damped PI mode 27 by changing phase from -80 to 0
13:48 UTC Damped PI mode 27 by changing phase to 20
14:09 UTC Bubba to mid Y with Apollo to work on HVAC controls
15:12 UTC Balers are at mid X and working towards end X
15:14 UTC Damped PI mode 28 by changing sign of gain
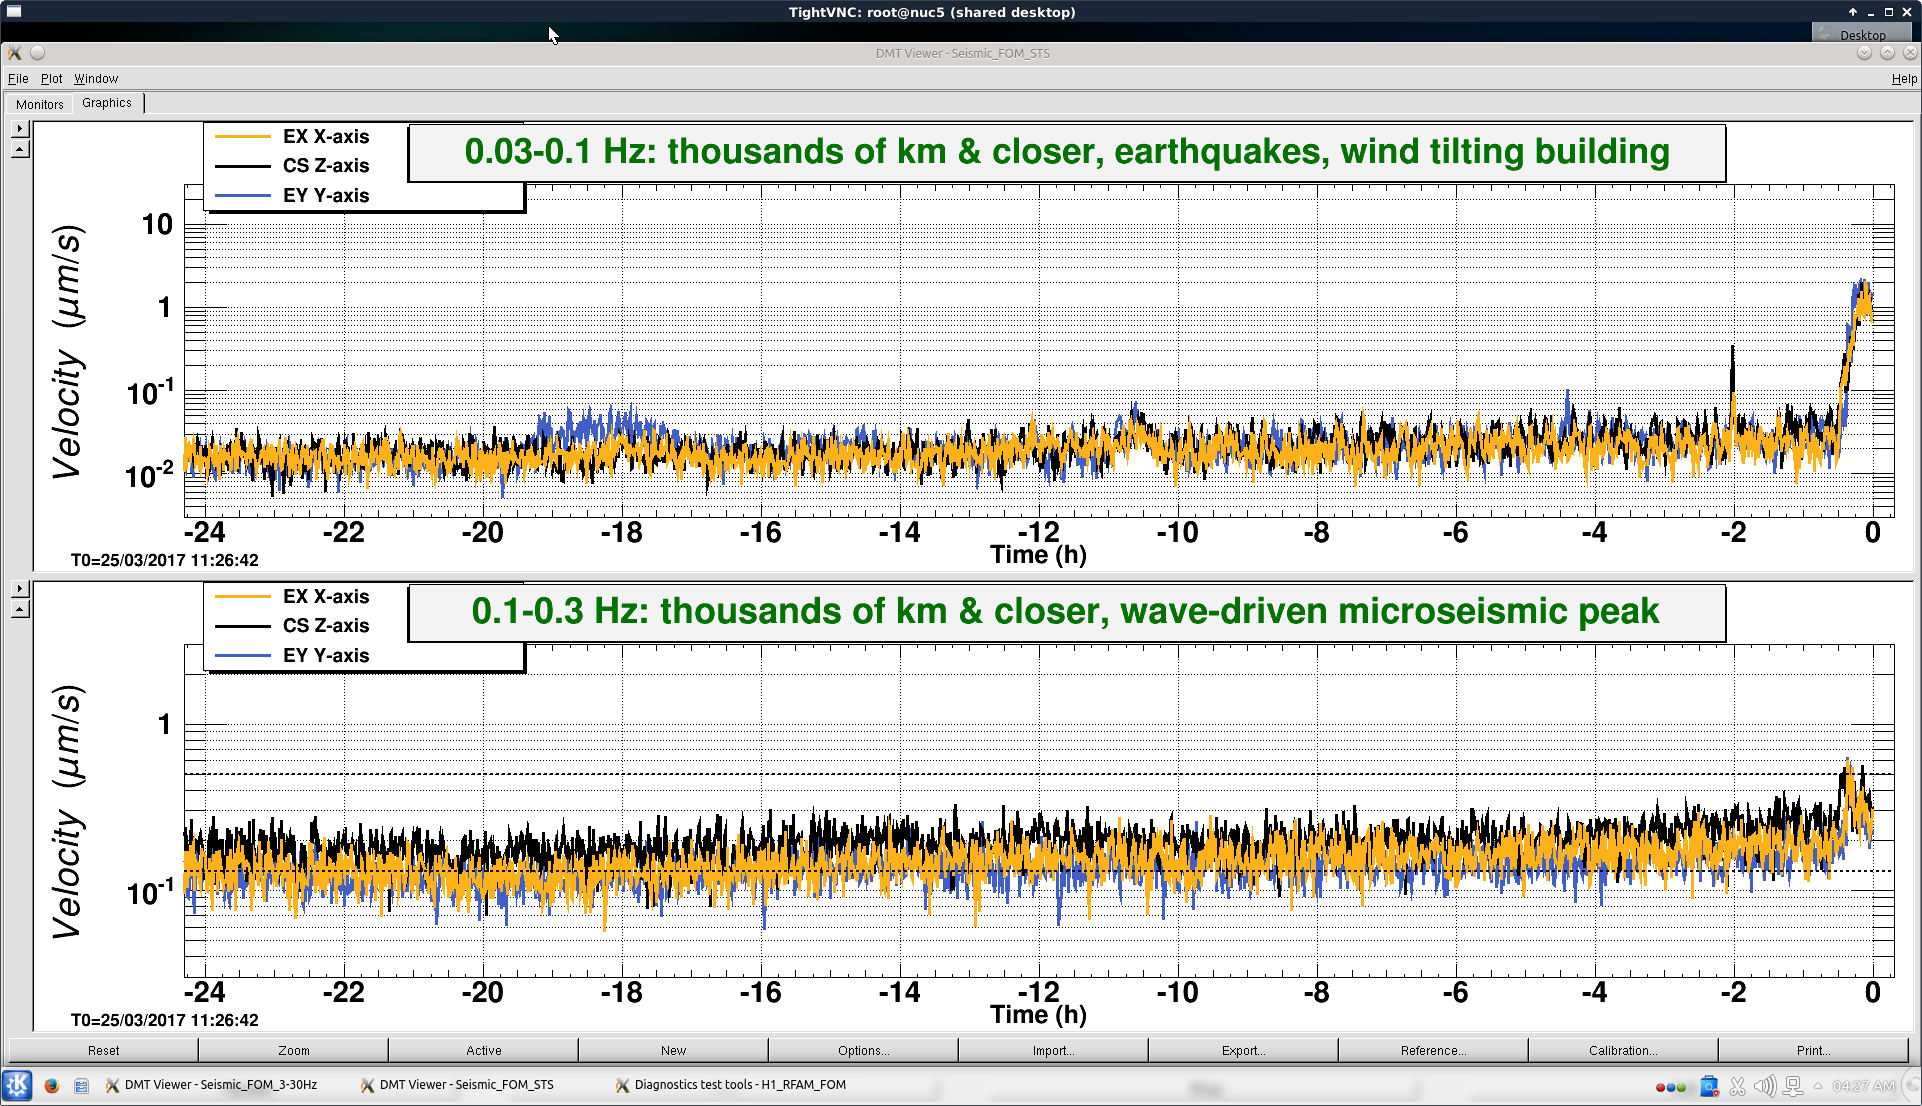
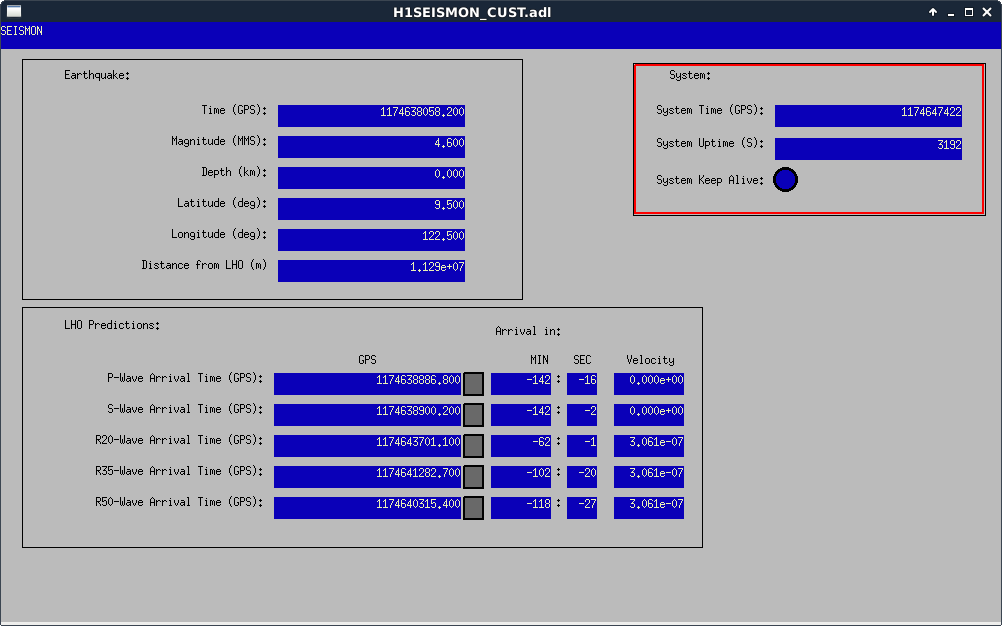
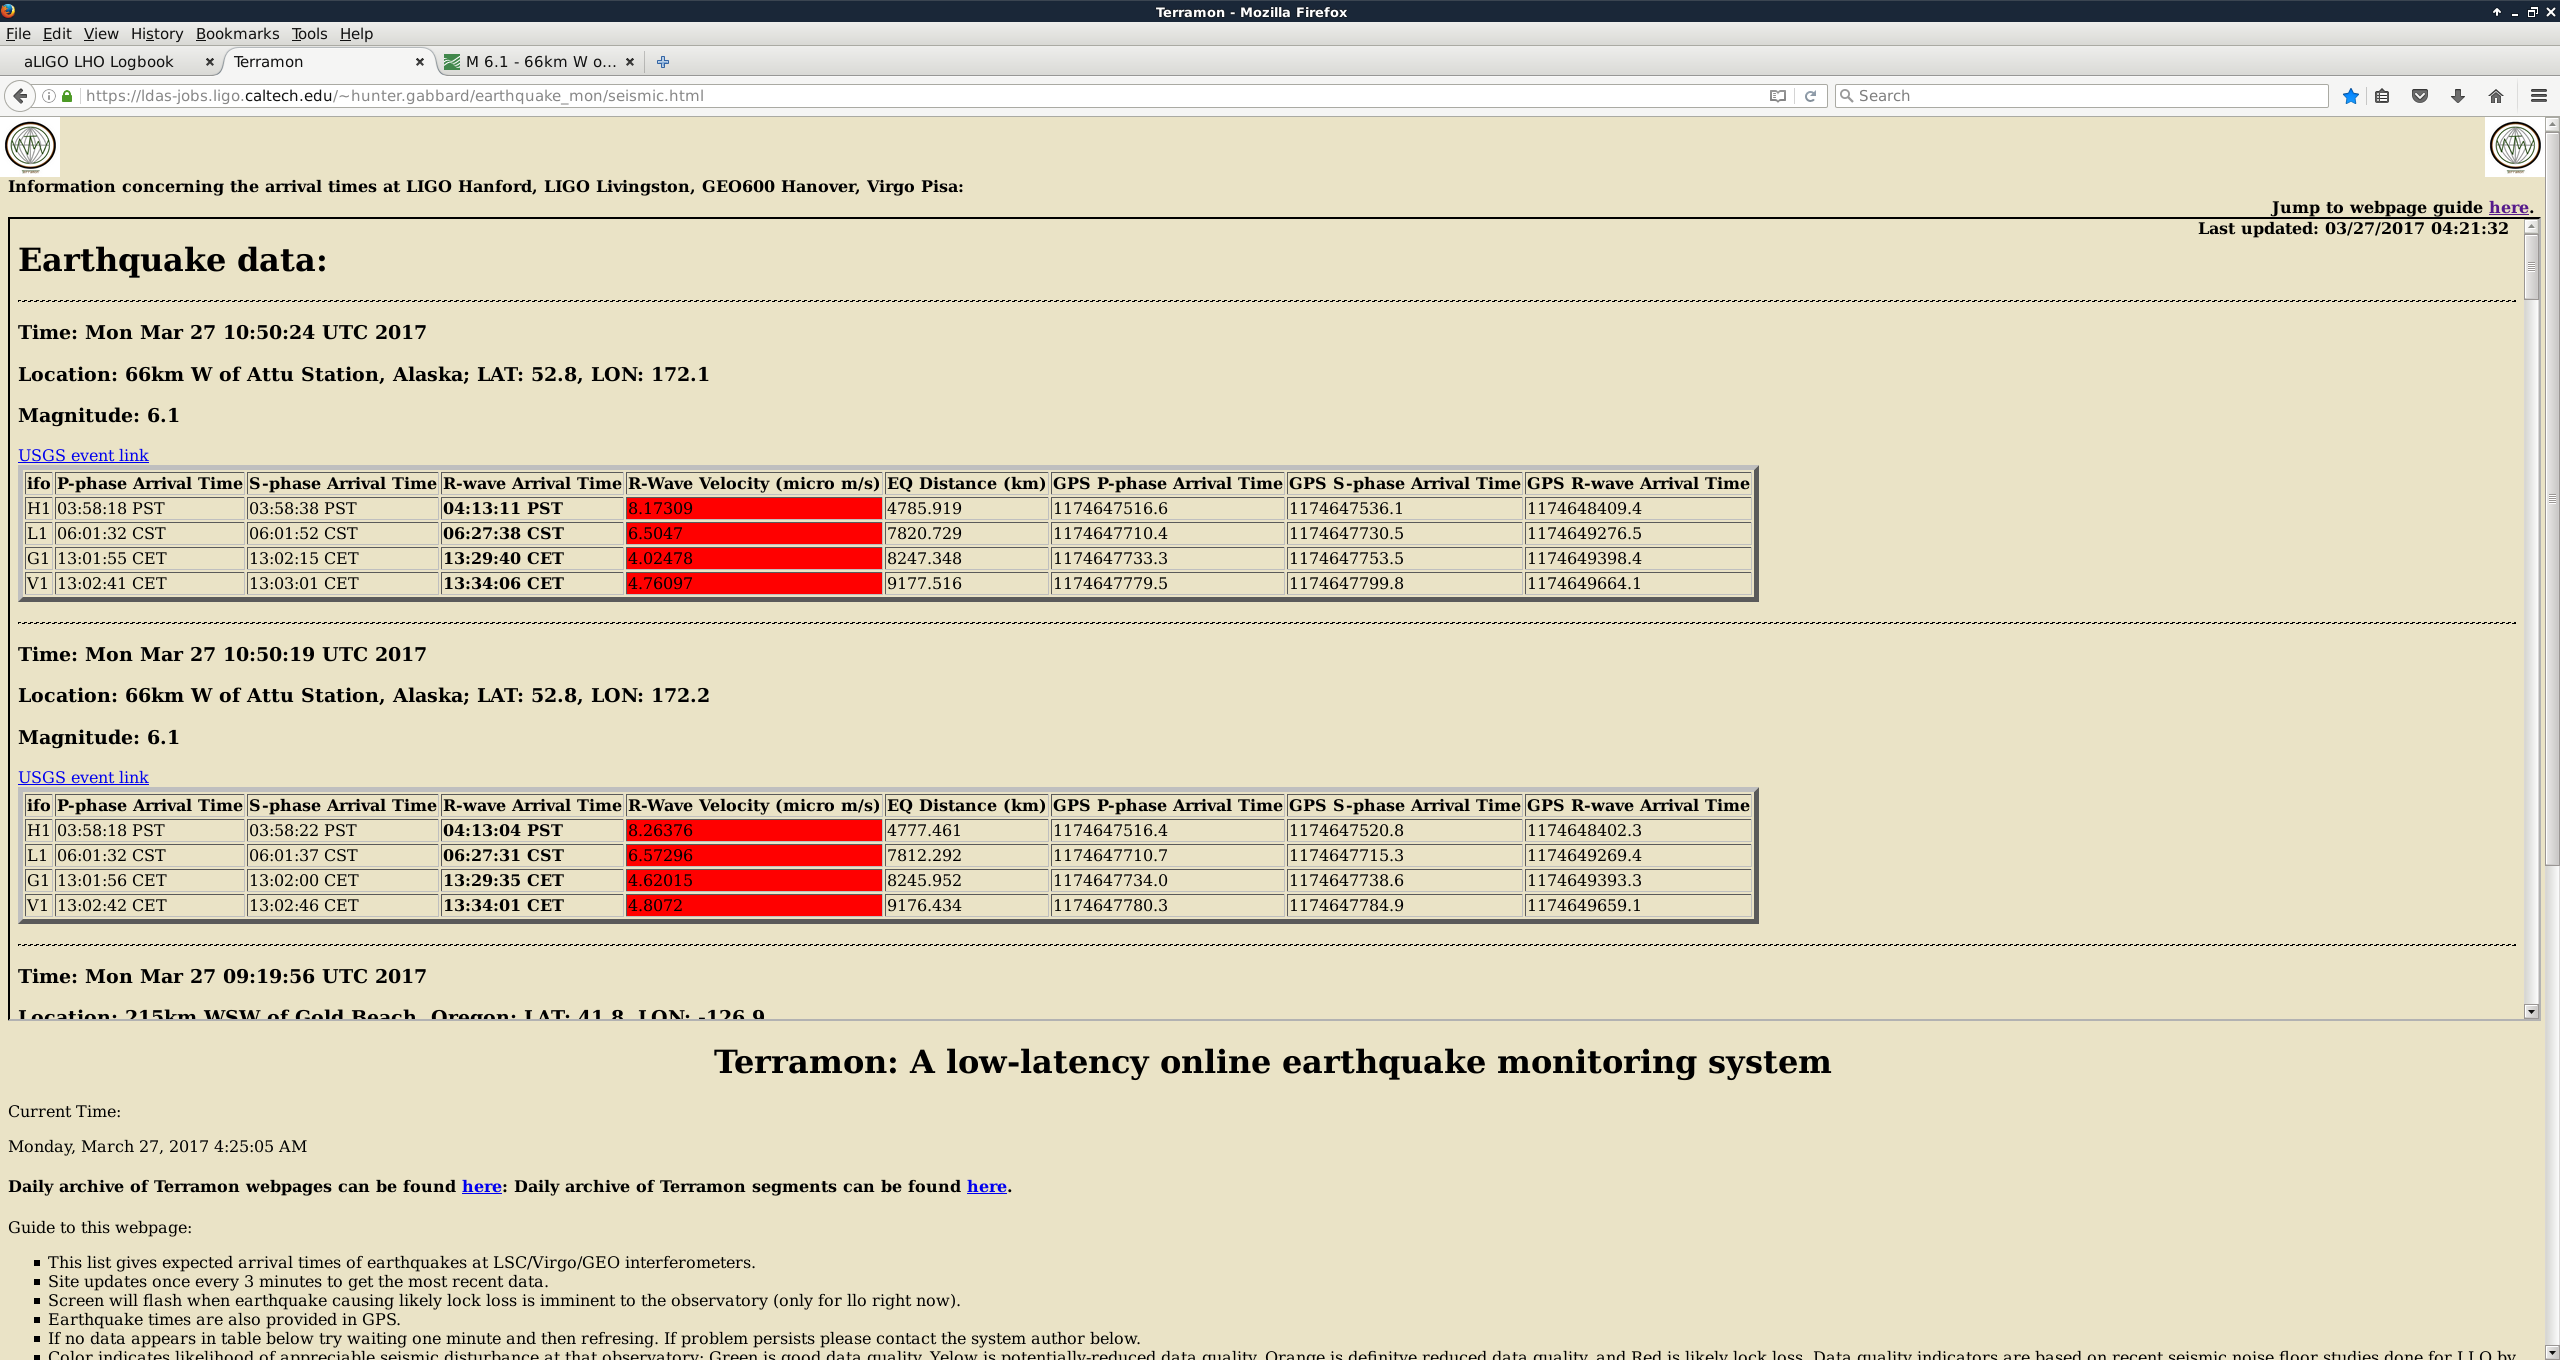
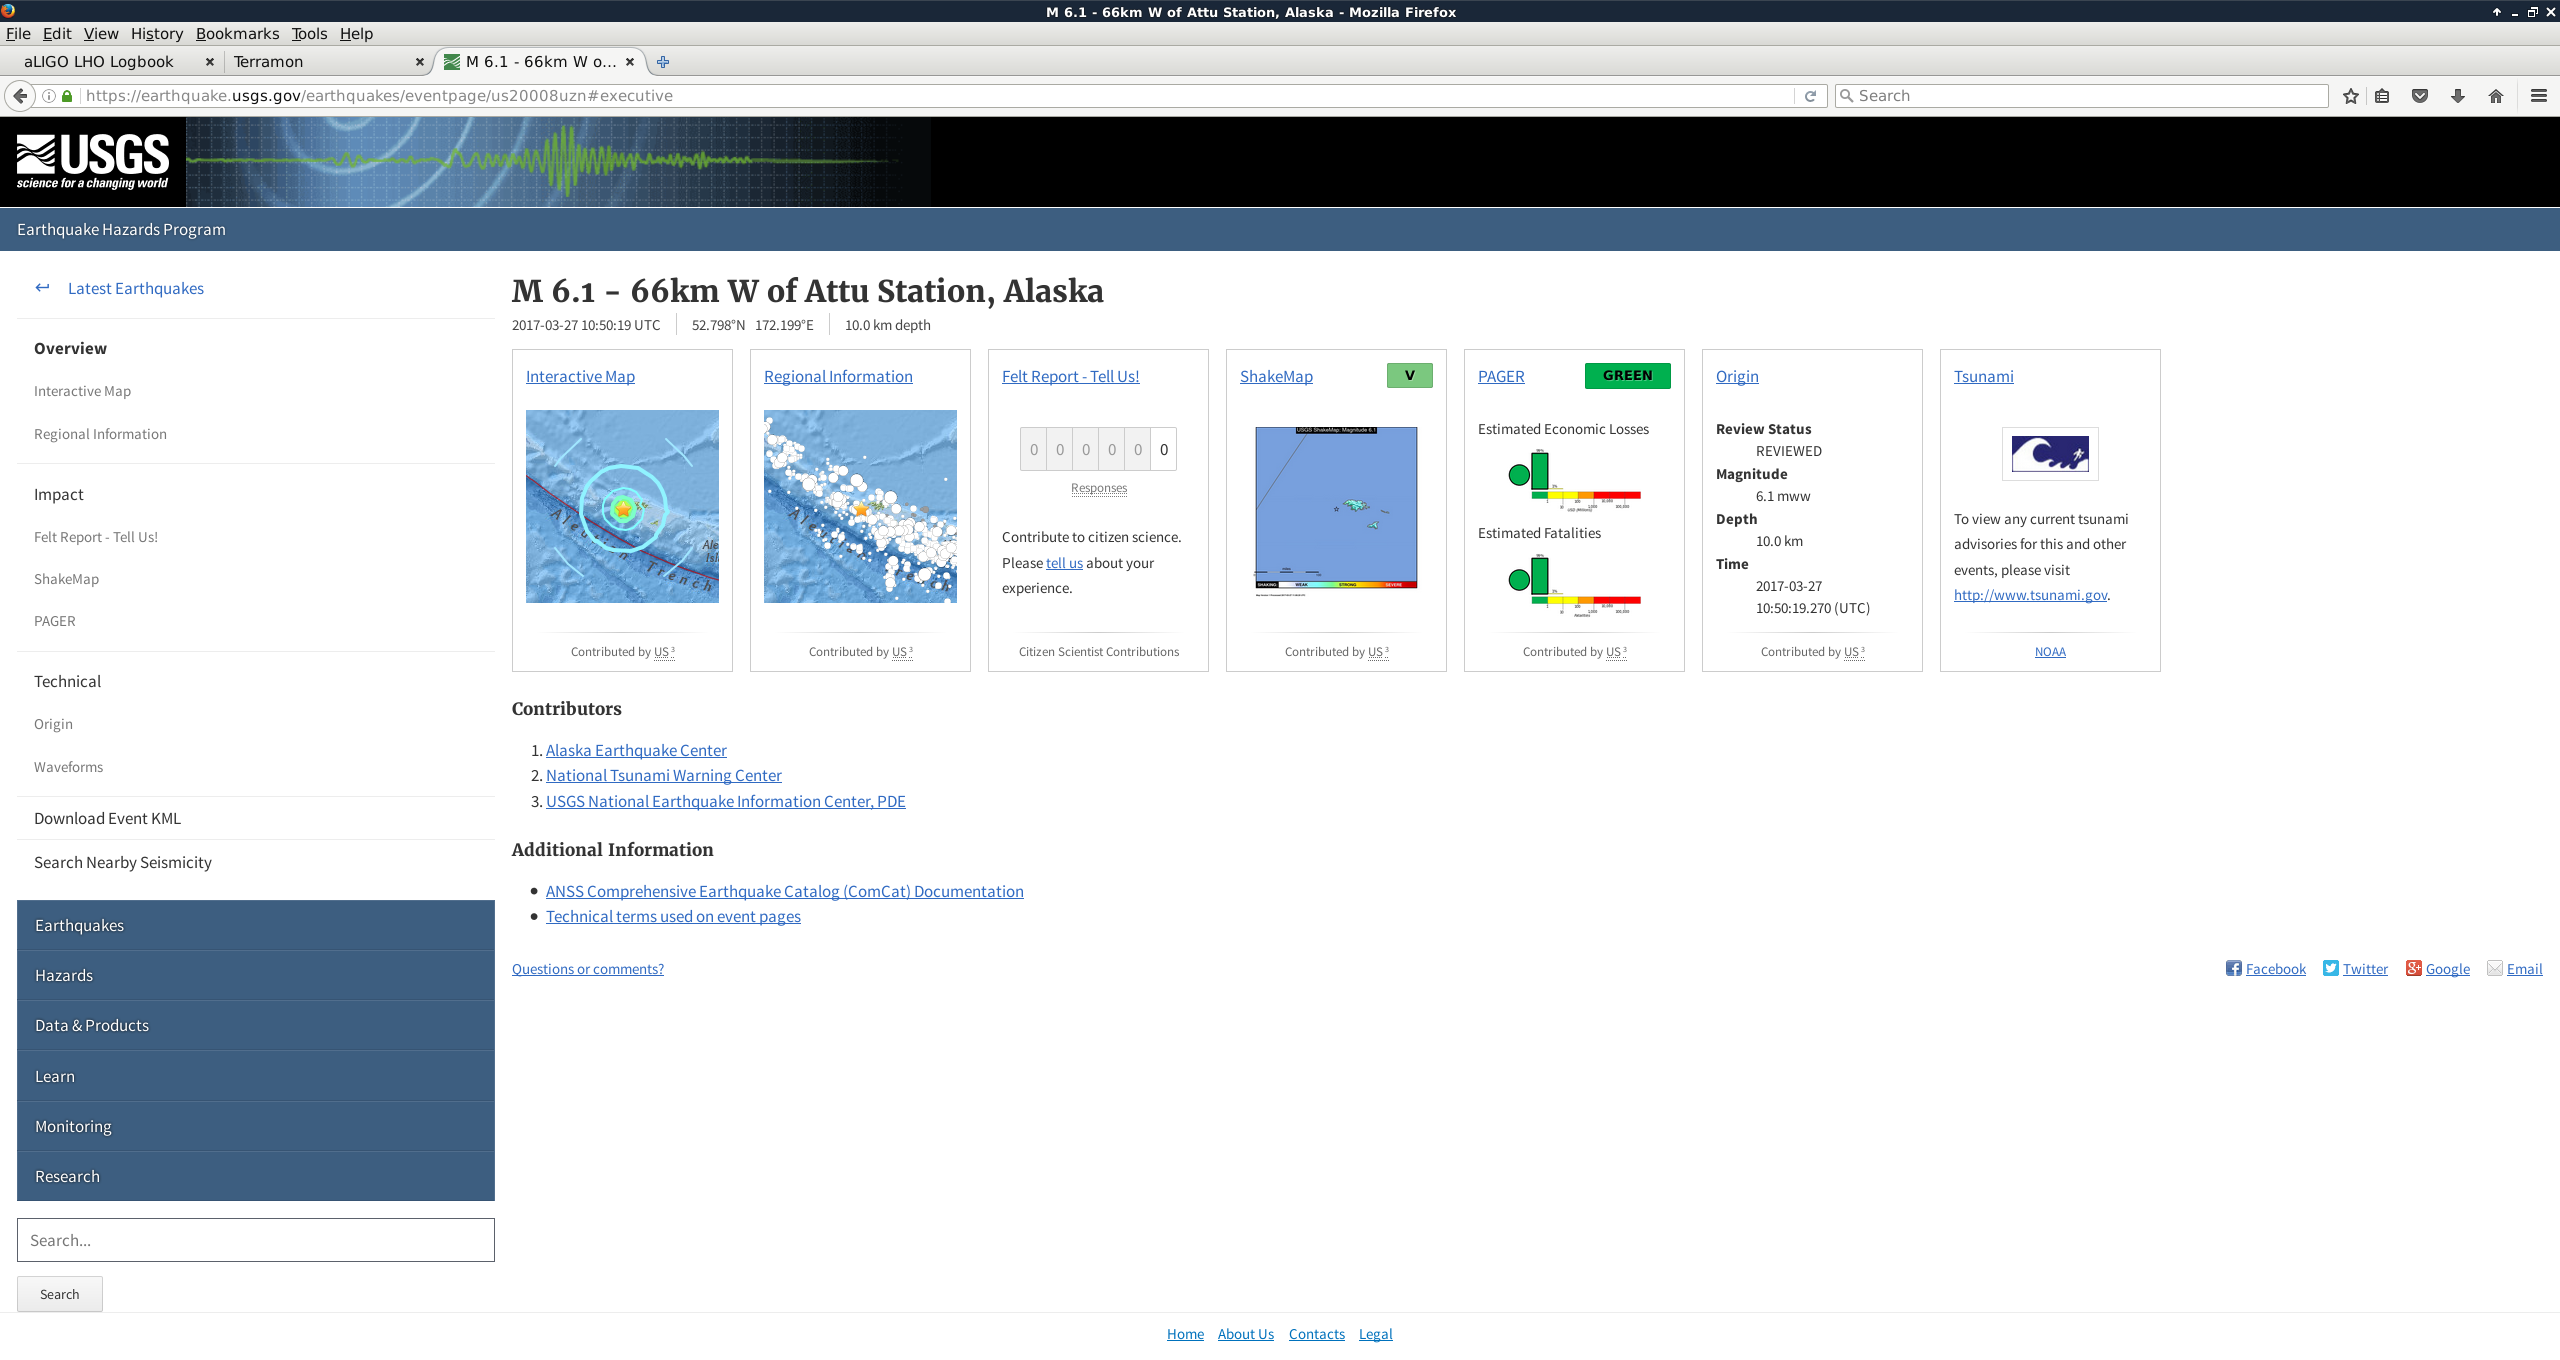
6.1 Attu Station, Alaska

Was it reported by Terramon, USGS, SEISMON? Yes (twice), Yes, No

Magnitude (according to Terramon, USGS, SEISMON): 6.1, 6.1, NA

Location: 66km W of Attu Station, Alaska; 52.798°N   172.199°E

Starting time of event (ie. when BLRMS started to increase on DMT on the wall): ~10:58 UTC

Lock status? Both L1 and H1 lost lock.

EQ reported by Terramon BEFORE it actually arrived? Not sure
Have remained in observing. No issues to report.
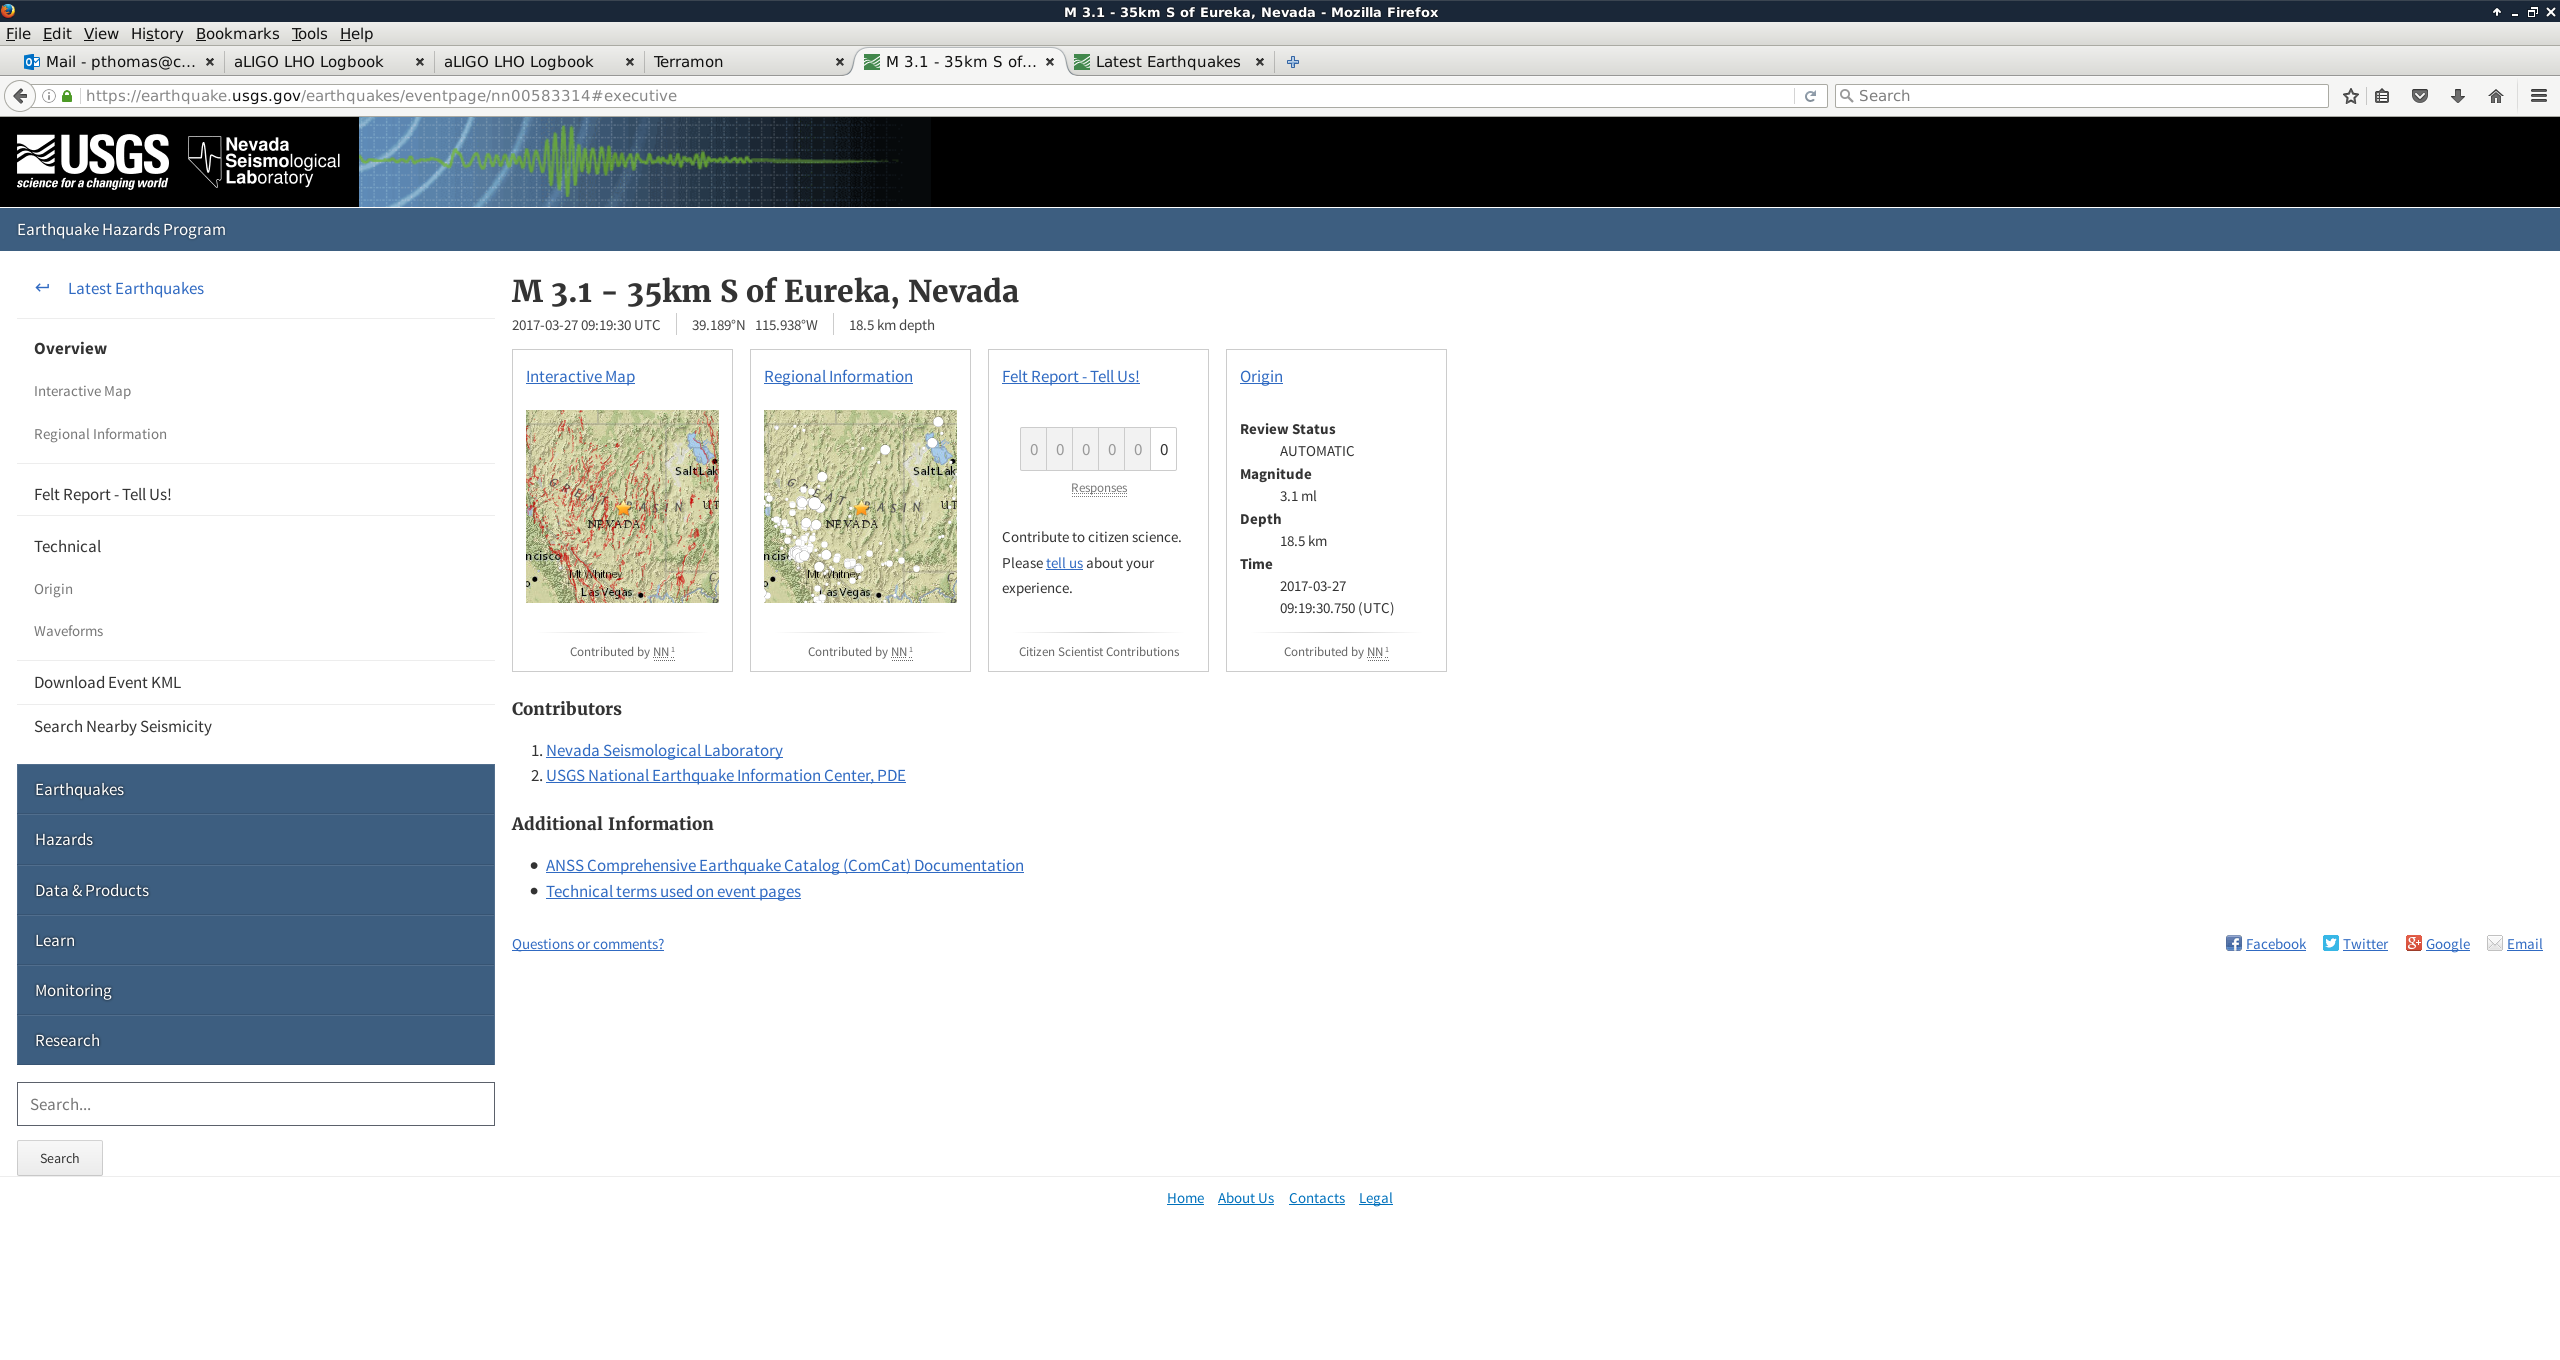
3.1 Eureka, Nevada

Was it reported by Terramon, USGS, SEISMON? Yes, Yes, No

Magnitude (according to Terramon, USGS, SEISMON): 3.1, 3.1, NA

Location: 35km S of Eureka, Nevada; 39.189°N   115.938°W

Starting time of event (ie. when BLRMS started to increase on DMT on the wall): ~9:24 UTC

Lock status? H1 stayed locked, L1 broke lock, but L1 operator says not likely due to earthquake

EQ reported by Terramon BEFORE it actually arrived? Not sure
TITLE: 03/27 Owl Shift: 07:00-15:00 UTC (00:00-08:00 PST), all times posted in UTC
STATE of H1: Observing at 68Mpc
OUTGOING OPERATOR: Cheryl
CURRENT ENVIRONMENT:
    Wind: 7mph Gusts, 5mph 5min avg
    Primary useism: 0.03 μm/s
    Secondary useism: 0.24 μm/s
QUICK SUMMARY:

No issues to report.
TITLE: 03/27 Eve Shift: 23:00-07:00 UTC (16:00-00:00 PST), all times posted in UTC
STATE of H1: Observing at 70Mpc
INCOMING OPERATOR: Patrick
SHIFT SUMMARY: locked
LOG: 04:02:20UTC, a glitch seen in BS Oplev
TITLE: 03/26 Eve Shift: 23:00-07:00 UTC (16:00-00:00 PST), all times posted in UTC
STATE of H1: Observing at 68Mpc
OUTGOING OPERATOR: Jim
CURRENT ENVIRONMENT:
Wind: 7mph Gusts, 5mph 5min avg
Primary useism: 0.02 μm/s
Secondary useism: 0.23 μm/s
QUICK SUMMARY: locked 22 hours, steady range
TITLE: 03/26 Day Shift: 15:00-23:00 UTC (08:00-16:00 PST), all times posted in UTC
STATE of H1: Observing at 70Mpc
INCOMING OPERATOR: Cheryl
SHIFT SUMMARY:
LOG:
Lock is 21+hours old, everything was pretty quiet today.
TITLE: 03/26 Owl Shift: 07:00-15:00 UTC (00:00-08:00 PST), all times posted in UTC
STATE of H1: Observing at 64Mpc
INCOMING OPERATOR: Jim
SHIFT SUMMARY: Only out of observing to run a2l when LLO lost lock.
LOG:

11:38 UTC LLO lost lock. Out of observing to run a2l.
11:44 UTC a2l done. Back to observing.
11:45 UTC GRB
Have remained in observing. No issues to report.
TITLE: 03/26 Owl Shift: 07:00-15:00 UTC (00:00-08:00 PST), all times posted in UTC
STATE of H1: Observing at 65Mpc
OUTGOING OPERATOR: Cheryl
CURRENT ENVIRONMENT:
    Wind: 5mph Gusts, 4mph 5min avg
    Primary useism: 0.02 μm/s
    Secondary useism: 0.22 μm/s
QUICK SUMMARY:

No issues to report.
TITLE: 03/26 Eve Shift: 23:00-07:00 UTC (16:00-00:00 PST), all times posted in UTC
STATE of H1: Observing at 67Mpc
INCOMING OPERATOR: Patrick
SHIFT SUMMARY:
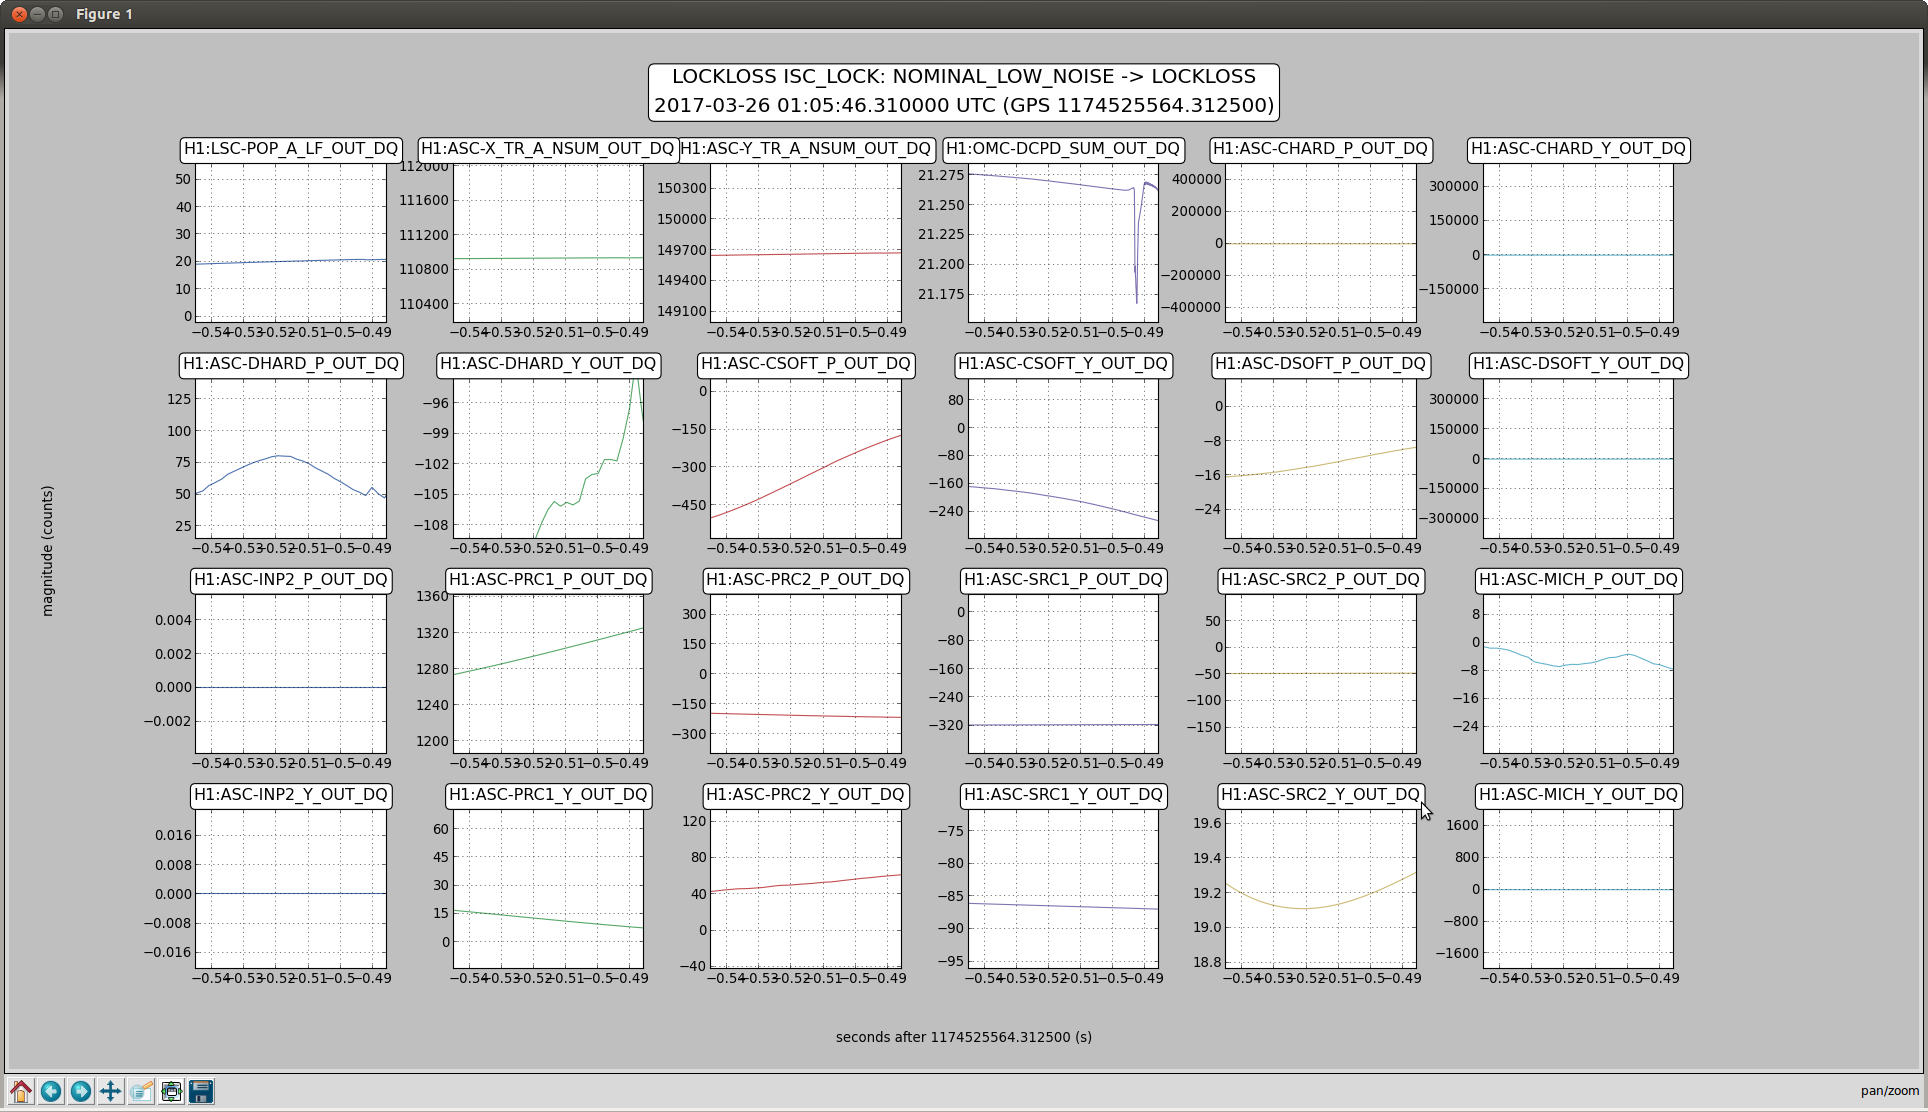
OMC DC SUM and DHARD Y seem to glitch at the same time
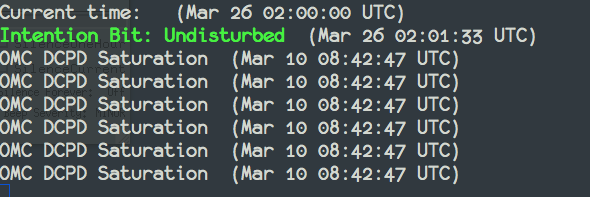
This is a classic case of "Middle-Click Syndrome". Someone highlighted that OMC DCPD line in the Verbal Terminal and then accidentally middle clicked later. I checked this by first checking the Verbal logs to make sure it wasn't in there, and then I went to the alarms work station and middle clicked in the Verbal Terminal. Sure enough, the same March 10 OMC DCPD saturation message showed up.
About an hour after coming on shift I noticed something in the CR air and put on my mask, but after a while it was clear that that didn't help, so I started looking for other things, and realized it sort of smelled like burnt plastic. Called Corey, Richard, Dave, and a couple other people. Turned off most of the CR computers (about 4 warm ones), checked the MSR, checked the Computer user's room, and the smell was only in the CR. Tried to contact Robert, waited, but then turned off his computer, and am now waiting to see if that computer was overheating, and if turning it off clears up the air.
Currently watching H1 from the Computer Users Room, and have Verbal Alarms running in here.
we were not able to pin down where the odor was coming from, and there are no odors today.
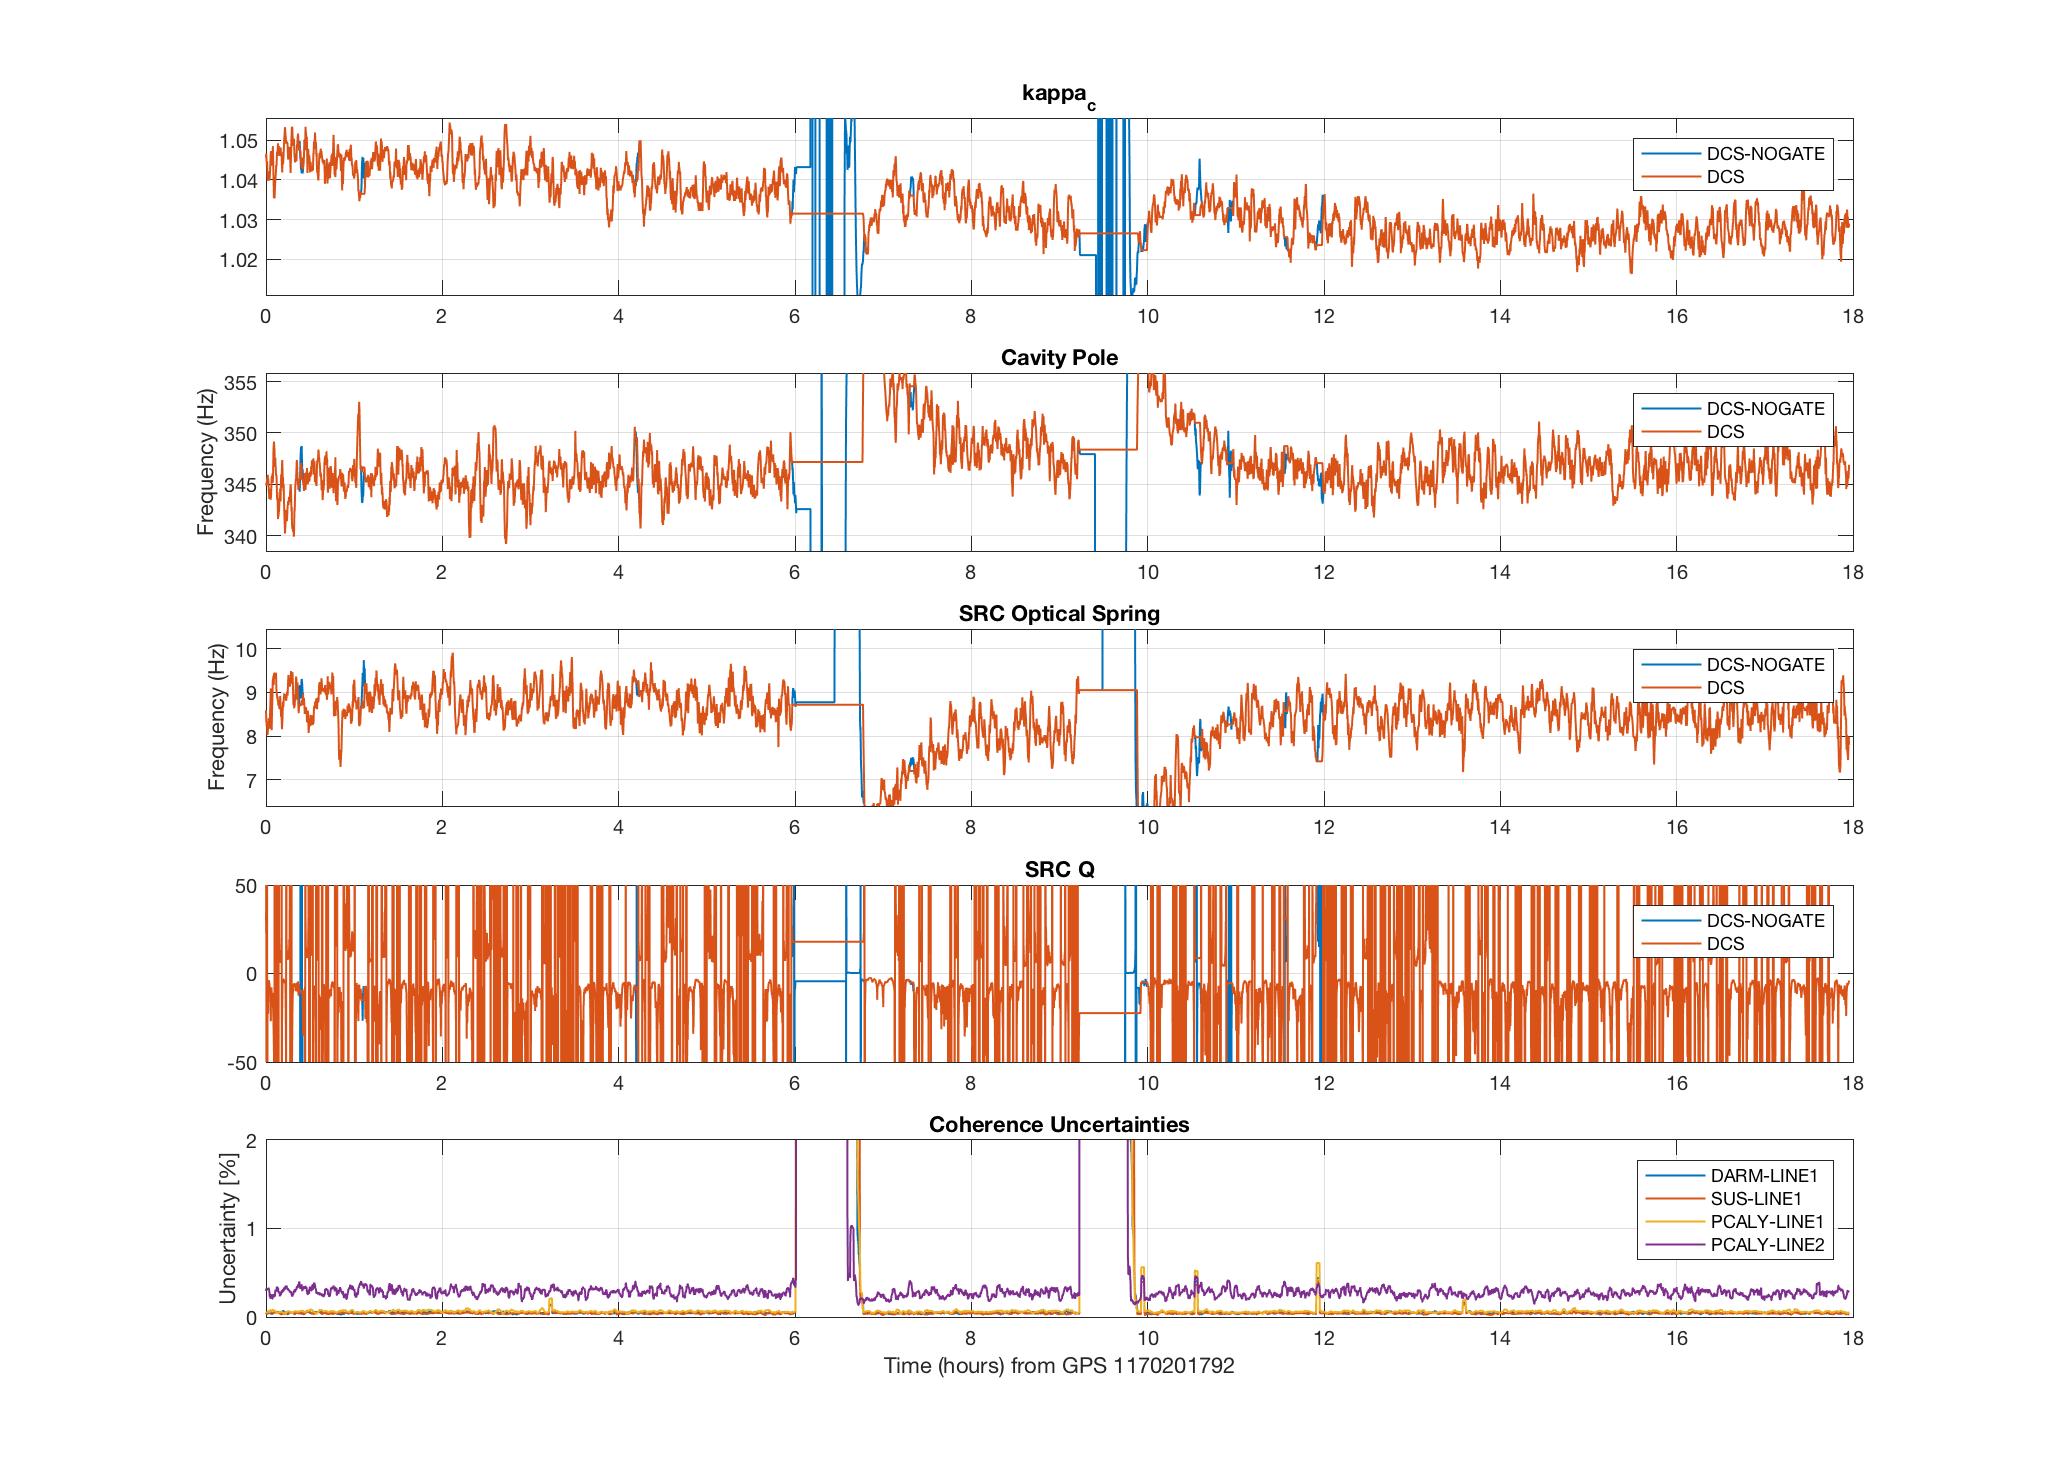
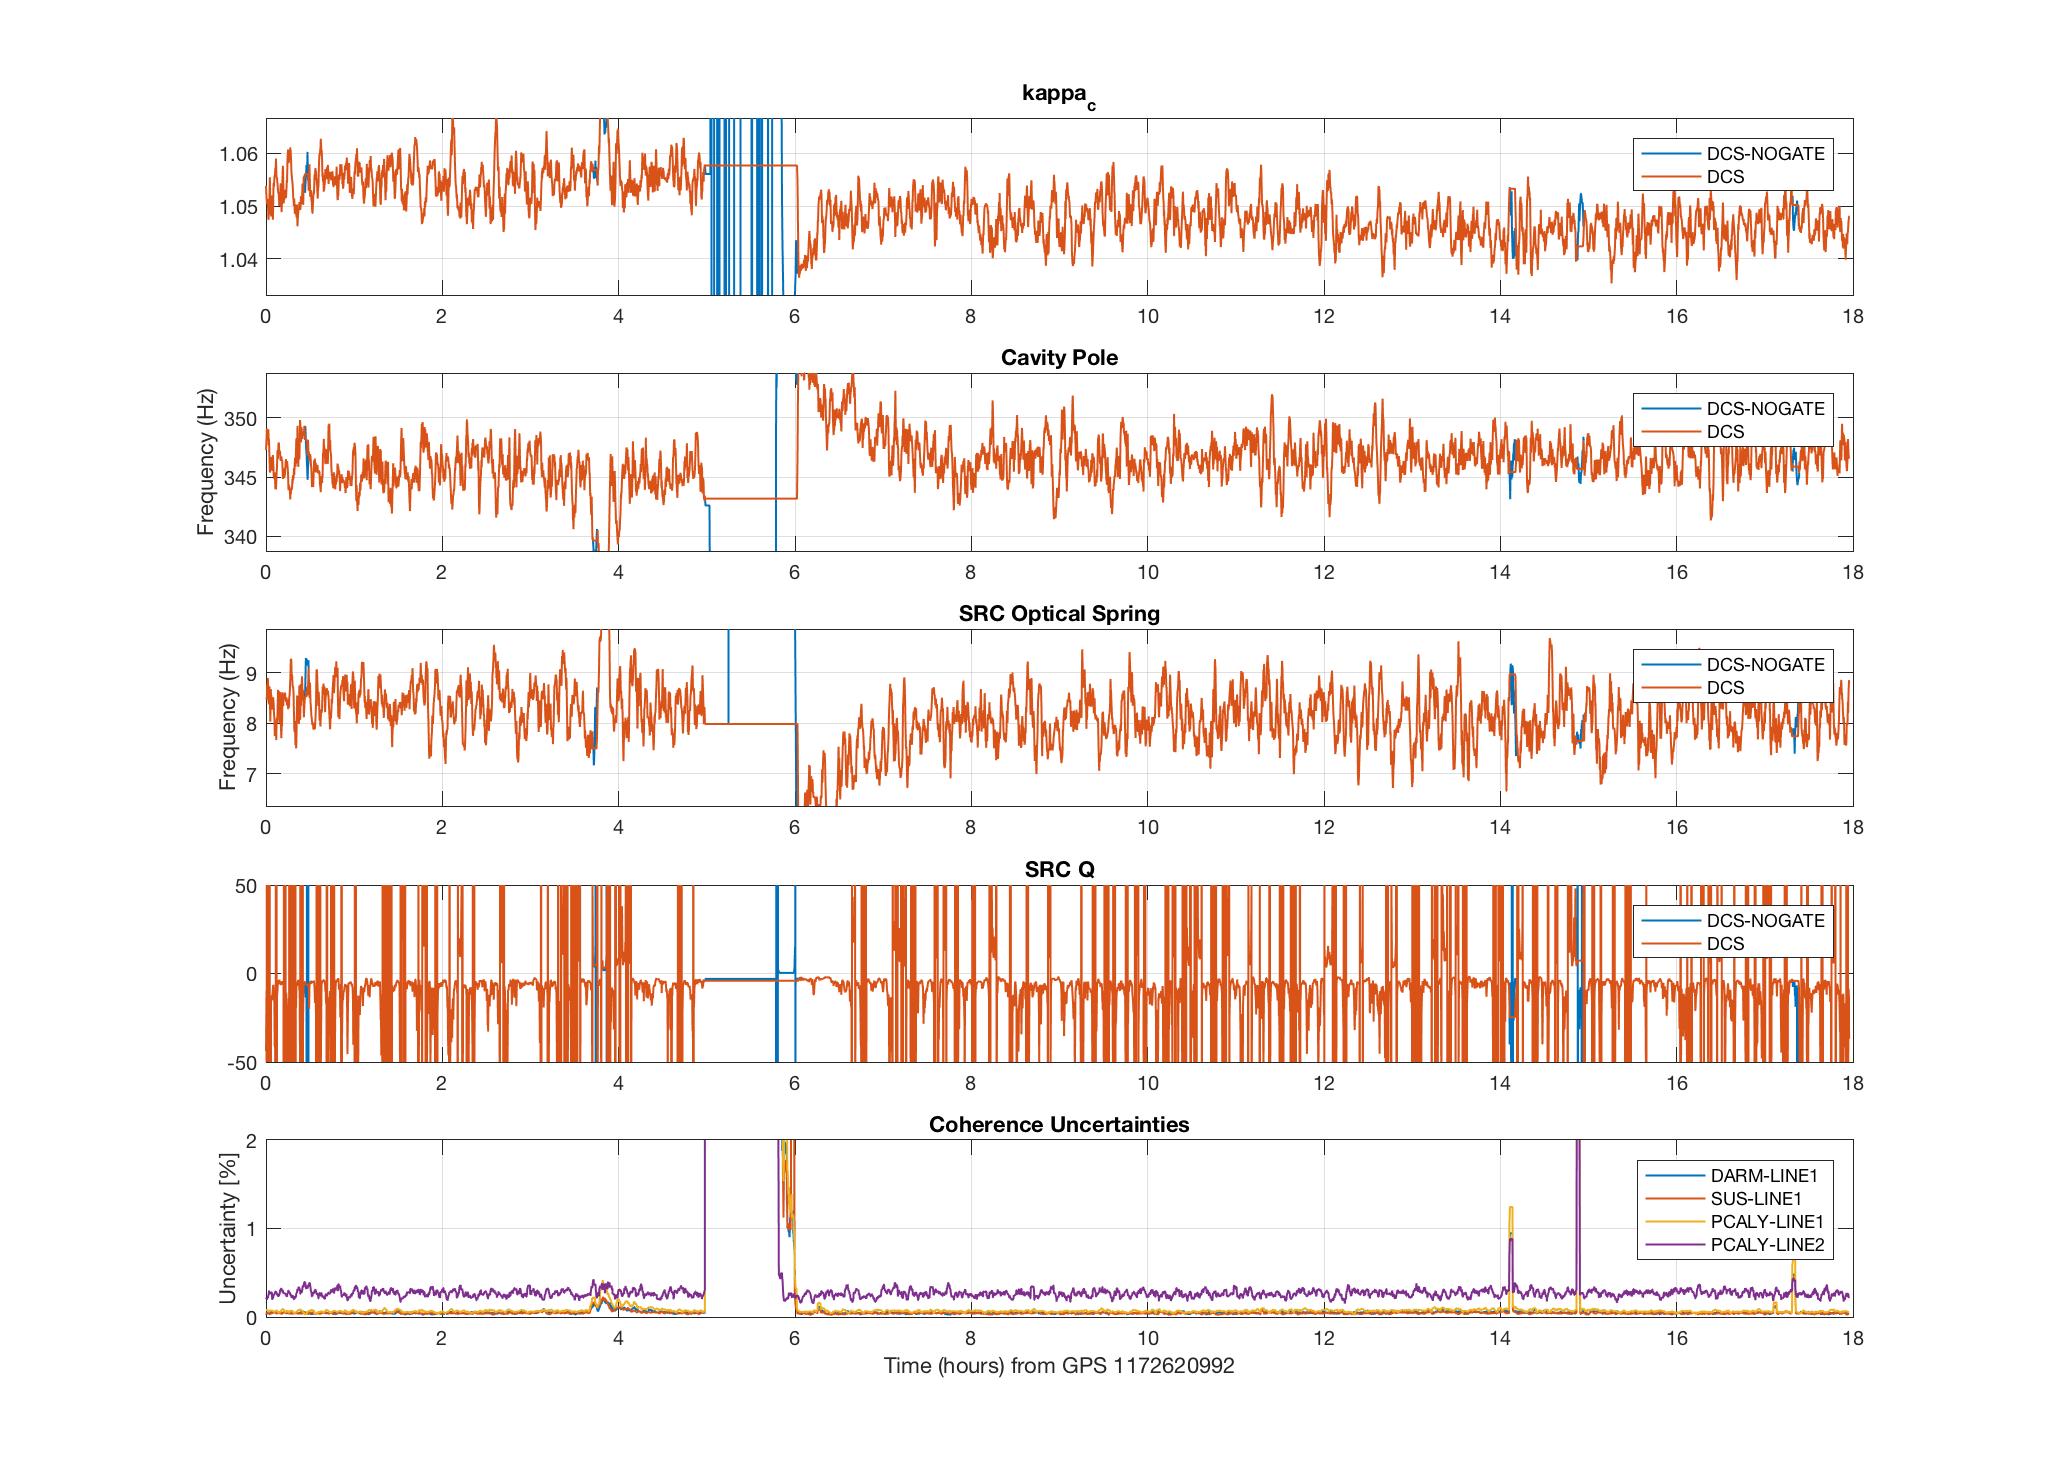
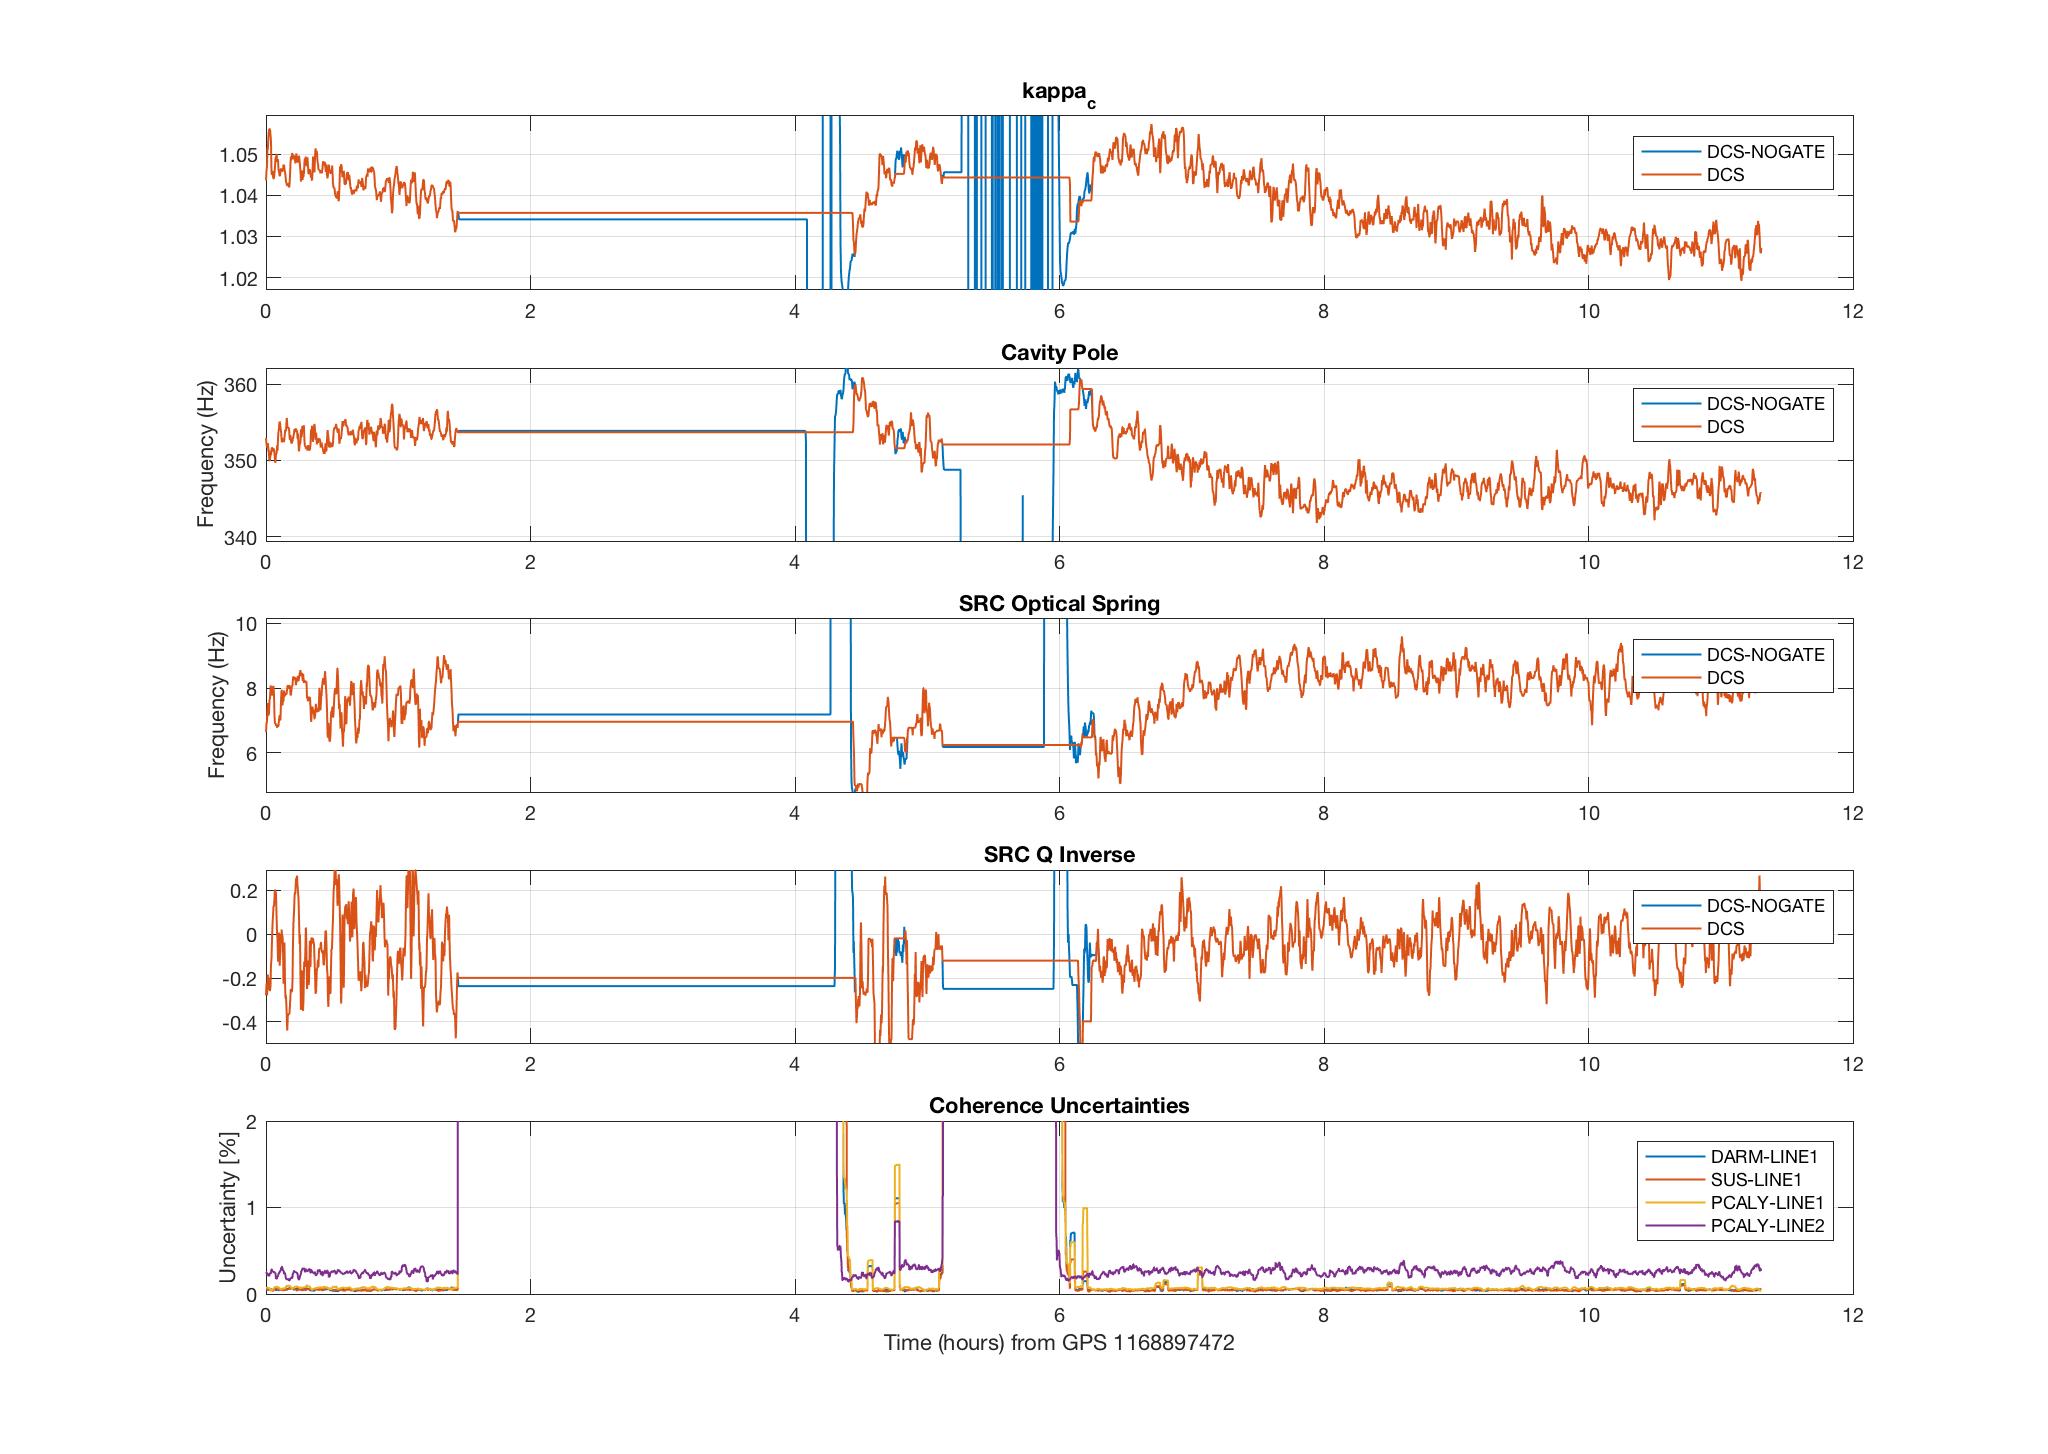
I have added an (unreleased) algorithm into the GDS/DCS pipeline to compute the SRC spring frequency and Q. This algorithm was used to collect 18 hours of data on February 4 (first plot) and 18 hours of data on March 4 (second plot). The plots include kappa_c, the cavity pole, the SRC spring frequency, the SRC Q, and 4 of the coherence uncertainties (uncertainty of the 7.93 Hz line is not yet available).

The derivation this algorithm was based on is similar to what Jeff has posted ( https://dcc.ligo.org/DocDB/0140/T1700106/001/T1700106-v1.pdf ), with differences noted below:
1) The approximation made at the bottom of p4 and top of p5 was only used in the calculation of kappa_c and the cavity pole. So SRC detuning effects were not accounted for in computing S_c. However, kappa_c and the computed cavity pole were used in the calculation of S_s.
2) In eq. 18, I have a minus (-) sign instead of a plus (+) sign before EP6. S_c = S(f_1, t) has been computed this way in GDS/DCS since the start of O2 (I assume during O1 as well).
3) Similarly, in eq. 20, I have a minus sign (-) before EP12.
4) In the lower two equations of 13, I have the terms under the square root subtracted in the opposite order, as suggested by Shivaraj. (Also, I noted that the expression for Q should only depend on S(f_2, t), with no dependence on S(f_1, t). )

The smoothing (128s running median + 10s average) was done on f_s and 1/Q, since that is the way they would be applied to h(t). Therefore, the zero-crossings of 1/Q show up as asymptotes in the plot of Q. I think it would be better to output 1/Q in a channel rather than Q for this reason.

There is a noticeable ramping up of f_s at the beginning of lock stretches, and the range of values agrees with what has been measured previously.

I've noted that it is quite difficult to resolve the value of Q with good accuracy. These are some reasons I suspect:
1) Higher uncertainty of calibration measurements at low frequency can add a systematic error to the EPICS values computed at 7.93 Hz. This may be why the Q is more often negative than positive ??
2) In the calculation of S_s, the actuation strength is subtracted from the ratio of pcal and DARM_ERR. Since this is such a low frequency, the subtracted values are close to the same value in magnitude and phase. Thus, subtracting magnifies both systematic error and uncertainty.
3) The imaginary part of S_s (see eq. 13, bottom equation) in the denominator, is very close to zero, so small fluctuations (about zero, as it turns out) in 1/Q cause large fluctuations in Q.

These reasons make it difficult to measure Q with this method. The effect of these measured-Q fluctuations on S_s, the factor we would actually apply to h(t) (see eq. 22), is not enormous, so long as we apply the smoothing to 1/Q, as I have done here.
First attachment is a hand written note containing derivation of the equations 13 in DCC document T1700106. As Aaron mentioned above, in the derivation the order of the quantities in the sqrt function comes out to be in the opposite order (Re[S] - abs[S]^2 instead of abs[S]^2 - Re[S]). The second plot show the estimation of the four sensing function quantities for 2017-01-24 calibration sweep measurement done at LHO (a-log 33604). Instead of tracking across time here we track across sweep frequencies. The top two plots in the second figure show the estimation of optical gain and cavity pole frequency assuming no detuning. We see that above ~100 Hz we get almost constant values for optical gain and cavity pole frequency suggesting detuning doesn't affect the estimation of those quantities (currently we use 331.9 Hz line at LHO for estimating optical gain and cavity pole). Substituting back the optical gain and cavity pole calculated this way, we then calculated detuning frequency and Q. The bottom two plots of the second figure show those. We see that upto ~60 Hz we can use the lines to estimate detuning frequency (currently at LHO we are running the line at 7.83 Hz). However the Q is hard to estimate, the variation is pretty large (Evan's recent a-log also indicate this 34967; Aaron also finds this to be the case). Also in the 7-10 Hz region its value seems to be negative (need to look at more data to make sure that it not just a fluctuation). With the current set of calibration lines, it seems tracking of detuning frequency would easy but estimating Q might be a little difficult.
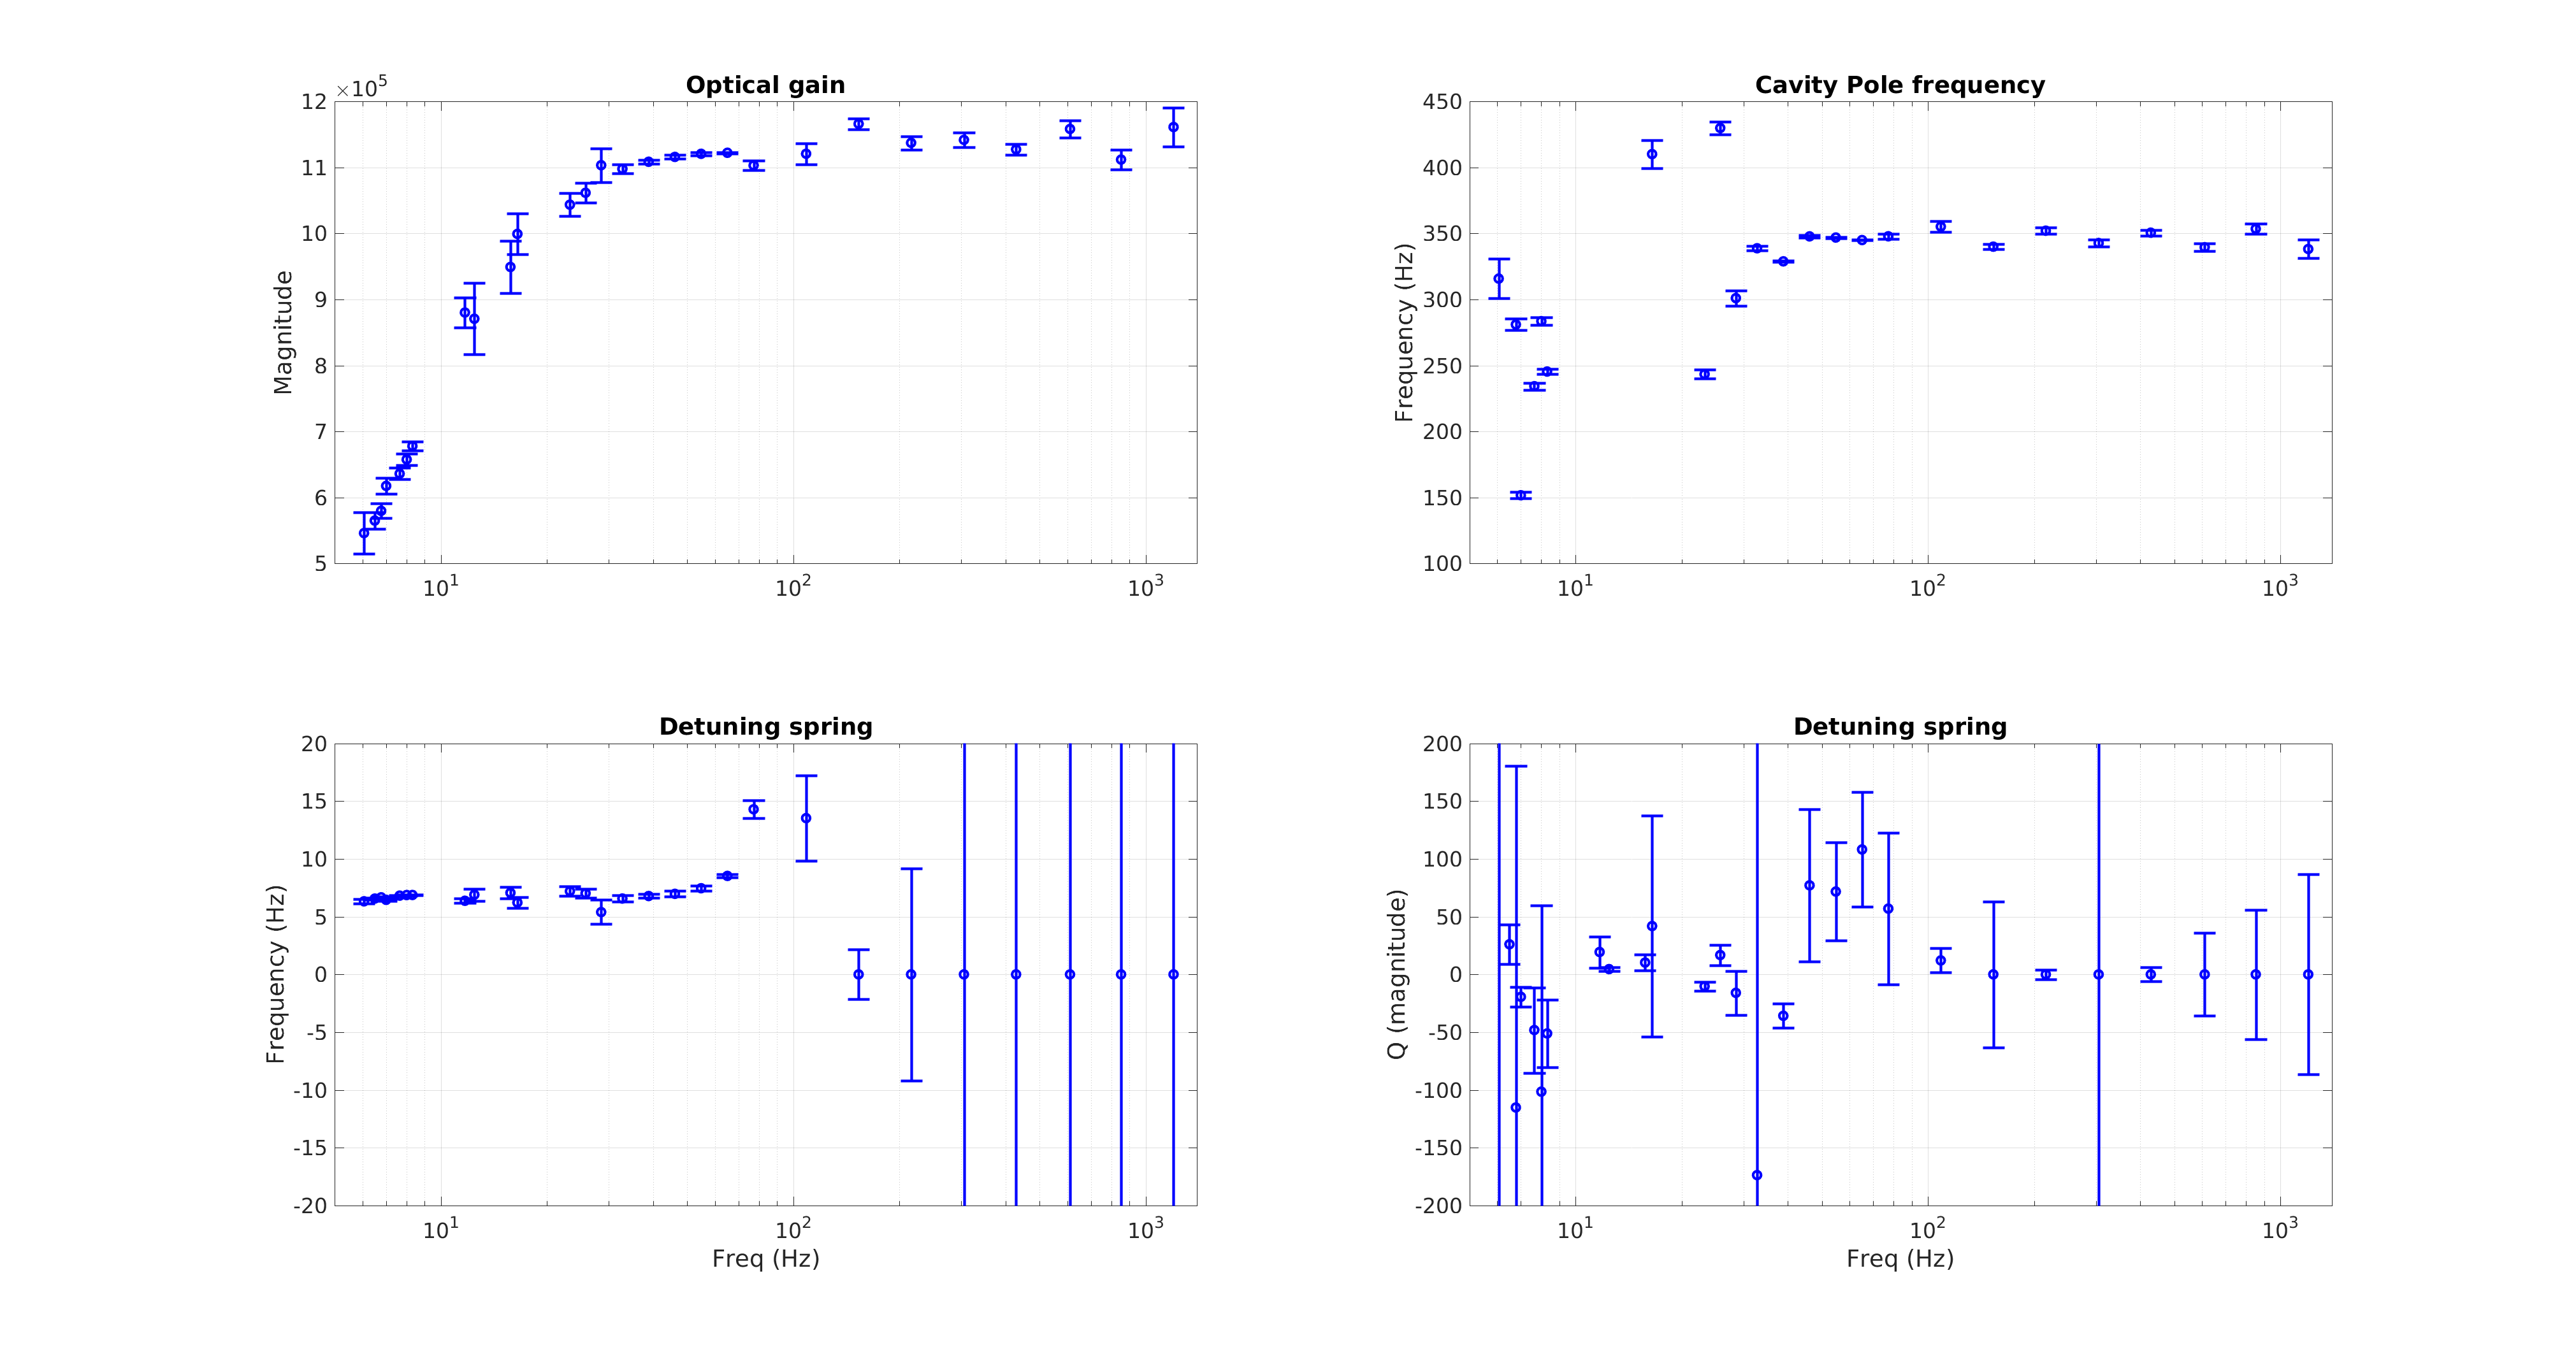
In the second page of the derivation, at the half way point I have unintentionally switched the notation from S_s to S_c (it should be S_s till the end of the page 2).
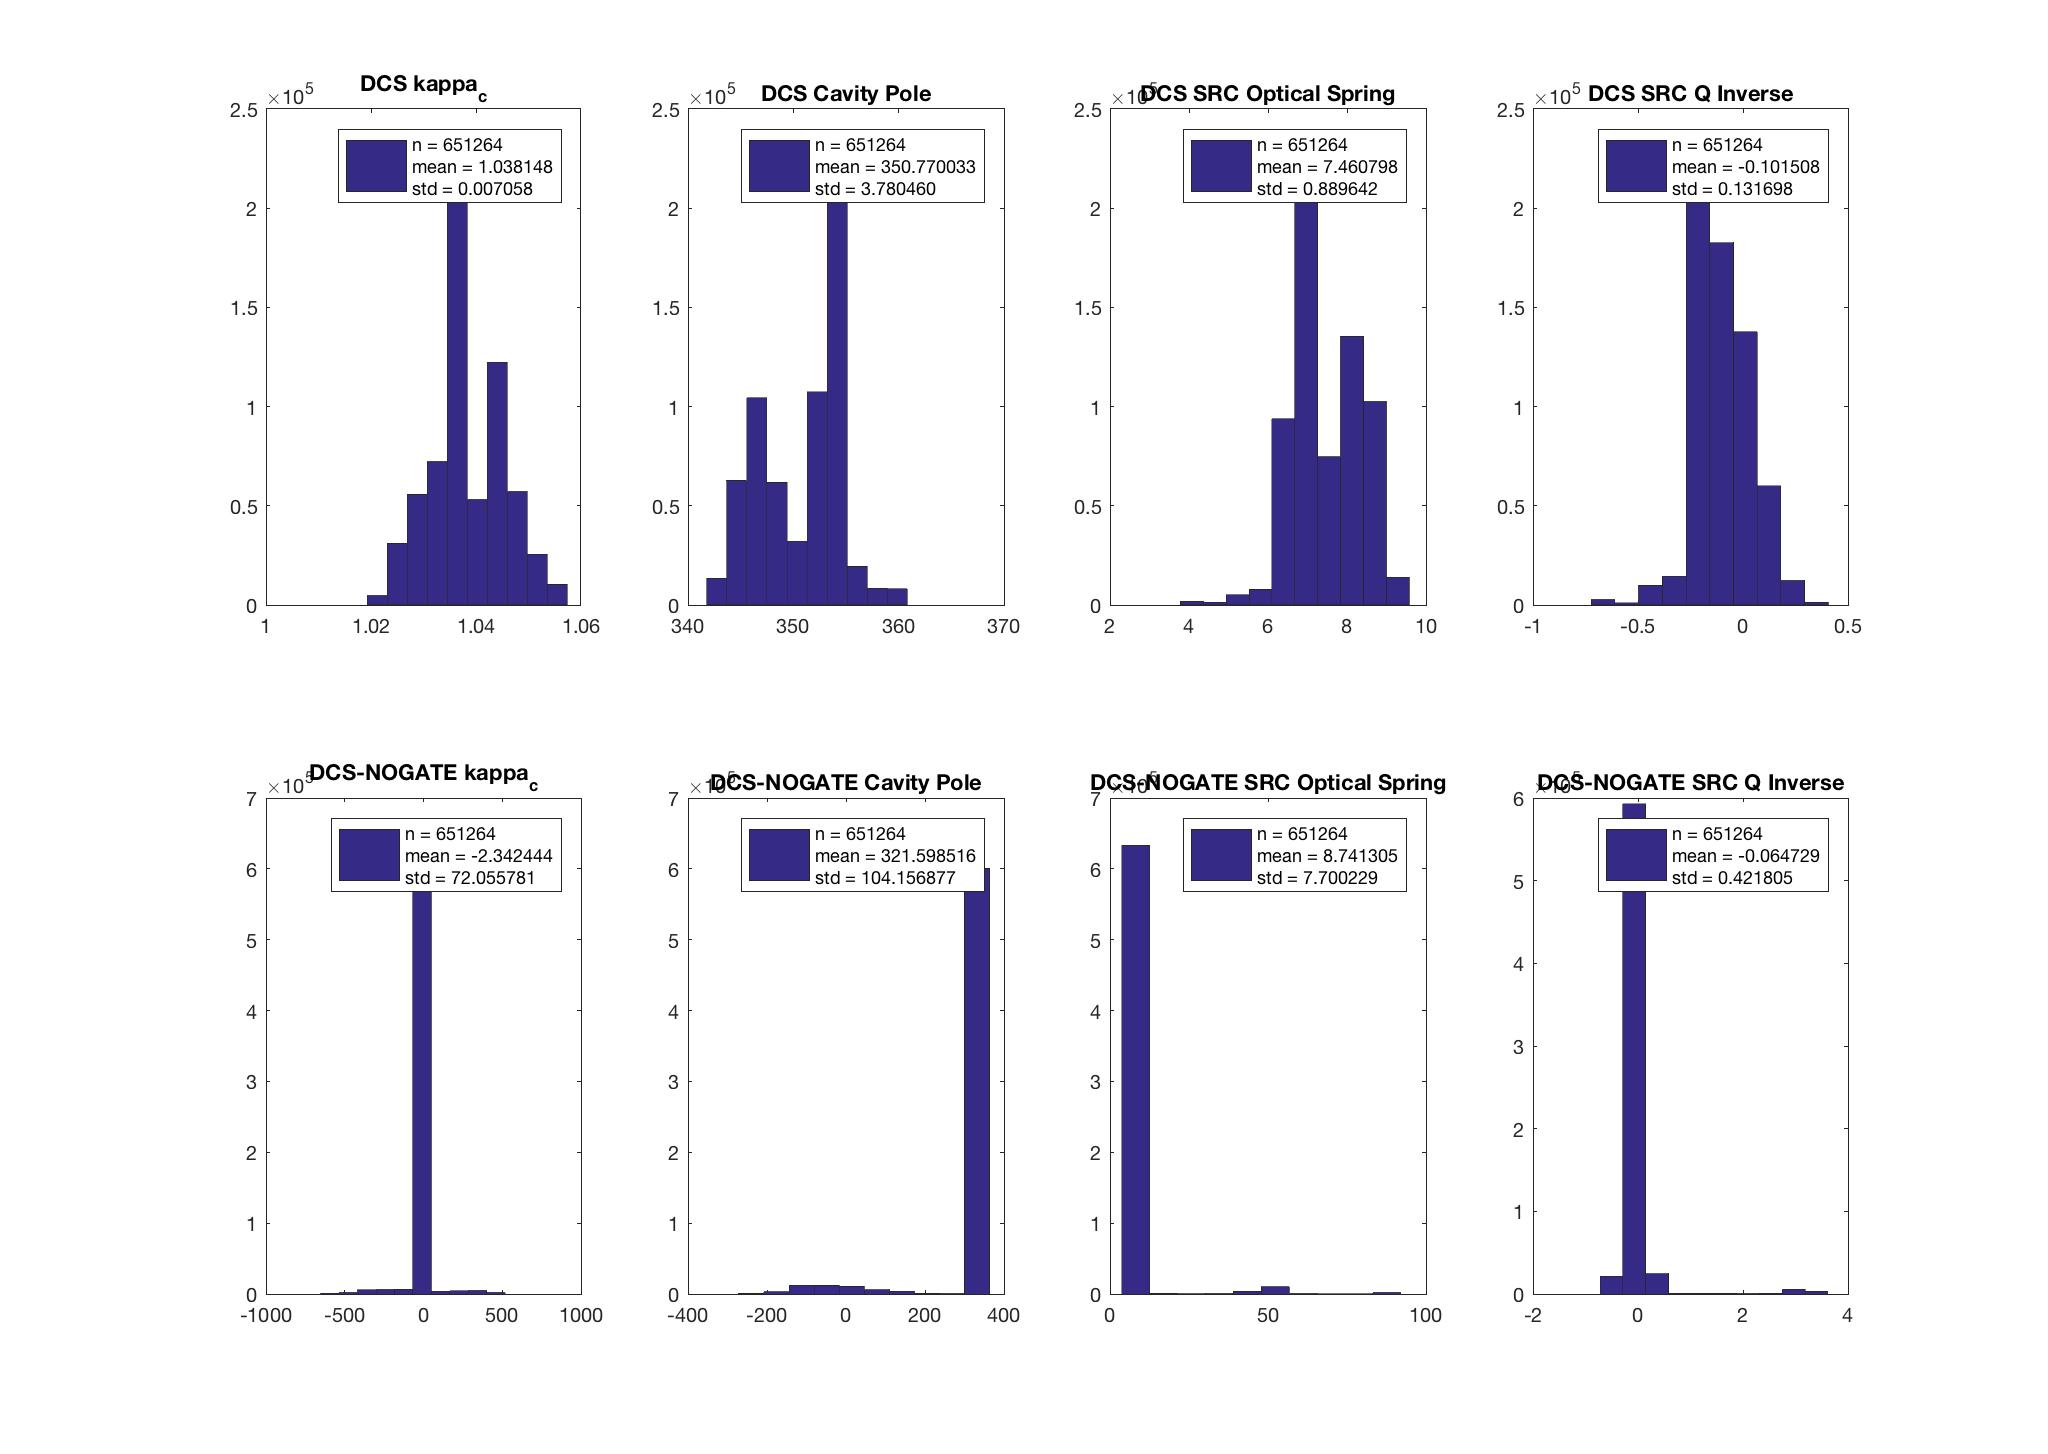
[Daniel Finstad, Aaron Viets]

The time series and histograms attached show additional data collected using the DCS calibration pipeline from Jan 19, 2017 at 21:44:14 UTC (GPS 1168897472) until Jan 20, 2017 at 09:02:38 UTC (GPS 1168938176).
I calculated the spot centering on the IMC mirrors, with help from Kiwamu and Jax (alog #6676).
All beam spots are with 2.3mm on center on all 3 mirrors, which is slightly better than what Jax measured in June.
| Beam Centering Measurements: 12/12 | P2L/Y2L gain | smallest peak amplitude | EL/EP | alpha | alpha in % | distance from center of mirror, in mm |
| 0.25/5.2382 | (EL/EP)*P2L/Y2L gain | % * 0.375 | ||||
| MC1 | ||||||
| P | -0.90 | 0.05 | 0.048 | -0.043 | -4.3 | -1.6 |
| Y | 0.60 | 0.30 | 0.048 | 0.029 | 2.9 | 1.1 |
| MC2 | ||||||
| P | -1.30 | 0.05 | 0.048 | -0.062 | -6.2 | -2.3 |
| Y | -1.00 | 0.50 | 0.048 | -0.048 | -4.8 | -1.8 |
| MC3 | ||||||
| P | 0.85 | 0.12 | 0.048 | 0.041 | 4.1 | 1.5 |
| Y | -1.10 | 0.05 | 0.048 | -0.052 | -5.2 | -2.0 |
I'm revisiting beam centering measurements, and have recalculated the beam centering logged here, based on my enhanced knowledge, and with both the procedure used in 2013 and in 2017.
My sign conventions in this 2013 alog are incorrect, and I'm now correcting them, and posting values using both the 2013 and 2017 procedure.
In 2013, though it's not stated, I used the Eul2OSEM values that match the UR OSEM, which matches the procedure I used in 2017, alog 34973
Updated Results (details in attached pdf):

