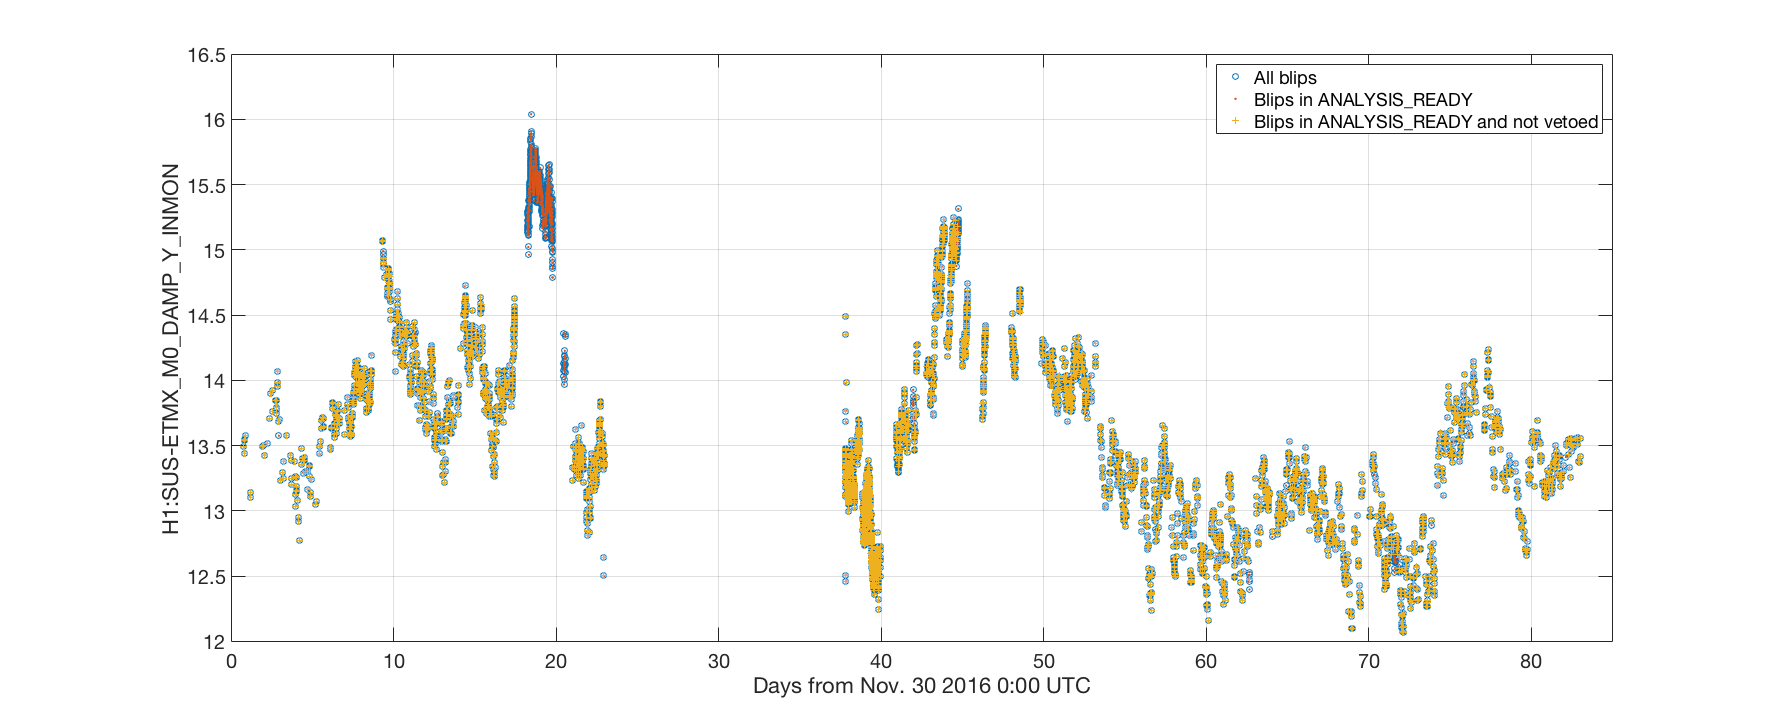
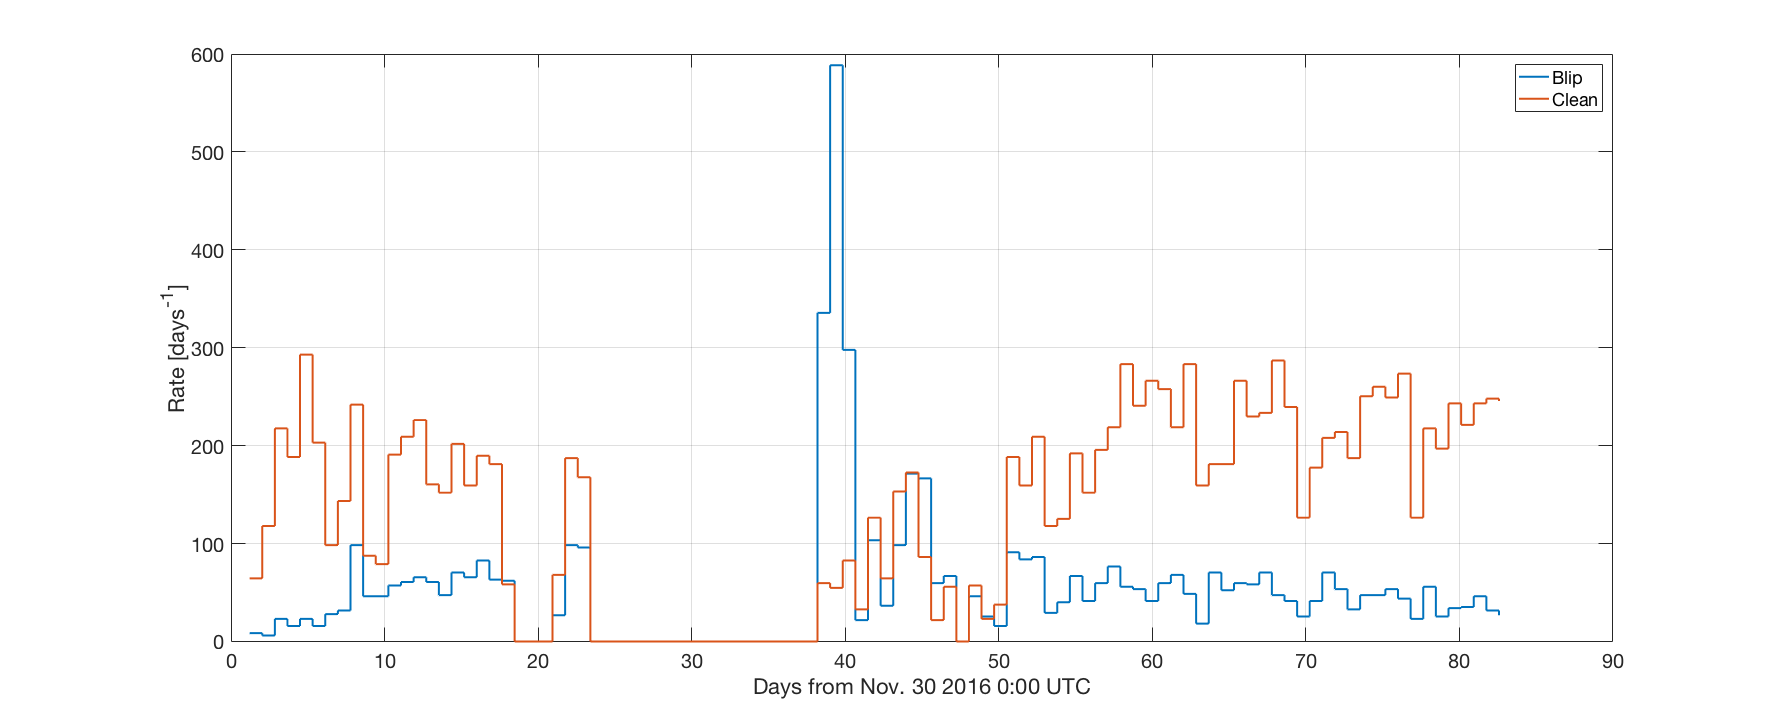
In brief, I found some significant correlation between (a class of) blip glitches and the values of some suspension signals coming from the OSEM and local sensor readout.
I found that some of the blip glitches tend to cluster around particular values of the signals. In particular the signals listed below are the most significant ones:
- ETMX_M0_DAMP_L_INMON, ETMX_M0_DAMP_R_INMON, ETMX_M0_DAMP_V_INMON, ETMX_M0_DAMP_Y_INMON,
- ETMY_M0_DAMP_P_INMON, ETMY_M0_DAMP_T_INMON,
- ITMX_M0_DAMP_P_INMON, ITMX_M0_DAMP_R_INMON, ITMX_M0_DAMP_V_INMON,
- ITMY_M0_DAMP_P_INMON, ITMY_M0_DAMP_R_INMON, ITMY_M0_DAMP_V_INMON
- ETMX_L1_WIT_YMON,
- ETMY_L1_WIT_PMON, ETMY_L1_WIT_YMON,
- ITMX_L1_WIT_LMON,
- ITMY_L1_WIT_LMON, ITMY_L1_WIT_PMON
- ITMX_L2_WIT_PMON,
- ITMY_L2_WIT_YMON
Read below for more details on the methodology and the results.
Method
- First of all I downloaded a list of identified blip glitches from the GravitySpy page (thank you TJ for pointing me to this). In O2, at Hanford, there are in total 5548 glitches that are identified as blips. Most of them are identified with high confidence (>99%). The time spans between 1164564597 (Nov 30 2016 18:09:40 UTC) and 1171671859 (Feb 21 2017 00:24:01 UTC).
- I downloaded 60 seconds of data (using the 16 Hz monitoring channels) around each blip glitch (-30s to +30s) for all the test mass SUS-XXX_M0_DAMP_*_INMON, SUS-XXX_L1_WIT_*MON, SUS-XXX_L2_WIT_*MON, SUS-XXX_L3_OPLEV_*_OUT16 signals. I have 56 channels in total.
- Even though I have 60 seconds of data, I just extracted the value of each signal at the time of each blip glitch. I also computed the first and second derivative of each signal at the same times.
- Then I randomly selected 5548 more times, uniformly distributed in the same range covered by the blip glitches. I ensured that the times I selected were in ANALYSIS_READY, not vetoed by any known flag (thanks again TJ for sharing the code to read the veto definer file) and at least 60 seconds from any known blip glitch. Those 5548 times can be considered as clean, glitch free times.
- For those clean times, I downloaded and sampled the same channels I used for the blip glitches.
At this point I have 5548 times identified as blip glitches, and the value of the suspension channels for each of those. And 5548 more times that are clean data, with the value of the suspension channels for each of those.
- For each of the suspension signal, I computed the histogram of its values at the time of blip glitches, and another histogram at the clean times. By comparing the two histograms I can tell if blip glitches tend to happen for some particular values of the signals.
Results
Here's an example plot of the result. I picked one of the most interesting channel (SUS-ETMX_M0_DAMP_Y_INMON). The PDF files attached below contains the same kind of histograms for all channels, divided by test mass.
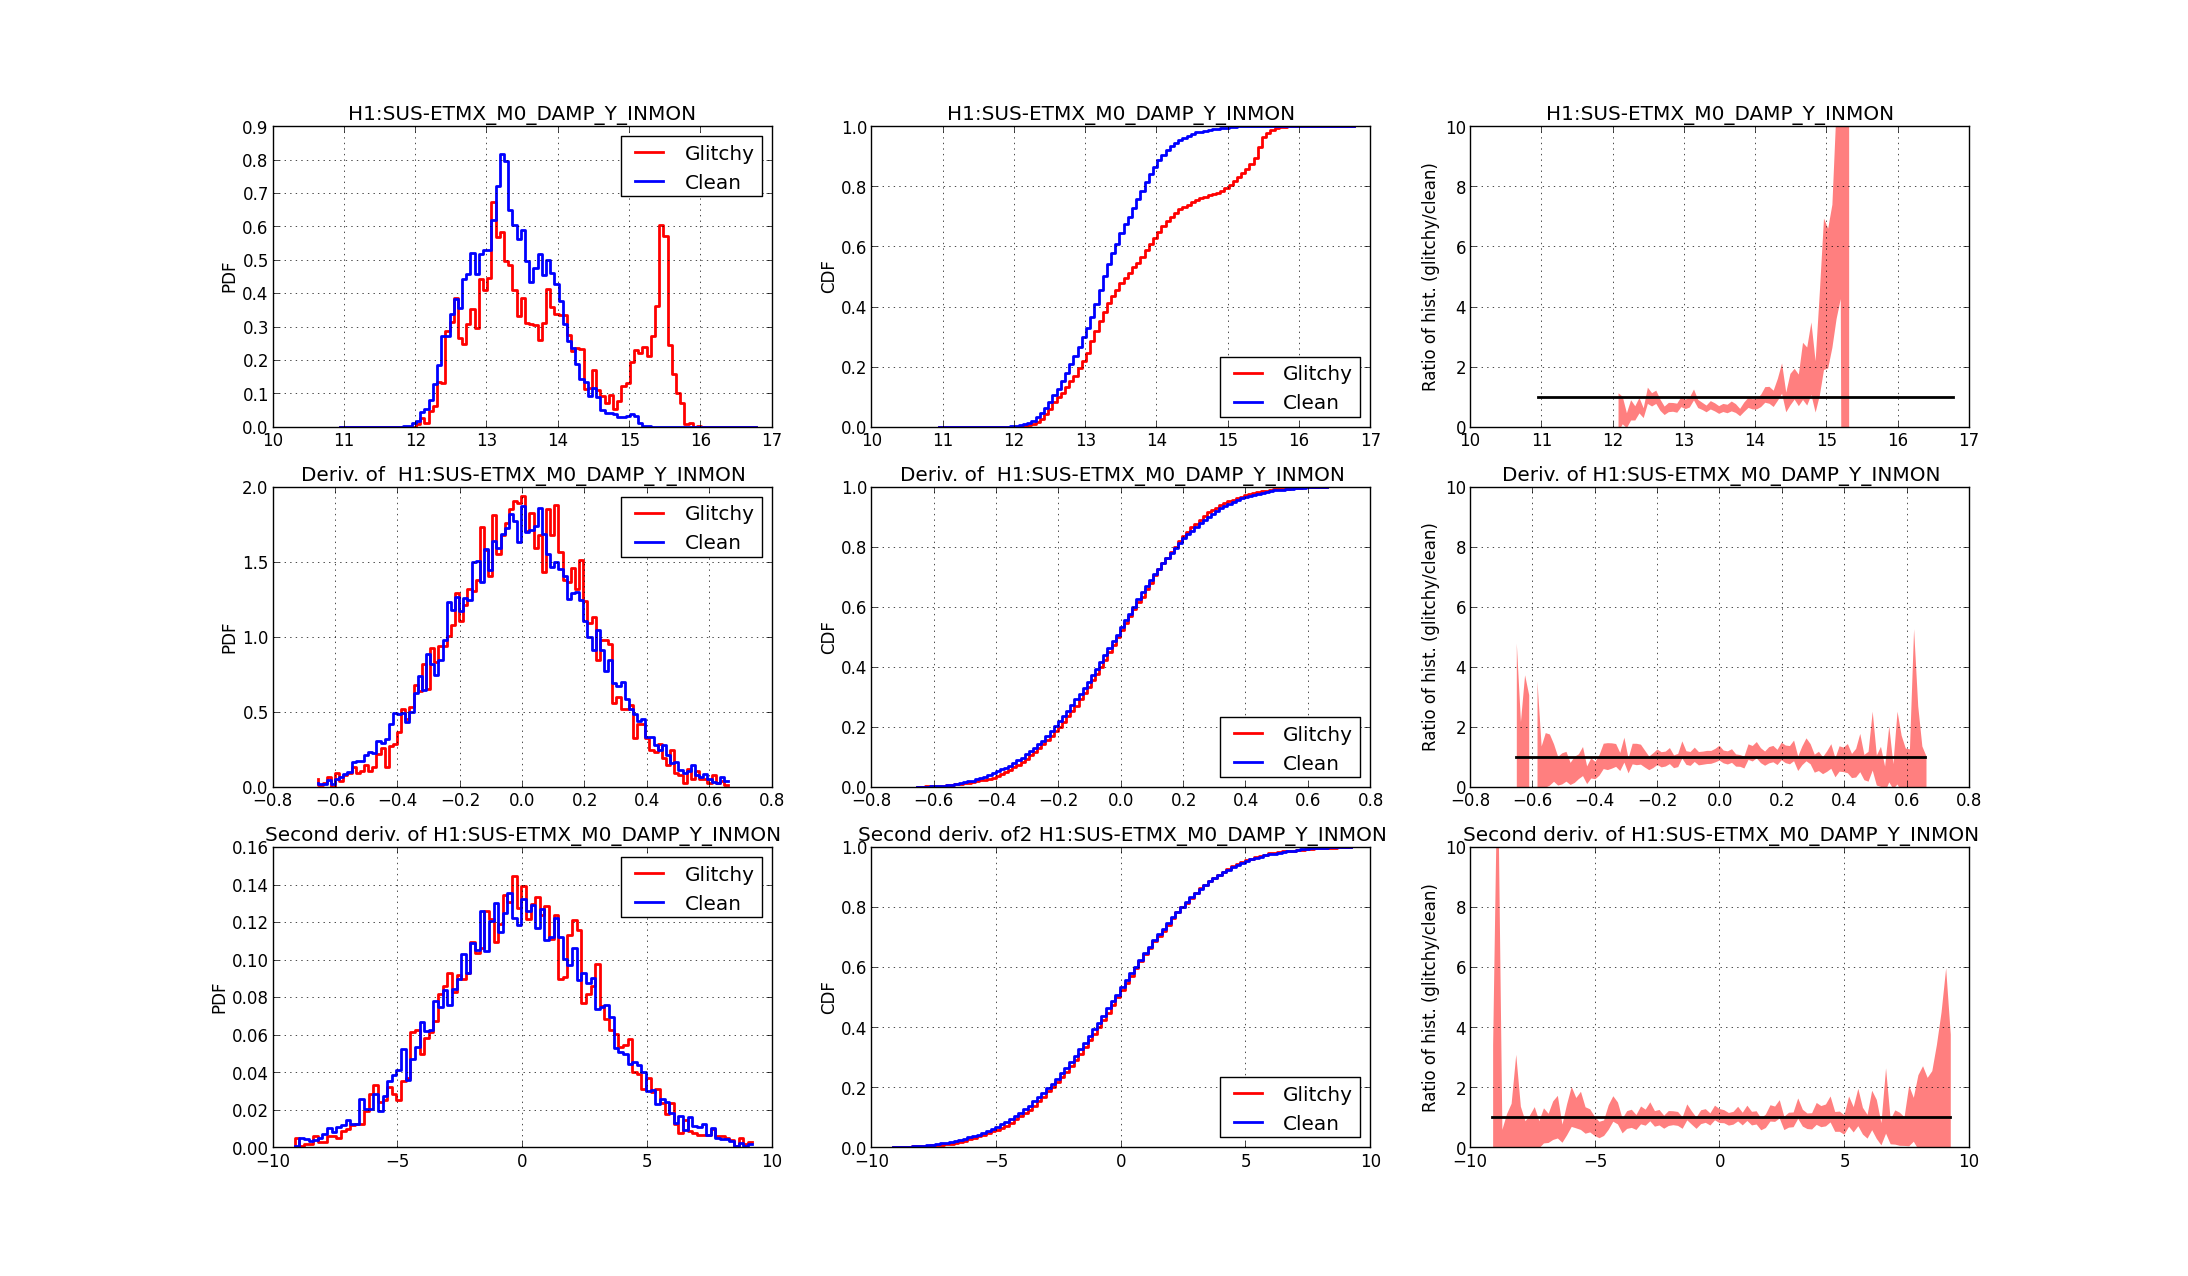 The first row shows results for the SUS-ETMX_M0_DAMP_Y_INMON signal. The first panel compares the histogram of the values of this signal for blip times (red) and clean times (blue). This histogram is normalized such that the value of the curve is the empirical probability distribution of having a particular value of the signal when a blip happens (o doesn't happen). The second panel in the first row is the cumulative probability distribution (the integral of the histogram): the value at an abscissa x gives the probability of having a value of the signal lower than x. It is a standard way to smooth out the histogram, and it is often used as a test for the equality of two empirical distributions (the Kolmogorov-Smirnov test). The third panel is the ratio of the histogram of glitchy times over the histogram of clean times: if the two distributions are equal, it should be one. The shaded region is the 95% confidence interval, computed assuming that the number of counts in each bin of the histogram is a naive Poisson distribution. This is probably not a good assumption, but the best I could come up with.
The second row is the same, but this time I'm considering the derivative of the signal. The third row is for the second derivative. I don't see much of interest in the derivative plots of any signal. Probably it's due to the high frequency content of those signals, I should try to apply a low pass filter. On my to-do list.
However, looking a the histogram comparison on the very first panel, it's clear that the two distributions are different: a subset of blip glitches happen when the signal SUS-ETMX_M0_DAMP_Y_INMON has a value of about 15.5. There are almost no counts of clean data for this value. I think this is a quite strong correlation.
You can look at all the signals in the PDF files. Here's a summary of the most relevant findings. I'm listing all the signals that show a significant peak of blip glitches, as above, and the corresponding value:
| |
ETMX |
ETMY |
ITMX |
ITMY |
| L1_WIT_LMON |
|
|
-21.5 |
-54.5 |
| L1_WIT_PMON |
495, 498 |
609 |
|
581 |
| L1_WIT_YMON |
753 |
-455 |
643, 647 |
500.5 |
| L2_WIT_LMON |
437, 437.5 |
|
-24 |
-34.3 |
| L2_WIT_PMON |
|
|
1495 |
-993, -987 |
| L2_WIT_YMON |
|
|
-170, -168, -167.5 |
69 |
| L3_OPLEV_PIT_OUT16 |
|
|
-13, -3 |
7 |
| L3_OPLEV_YAW_OUT16 |
-4.5 |
7.5 |
-10, -2 |
3 |
| M0_DAMP_L_INMON |
36.6 |
|
14.7 |
26.5, 26.9 |
| M0_DAMP_P_INMON |
|
-120 |
363 |
965, 975 |
| M0_DAMP_R_INMON |
32.8 |
-4.5 |
190 |
-90 |
| M0_DAMP_T_INMON |
18.3 |
10.2 |
20.6 |
27.3 |
| M0_DAMP_V_INMON |
-56.5 |
65 |
-25 |
-60 |
| M0_DAMP_Y_INMON |
15.5 |
-71.5 |
-19, -17 |
85 |
Some of the peaks listed above are quite narrow, some are wider. It looks like ITMY is the suspension with more peaks, and probably the most significant correlations. But that's not very conclusive.
To do next
- My guess is that all the peak above are coming from the same family of glitches. But this has to be checked. I can select a subset of blip glitches by setting some cuts in the signal values. And I can check if I get the same subset from all signals
- Once I have a family of glitches (for example those that correspond to SUS-ETMX_M0_DAMP_Y_INMON ~ 15.5 above), it's interesting to check if they are randomly distributed over the duration of the run, or if they cluster around a specific time
- Also, I have to try and see if that family of blip glitches can be characterized by some properties (like bandwidth, central frequency, duration, etc...)
- And there are many more channels to check. My initial motivation for looking at suspension signals was to check for crackling glitches: stress releases in the suspension blades, wires or fibers.
- Just for fun I trained a simple (shallow) neural network to try to distinguish glitches from clean times. Results were not good enough to be reported here, mainly because it's quite cleat than only a subset of blip glitches are correlated with suspension signals