As a benchmark against which to compare upcoming O2 data, I have compiled a list
of narrow lines seen in the H1 DARM spectrum up to 2000 Hz, using 107 hours of
ER10 FScan 30-minute SFTs. There are no big surprises relative to the lines and combs
Ansel and I have reported on previously from ER9 and later data, but below are some
observations.
Attached figures show selected band spectra, and a zipped attachment
contains a much larger set of bands. Also attached for reference is a plaintext list of combs,
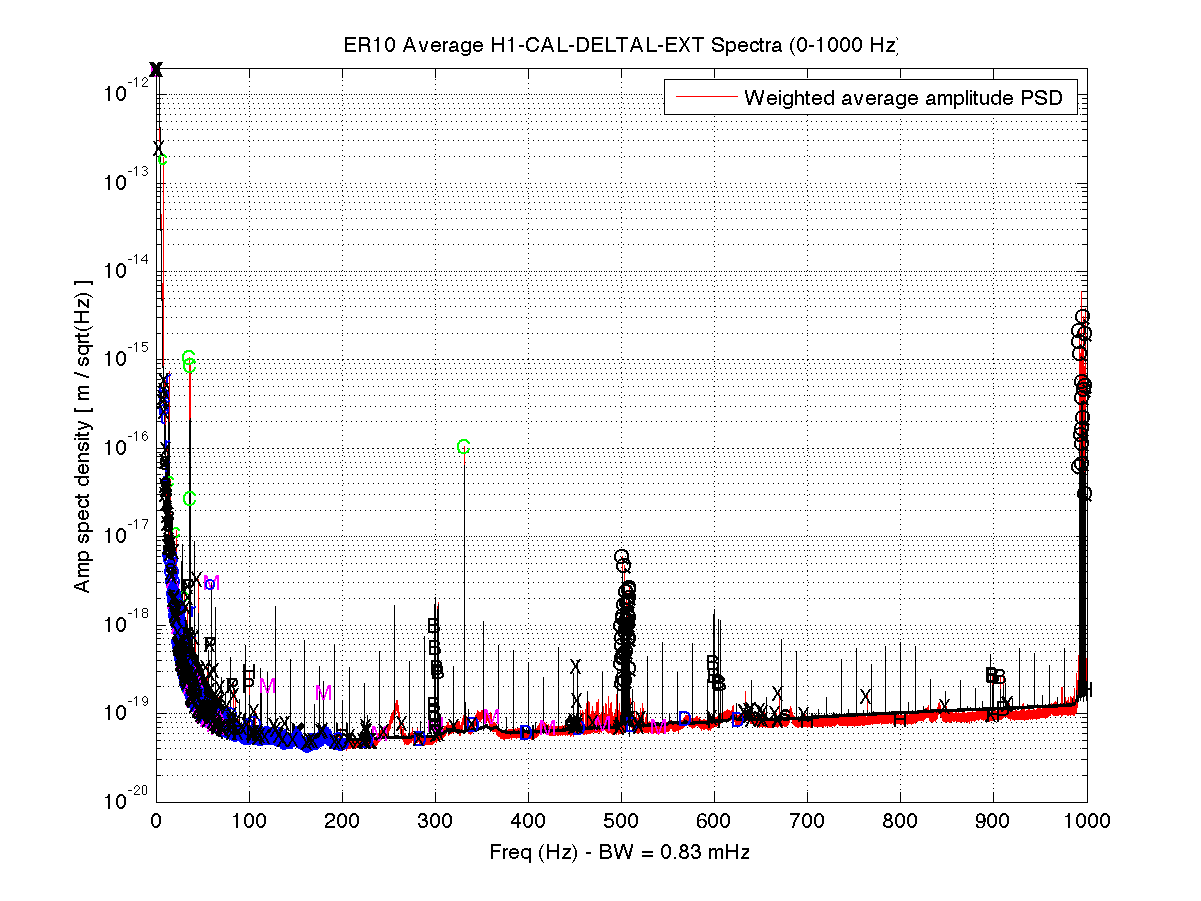
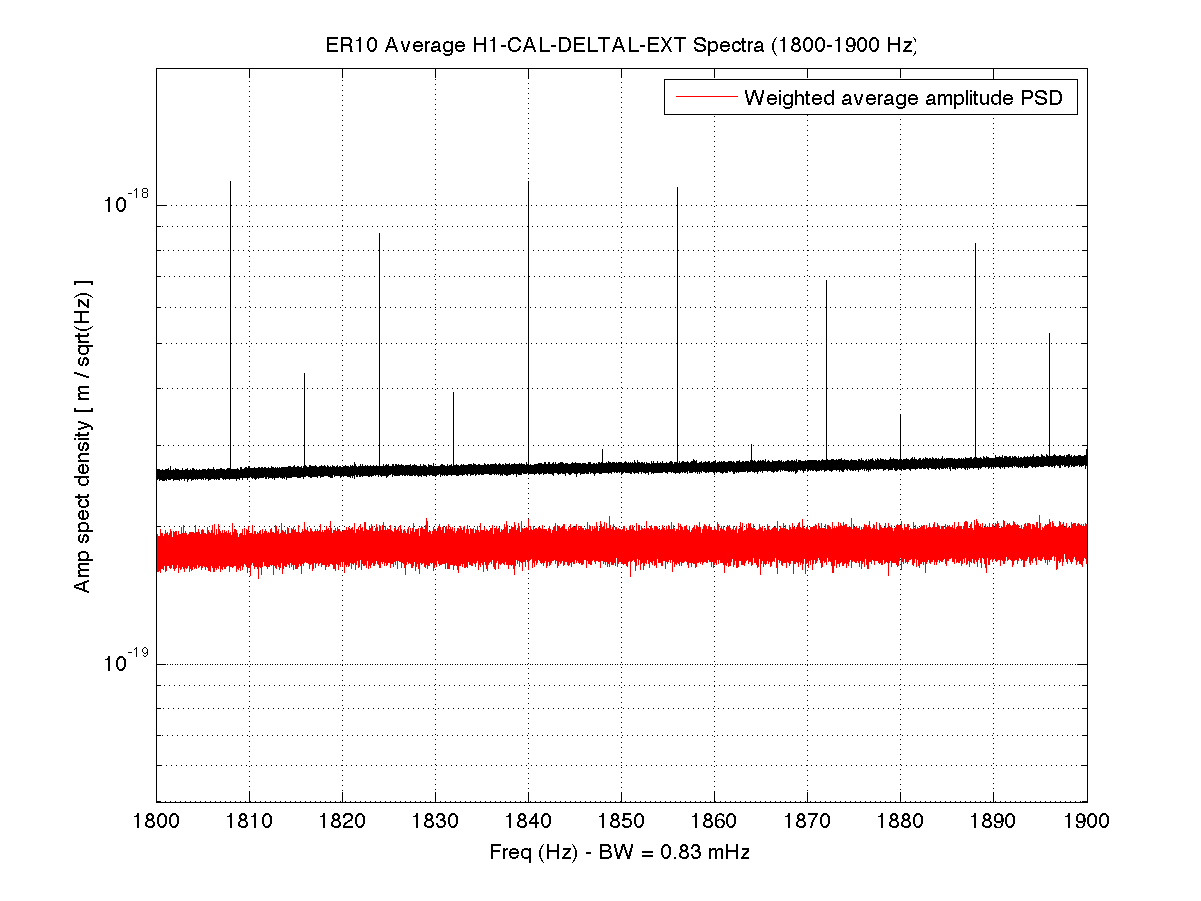
isolated lines, PEM-associated lines. etc. In the attached spectra, the red curve is the
ER10 data, and the black curve is the full-O1 data. The label annotations are keyed to
the height of the red curve, but in some cases, those labels refer to lines in the O1 data
that are not (yet) visible in accumulated current data. For the most part, lines seen in
O1 that don't show up in ER10 nonetheless remain for now in the lines list and still
have labels on the graphs that end up in the red fuzz. If they fail to emerge in O2
data, they will be deleted from future line lists.
Observations:
- As noted previously, the 8-Hz / 16-Hz combs seen in O1 are blessedly gone
- Thanks to interventions to upgrade timing electronics firmware, the previously dominant low-frequency comb
with 1-Hz spacing and 0.5-Hz offset is greatly reduced (but not eliminated)
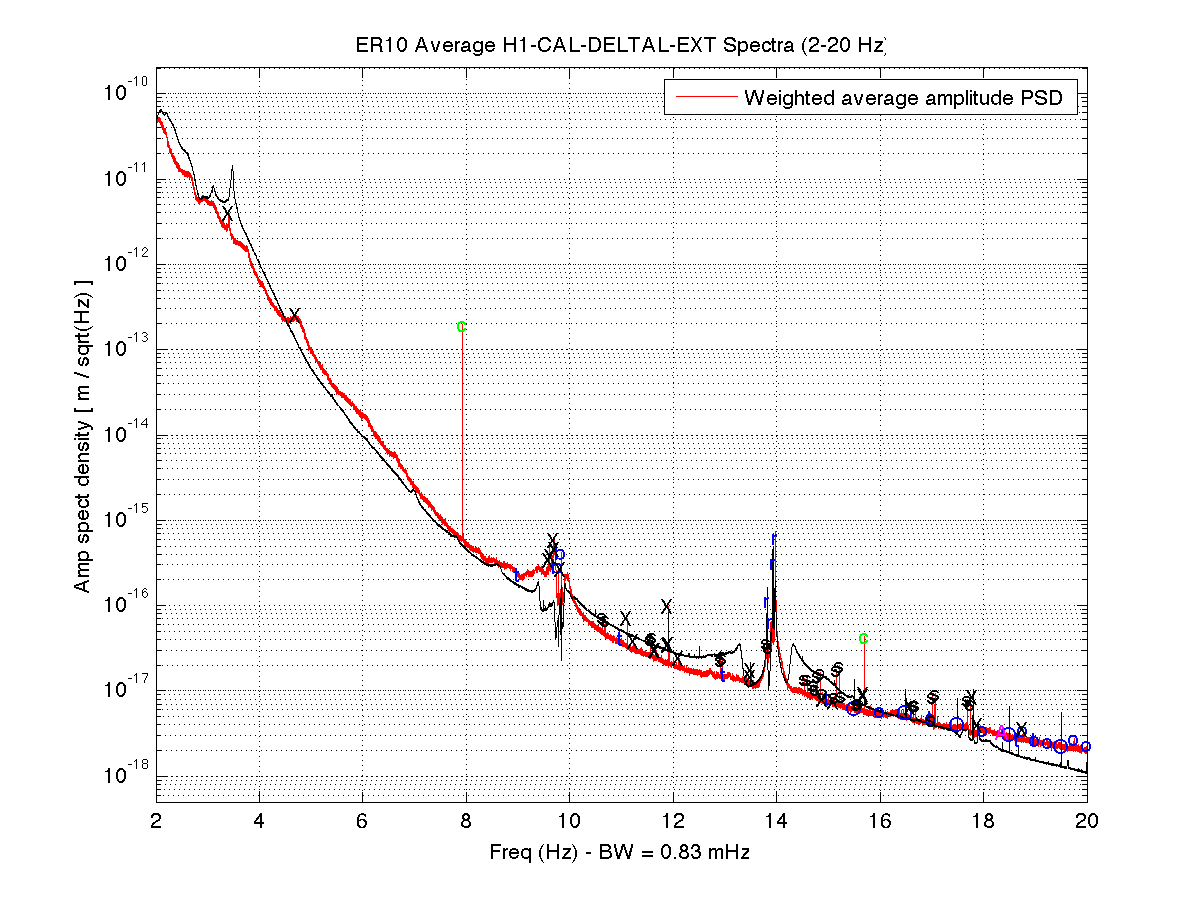
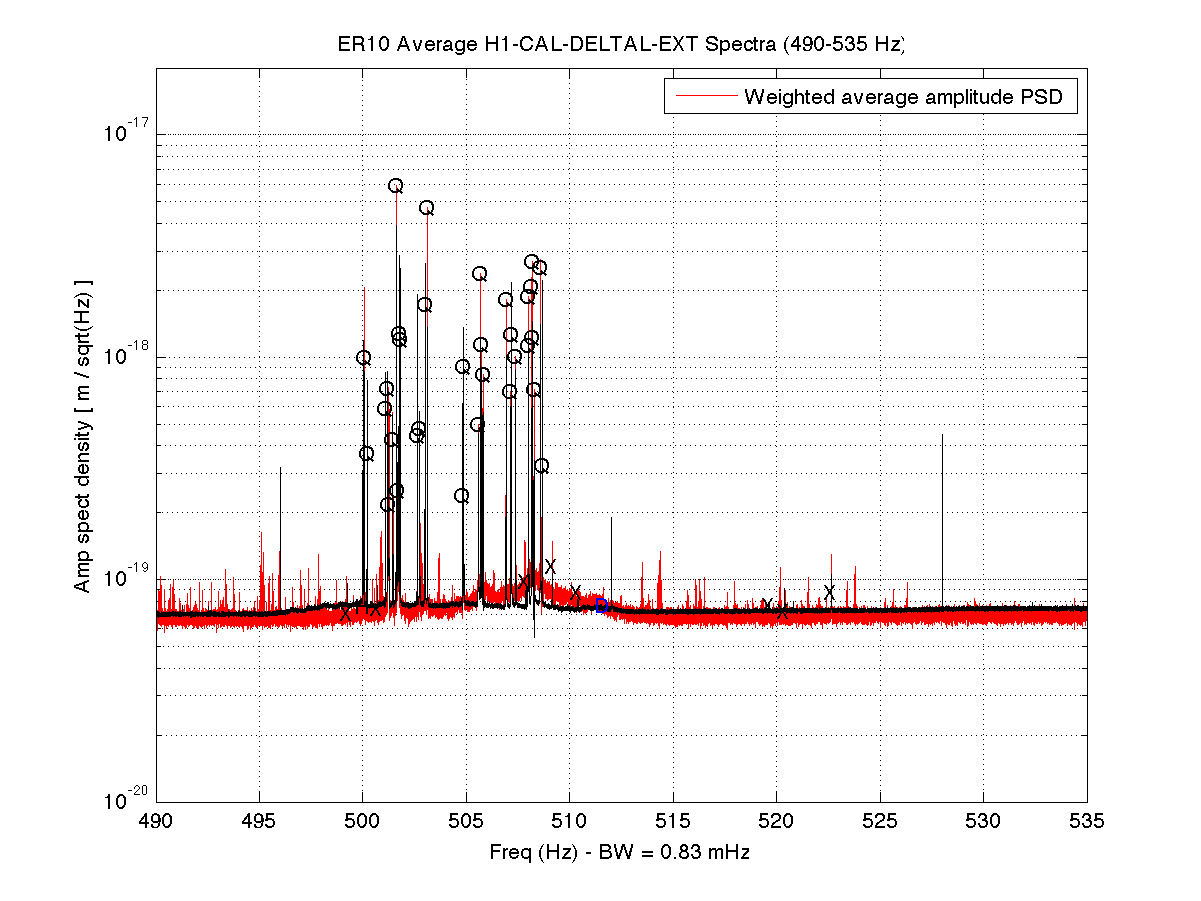
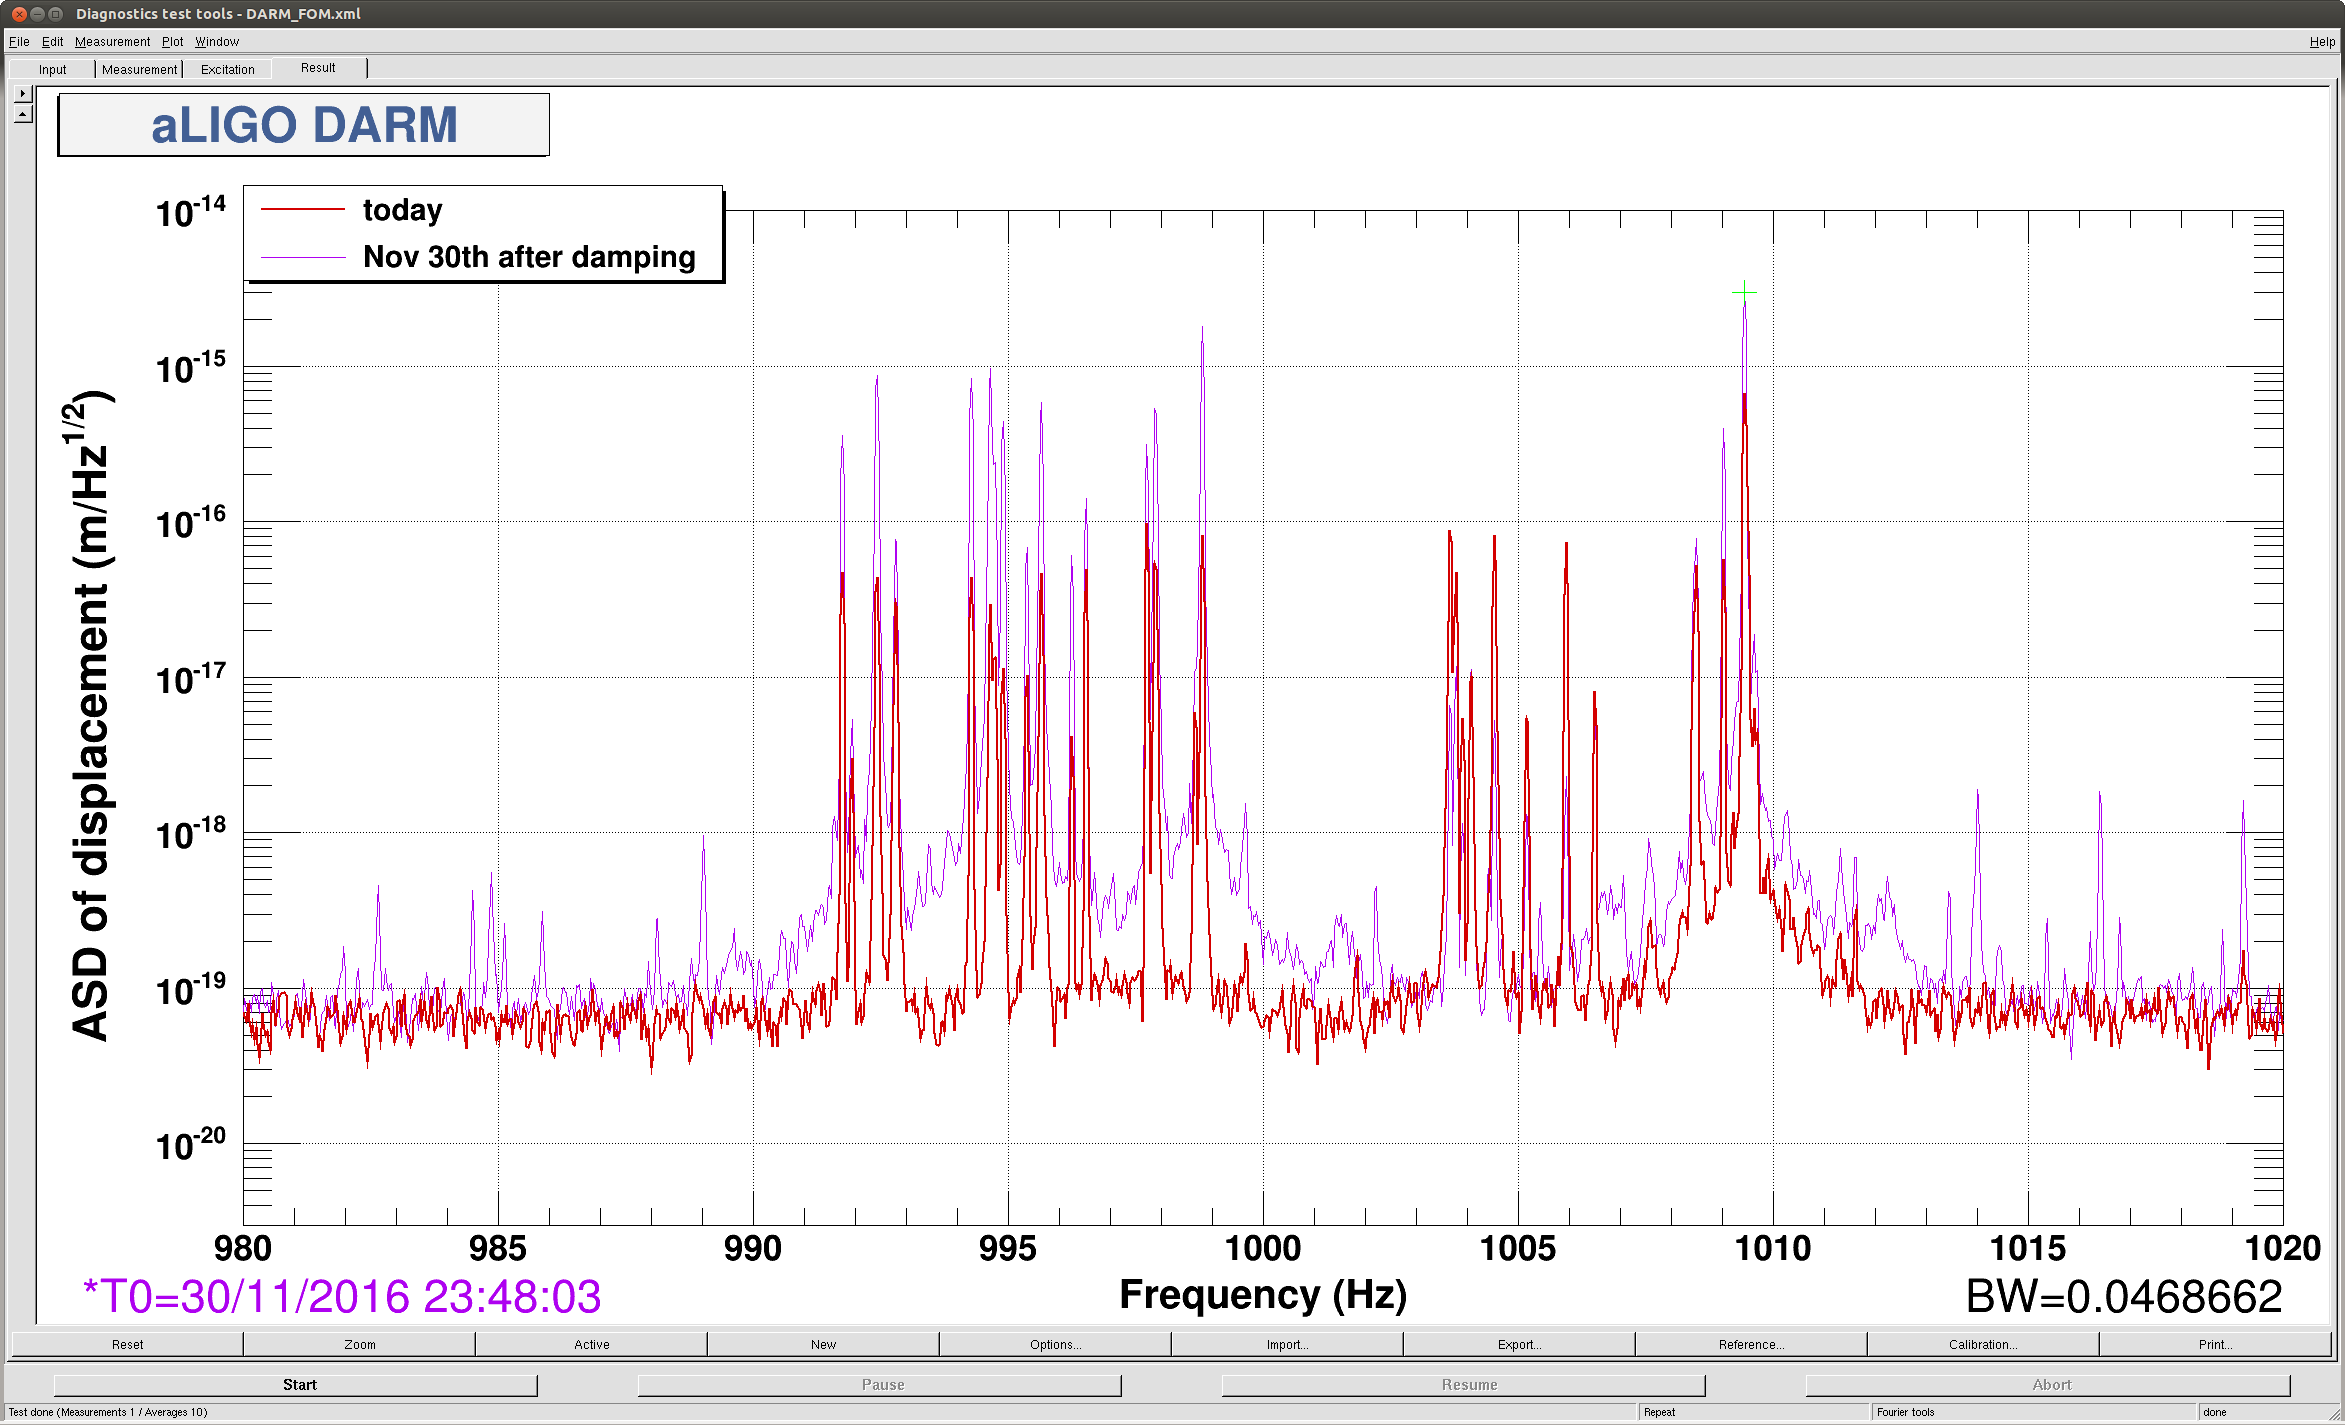
- Compared to O1, the non-linear upconversion around quad violin modes and harmonics
is much worse in ER10, and it appears that at least some violin mode excitations are
affecting the low frequency band in that one sees there a multitude of sparsely distributed
doublets, triples and quadruplets of lines with a spacing of about 0.0468 Hz.
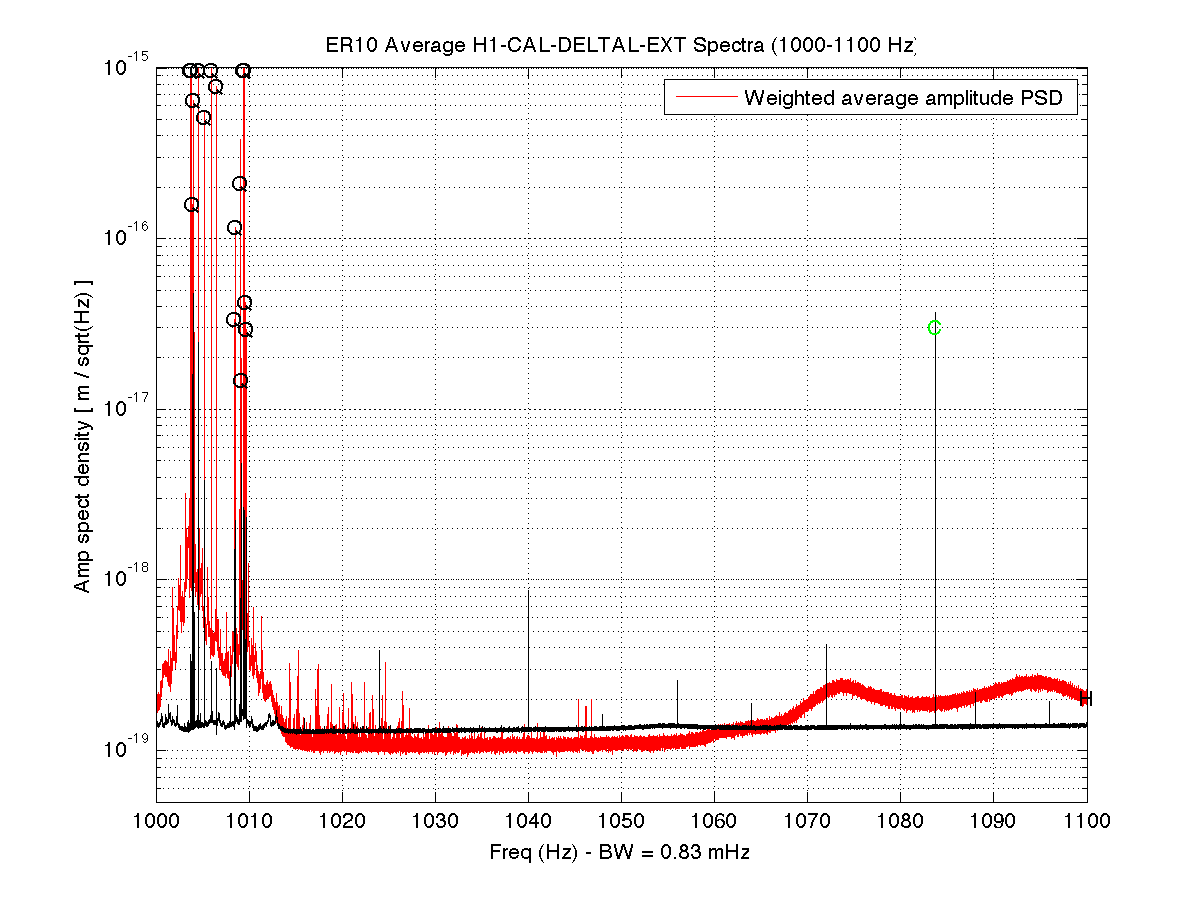
Andy Lundgren pointed out that this spacing coincides closely with a beat between
two 2nd-harmonic violin modes he reported on last week.
If I measure / eyeball those frequencies as seen in the ER10 data set, I get 1009.4414 and 1009.4881 Hz, giving
a beat of 0.0467 Hz (but with an uncertainty of a few tenths of a mHz), consistent with the explanation.
Further credence comes from the proliferation of such doublets / triplets / quadruplets seen in the wings of
the quad harmonics (fundamental and higher).
- There are so many upconverted lines around the quad harmonics that I didn't bother cataloguing them
in those regions on the assumption that they will go away in O2 with improved damping
(but cataloguing can be revisited later, if needed).
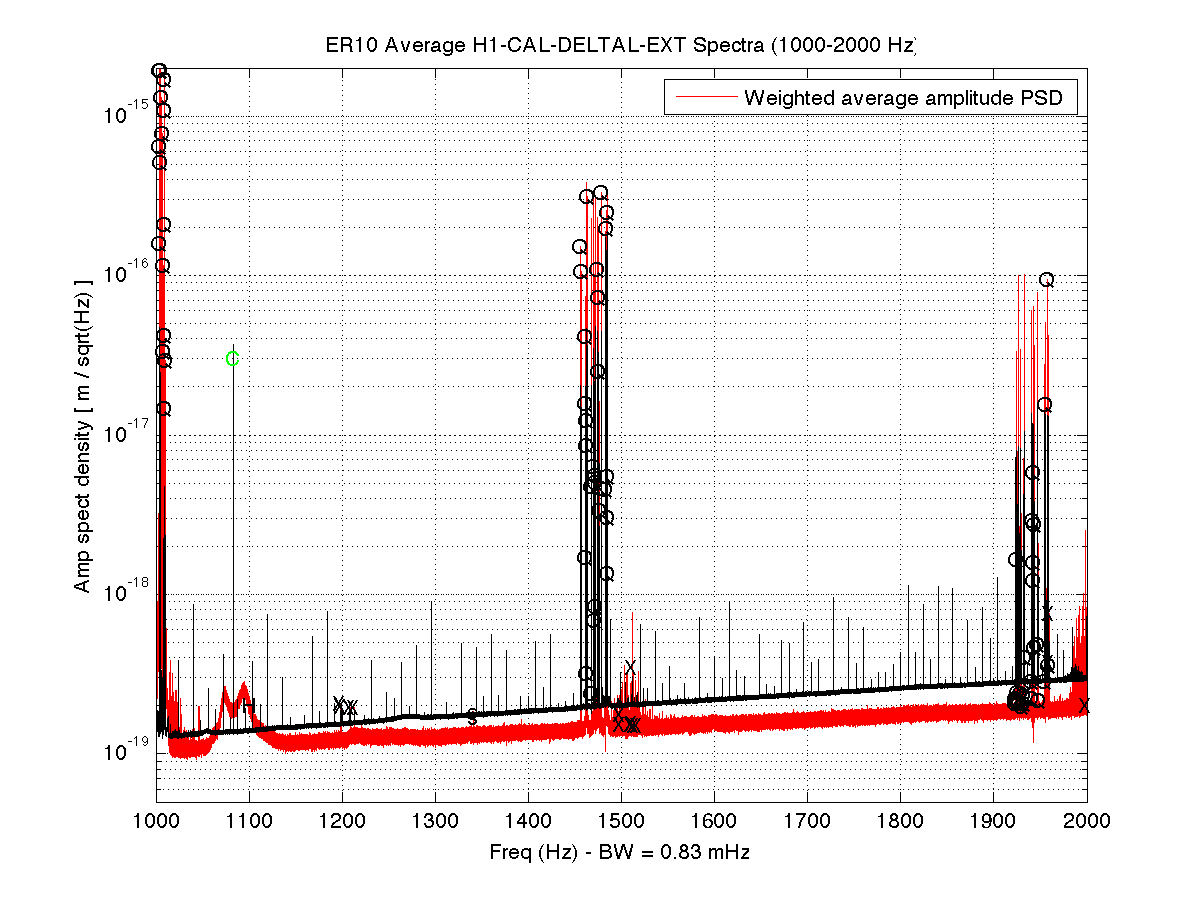
- With the exception of the violin mode regions, the higher frequency spectrum is generally free
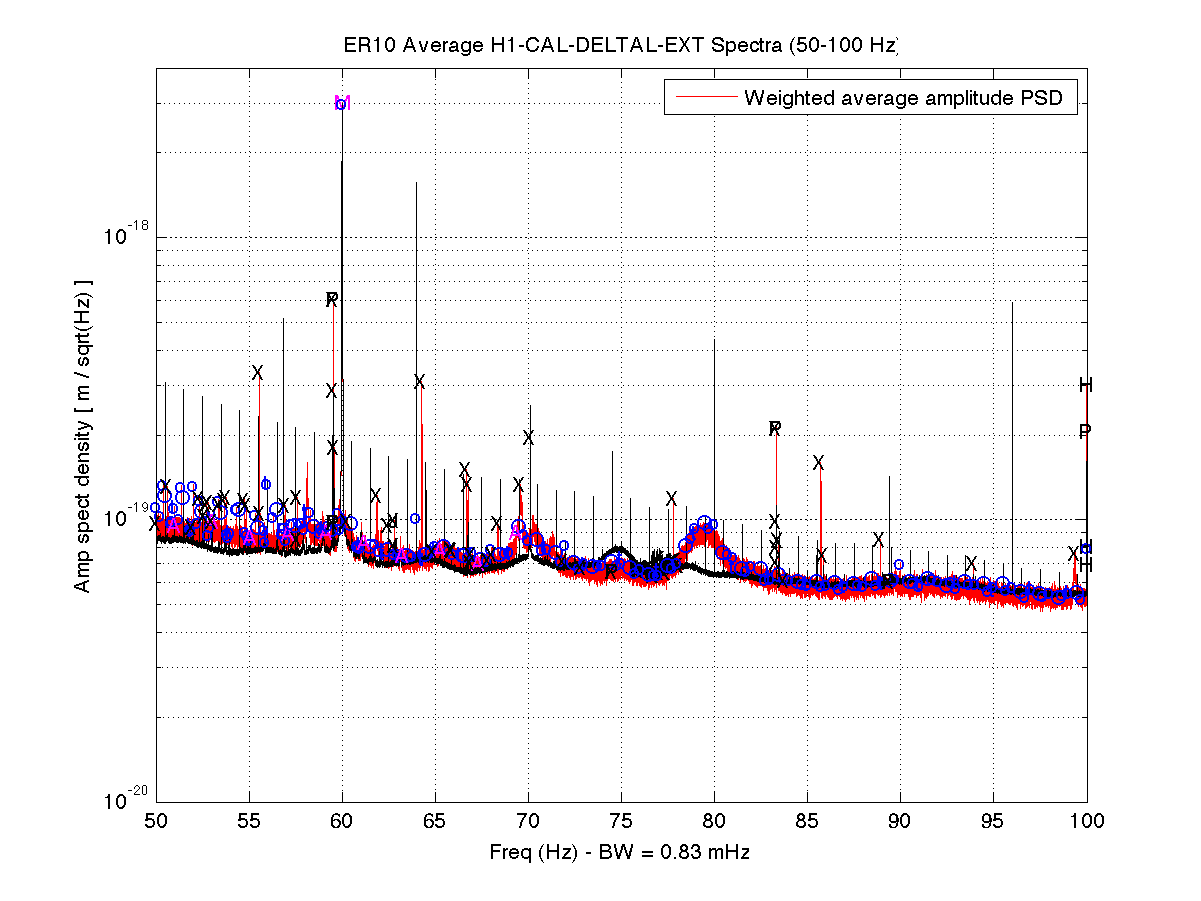
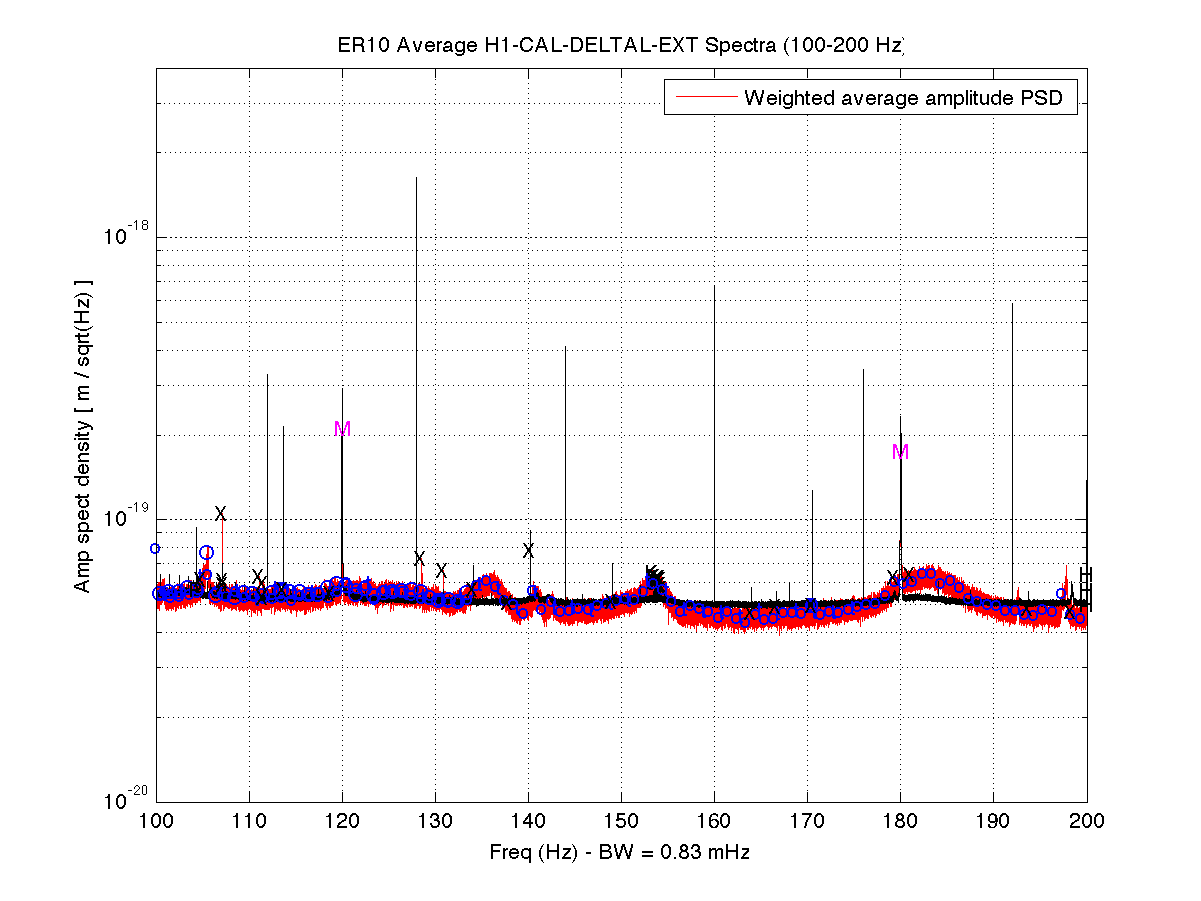
of narrow lines (unlike the region below 100 Hz), but one disturbing feature is the presence of
non-Gaussian broad disturbances that were not visible in O1. The infamous region around 1083 Hz
is one example, as is the 100-200 Hz band.
Figures: [ER10 in red and O1 in black; labels are attached to peaks in the ER10 data]
Fig 1 - 0-1000 Hz
Fig 2 - 1000-2000 Hz
Fig 3 - 2-20 Hz
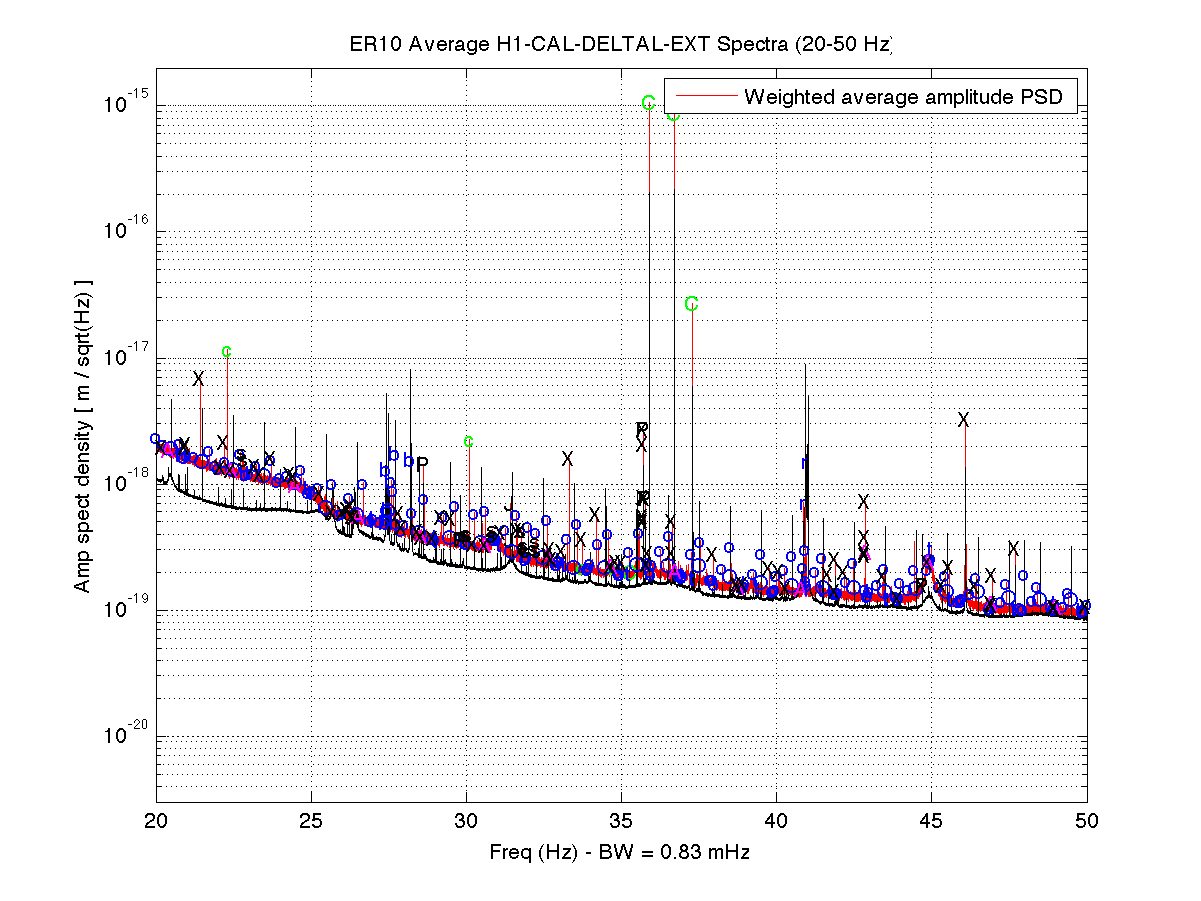
Fig 4 - 20-50 Hz
Fig 5 - 50-100 Hz
Fig 6 - 100-200 Hz
Fig 7 - 490-535 Hz
Fig 8 - 1000-1000 Hz
Fig 9 - 1800-1900 Hz
Other attachments:
* zipped file with full set of sub-band spectra
* Lines list with label definitions