|
Work Permit |
Date |
Description |
alog/status |
|
6388.html |
2016-12-06 11:18 |
Power cycle the /ligo file system server, it is reporting errors. This will freeze all CDS workstations and many servers for about 10 minutes. Front ends and DAQ should be unaffected. |
32247, 32249, & 32250 |
|
6387.html |
2016-12-06 10:49 |
Rana is going to give a tour to a guest during the maintenance window. |
|
|
6386.html |
2016-12-06 10:23 |
Vent annulus volume between 2K input Mode Cleaner tubes A and B. Connect annulus ion pump hardware and pump with rotating shaft vacuum pumps until ion pump can maintain unassisted. Can be done limited to maintenance days until complete |
32254 |
|
6385.html |
2016-12-06 09:53 |
Install OS and setup Conlog on conlog-master and conlog-replica machines in the MSR. |
|
|
6384.html |
2016-12-05 17:31 |
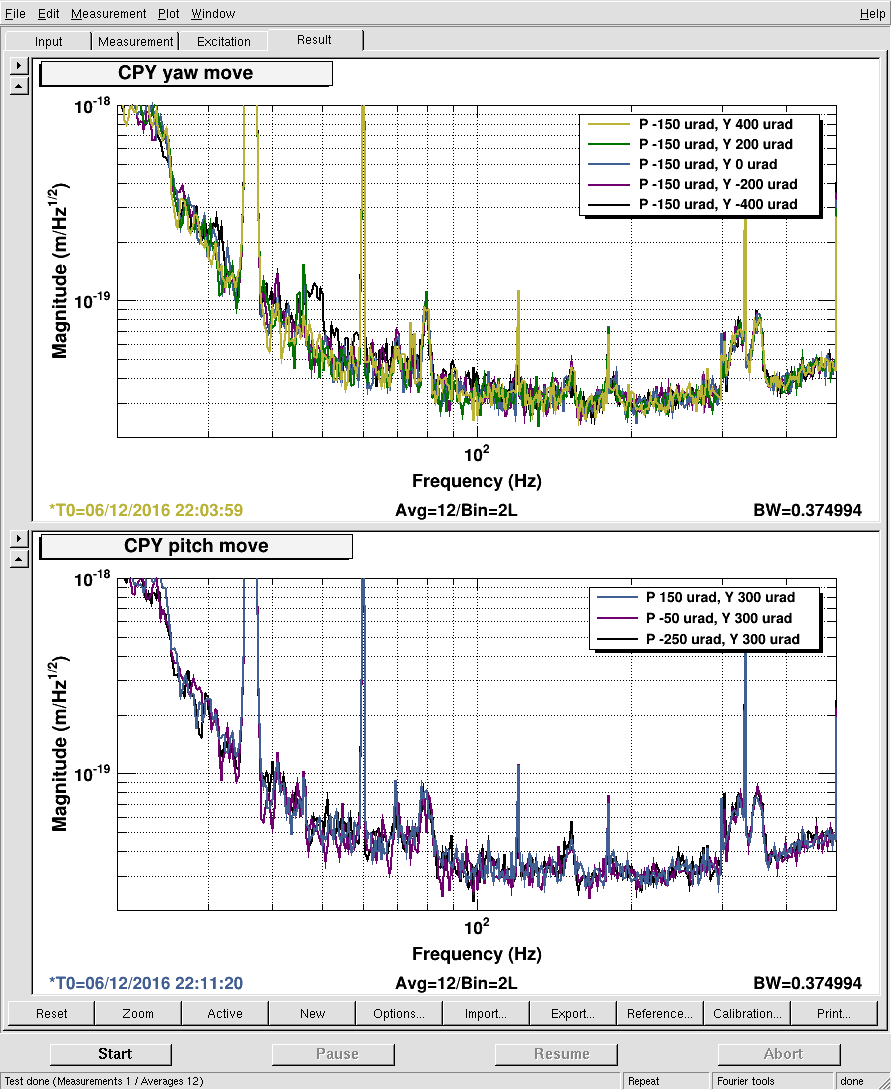
Now that the IMC ASC model is running at high frequencies, we can include jitter injections to 7kHz in our noise budget. This is a quick (10 minute) measurement injecting pitch and yaw on the IMC PZT. |
|
|
6383.html |
2016-12-05 13:50 |
At both end stations: disconnect WAP ethernet cables from switch and re-activate switch port to permit future use of WAP during O2 when needed. [“WAP” = wireless access point] |
32201 & 32342,& 32250 |
|
6382.html |
2016-12-05 13:39 |
Add second camera capture card in h1hwsmsr and see if we can capture two images without interference between each other. |
32250 |
|
6381.html |
2016-12-05 12:18 |
Replace the TCSY Flow meter. Turn TCSY laser off, valve out piping volume, remove yellow paddle wheel flow meter, install new one (same version/model number). Check flow, get laser going again - will need to stabilize. |
|
|
6380.html |
2016-12-05 12:05 |
Insert zp(160,16) for all four segments of ETMX oplev. See https://alog.ligo-wa.caltech.edu/aLOG/index.php?callRep=32115 |
32199 |
|
6379.html |
2016-12-05 11:57 |
To search for a permanent solution for the ISS first loop, we will make the following temporary change in the optical configuration for the ISS box. This shouldn't impact on the H1 noise or stability performance because the ISS box is used only for monitoring purpose. We will swap mirror M32 with a low reflective mirror (R~a few %). This will reduce the amount of the light entering the ISS box from approximately 400 mW to ~10 mW. In addition, we will place an extra beam dump (a black hole type) to dump the transmission behind M32. Once the mirror is swapped, we will adjust the half wave plate in the ISS box to maximize the p-polarizing light falling on the PDB photo detector. |
32206 & 32215 |
|
6378.html |
2016-12-05 11:31 |
ECR1600364 add 5 slow channels to DMT broadcaster to help with ETMX ESD diagnostics by detchar. |
32195 & 32212 |
|
6377.html |
2016-12-05 08:58 |
Isolate PT180 from site vacuum volume and pump with temporarily connected rotating shaft pumps to compare gauge drift behavior. Requires work at height via ladder also LASER SAFE in LVEA |
32185, 32209, & 32260 |
|
6376.html |
2016-12-05 08:57 |
Clean the PSL enclosure Anti-Room and Laser Room. Peter K. will escort and assist |
32183 |
|
6375.html |
2016-12-05 08:40 |
Adjust the reference cavity periscope alignment because the reference cavity transmission has fallen by ~1/3rd. |
32183 |
|
6374.html |
2016-12-05 07:55 |
ECR: Add a 16 kHz DAQ channel to monitor the RIN in reflection |
32191 & 32212 |
|
6373.html |
2016-12-05 07:54 |
ECR: Increasing processing rate of ASCIMC model |
32192 & 32212 |
|
6372.html |
2016-12-05 07:12 |
Install new High Voltage supplies for the ESD Replacing the Kepco units. This should stop the random tripping that has occurred in the past. |
32186 |
|
6371.html |
2016-12-05 07:09 |
Replace analog camera with GigE camera removed from ISCT6. Use same network path so no switch work is required. |
32197 & 32212,& 32245 |
|
6370.html |
2016-12-04 12:02 |
Update calibration on the DMT to gstlal-calibration-1.1.0-v1 and restart it during next maintenance or opportunity on 12/5 or 12/6 at LHO. * Bug fix to make the output of primary and redundant pipeline identical * Additional coherence gating in the kappa_tst calculation |
32188 |
|
6369.html |
2016-12-02 15:15 |
Try some different ST2 & ST1 configurations during high microseism and wind. Specifically, try changing ST2_CONF nodes to 250_SC_A and see if there is any improvement in IFO controls. Requires consideration of impact on science segments. Transitions, testing to be done only during single IFO time. |
32147 |
|
6368.html |
2016-12-02 12:01 |
Continue with schedule of roaming high-frequency calibration line from PCALX to establish high-frequency calibration uncertainty. Switching frequencies will only occur in either Single IFO time or when IFO is down, otherwise we should be observation ready. Detchar will continue to be informed. We expect to complete the schedule in ~1 week, and then line will be turned off until further notice. |
32179 |
|
6367.html |
2016-12-01 11:29 |
I will build a new guardian machine on a fast front end computer using Debian 8 as OS, the long term plan is move the guardian process and nodes into this new machine gradually. We will move all the process offline without interruption on the current production server. |
|
|
6366.html |
2016-11-30 16:43 |
memory usage on h1guardian0 has increased significantly over the past few weeks. At the next opportunity we will increase it from 12GB to 48GB. |
32112 |
|
6365.html |
2016-11-30 12:45 |
fix bug discussed in bug report 1062 and alog 31996 and comments |
|
|
6364.html |
2016-11-30 08:16 |
Restart h1hwsmsr computer. |
|


Back to Observe 2:01 UTC.