Ops Shift Log: 01/18/2017, Evening Shift 00:00 – 08:00 (16:00 - 00:00) Time - UTC (PT)
State of H1: IFO locked at NOMINAL_LOW_NOISE
Intent Bit: Commissioning
Support: Sheila,
Incoming Operator: Travis
Shift Summary: Ran initial alignment. Had a bit of problem with Y-Arm green and Input Align. After correcting these, the rest of the alignment went smoothly. The IFO relocked on the first try with no apparent problems. Just after relocking, Sheila pointed out the A2L noise looked bad. DTT confirmed it was. Ran the A2L script. PI Modes 27 & 28 had also rung up. Both were suppressed. Put the IFO back into Observing.
After Lockloss could not get ALS to lock the arms. After several tries decided to run Initial Alignment. The alignment hung up on SRC_ALIGN, which eventually tripped the SUS SRM
WD. I could not reset the M1 watchdog from the OPS terminal. Sheila reset the WD from a remote session, and SRC_ALIGN completed when rerun. Tried relocking again. There was still problems with locking, so ran another initial alignment, which completed without issue.
Tried relocking again but cannot get past SWITCH_TO_QPDS. After finding some O1 aLOGs tried waiting for 3 minutes at CARM_ON_TR for 3 minutes, and for good measure 2 minutes at REDUCE_CARM_OFFSET. This time made it past SWITCH_TO_QPDS and all the way to NOMINAL_LOW_NOISE. Set the intent bit to Observing.
Activity Log: Time - UTC (PT)
00:00 (16:00) Take over from TJ
00:15 (16:15) Run Initial Alignment, followed by relocking
01:27 (17:27) Relocked at NOMINAL_LOW_NOISE. Power at 28.7W. Range is 68.1 Mpc
01:39 (17:39) Cleared SDF and selected the Observe intent bit
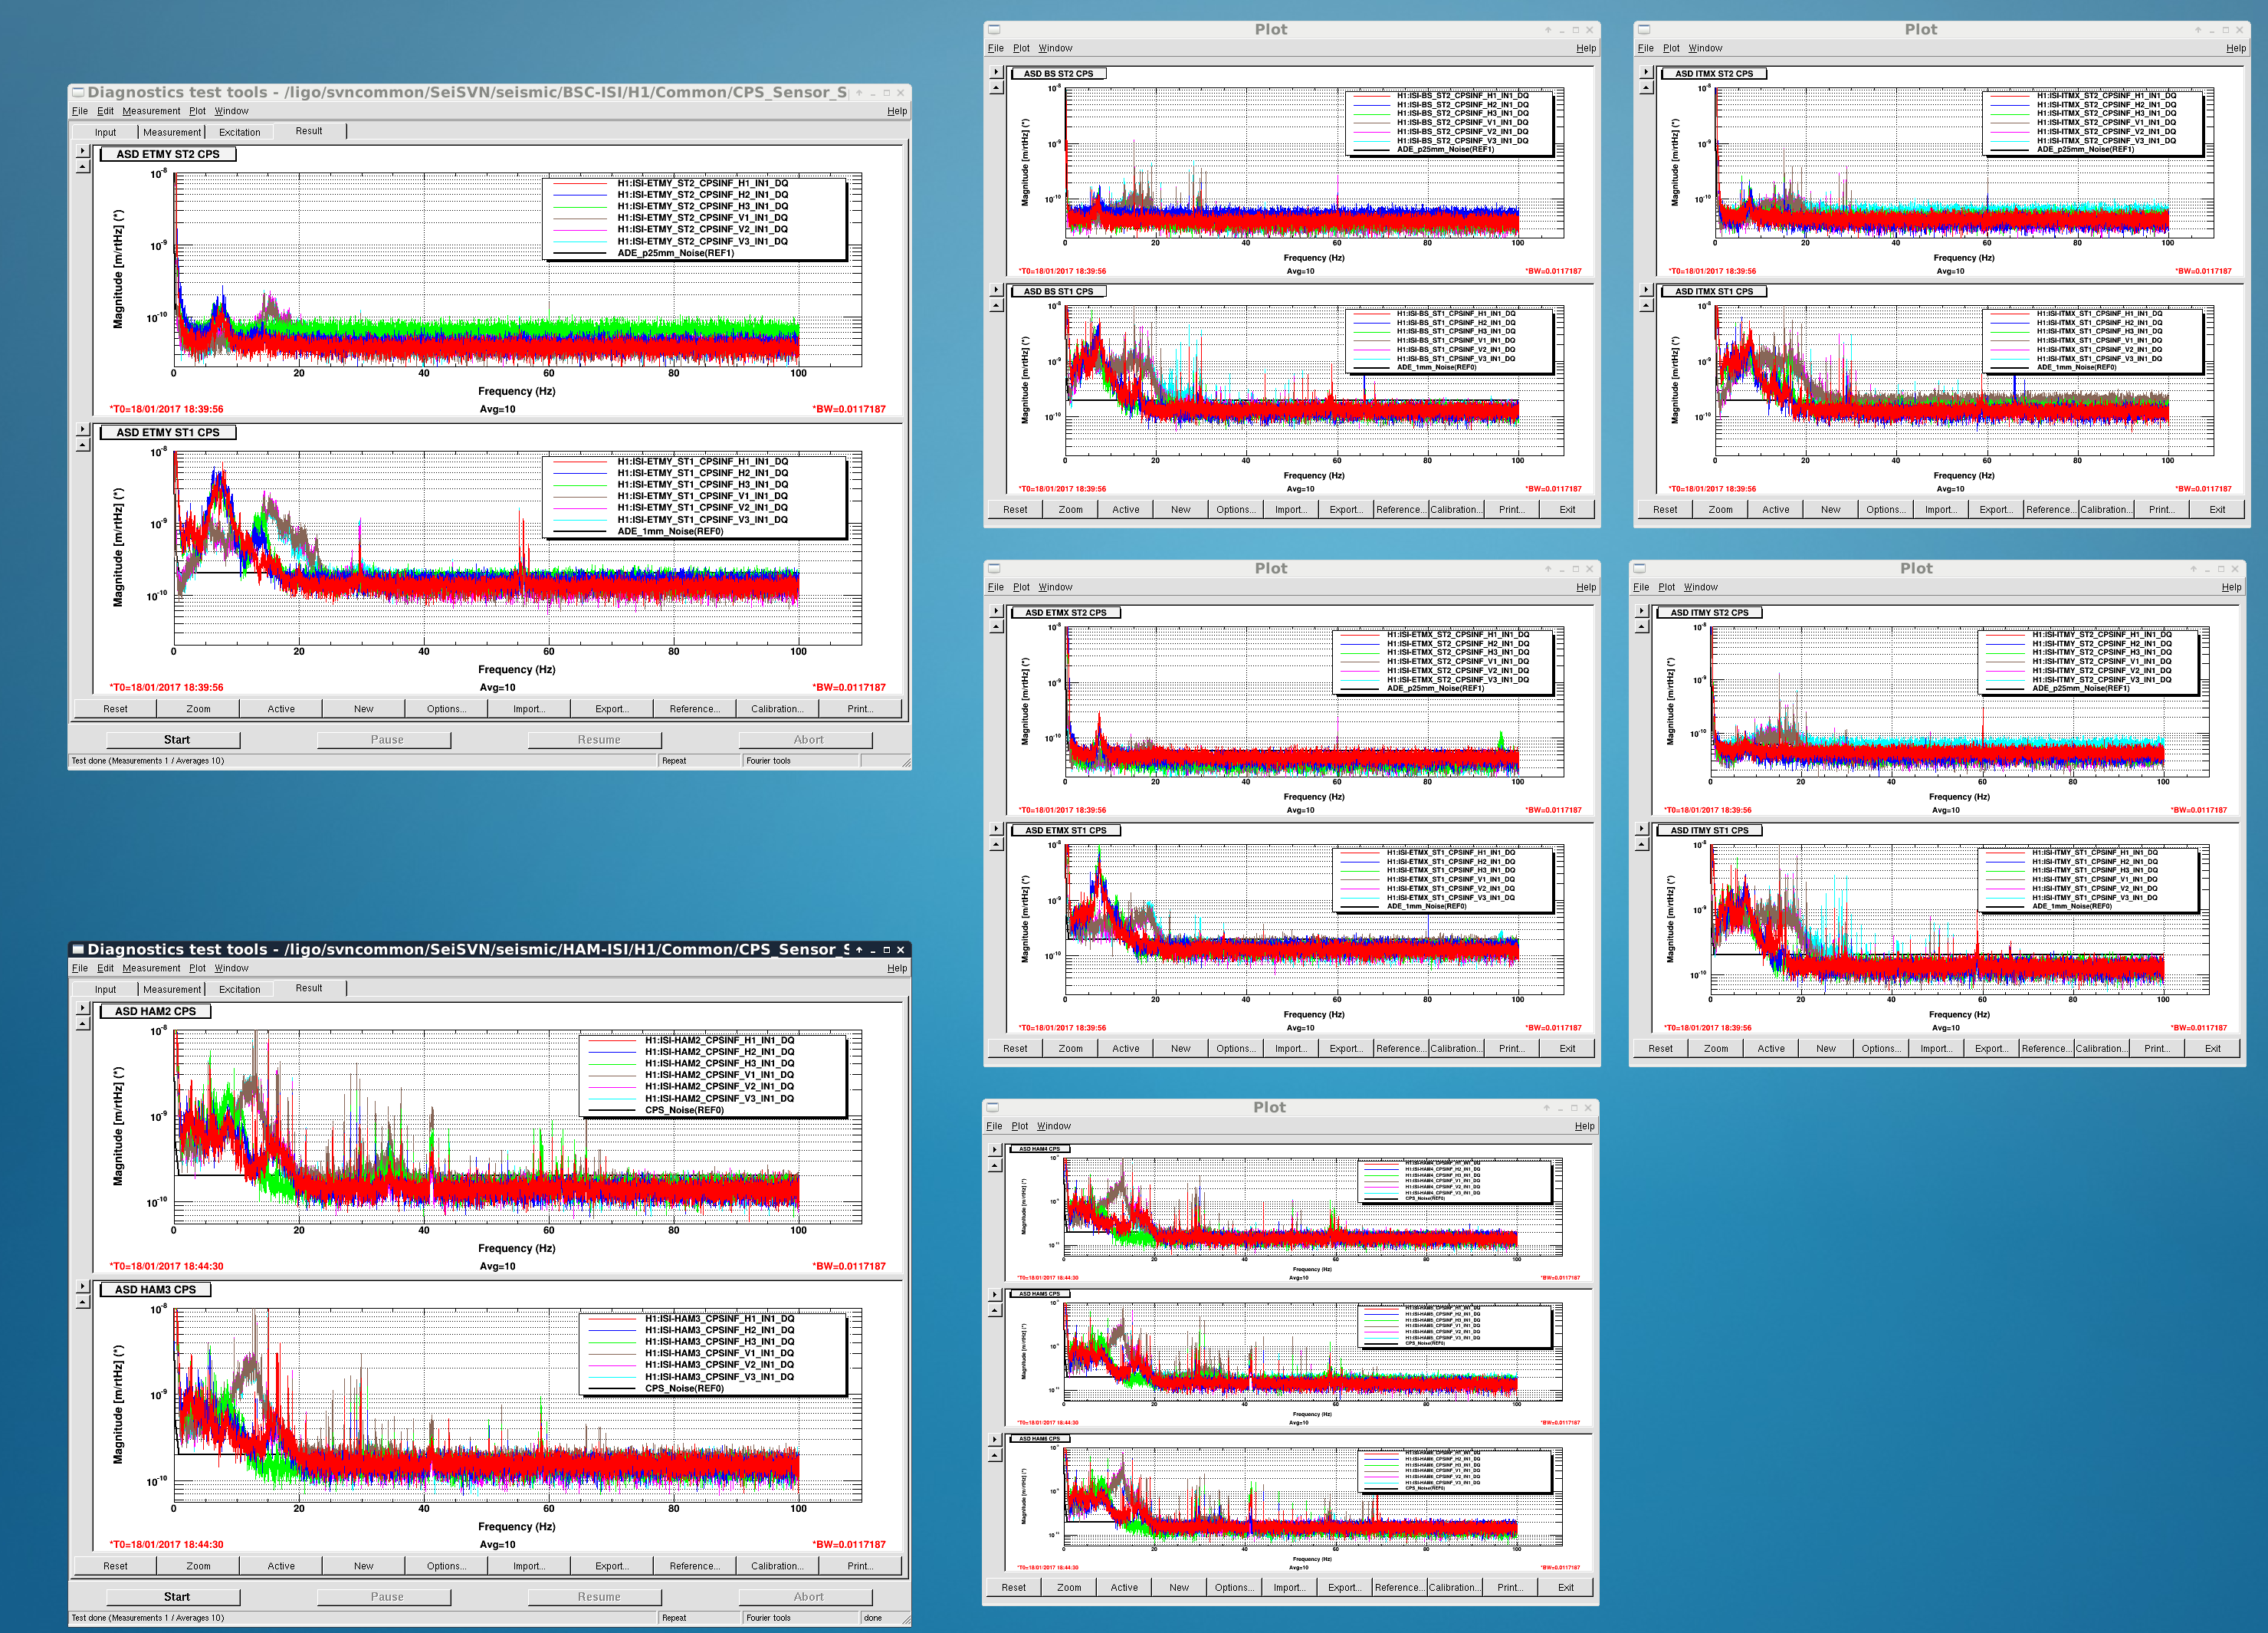
01:46 (17:46) Run A2L DTT script – Coherence bad between 20 and 55 Hz.
01:50 (17:50) Run A2L script
01:59 (17:59) Suppressed PI Modes 27 & 28 which were ringing up
02:06 (18:06) Intent bit back to Observing
04:01 (20:01) Lockloss
04:19 (20:19) No luck getting past LOCKING_ALS so rerun Initial Alignment
05:29 (21:09) GRB – IFO unlocked
07:54 (23:54) Relocked at NOMINAL_LOW_NOISE, power at 29.1W, range at 67.2 Mpc
08:00 (00:00) Turn over to Travis