corey.gray@LIGO.ORG - posted 16:41, Saturday 21 June 2025 (85215)
Sat DAY Ops Summary
TITLE: 06/21 Day Shift: 1430-2330 UTC (0730-1630 PST), all times posted in UTC
STATE of H1: Lock Acquisition
INCOMING OPERATOR: Ryan S
SHIFT SUMMARY:
LOG:
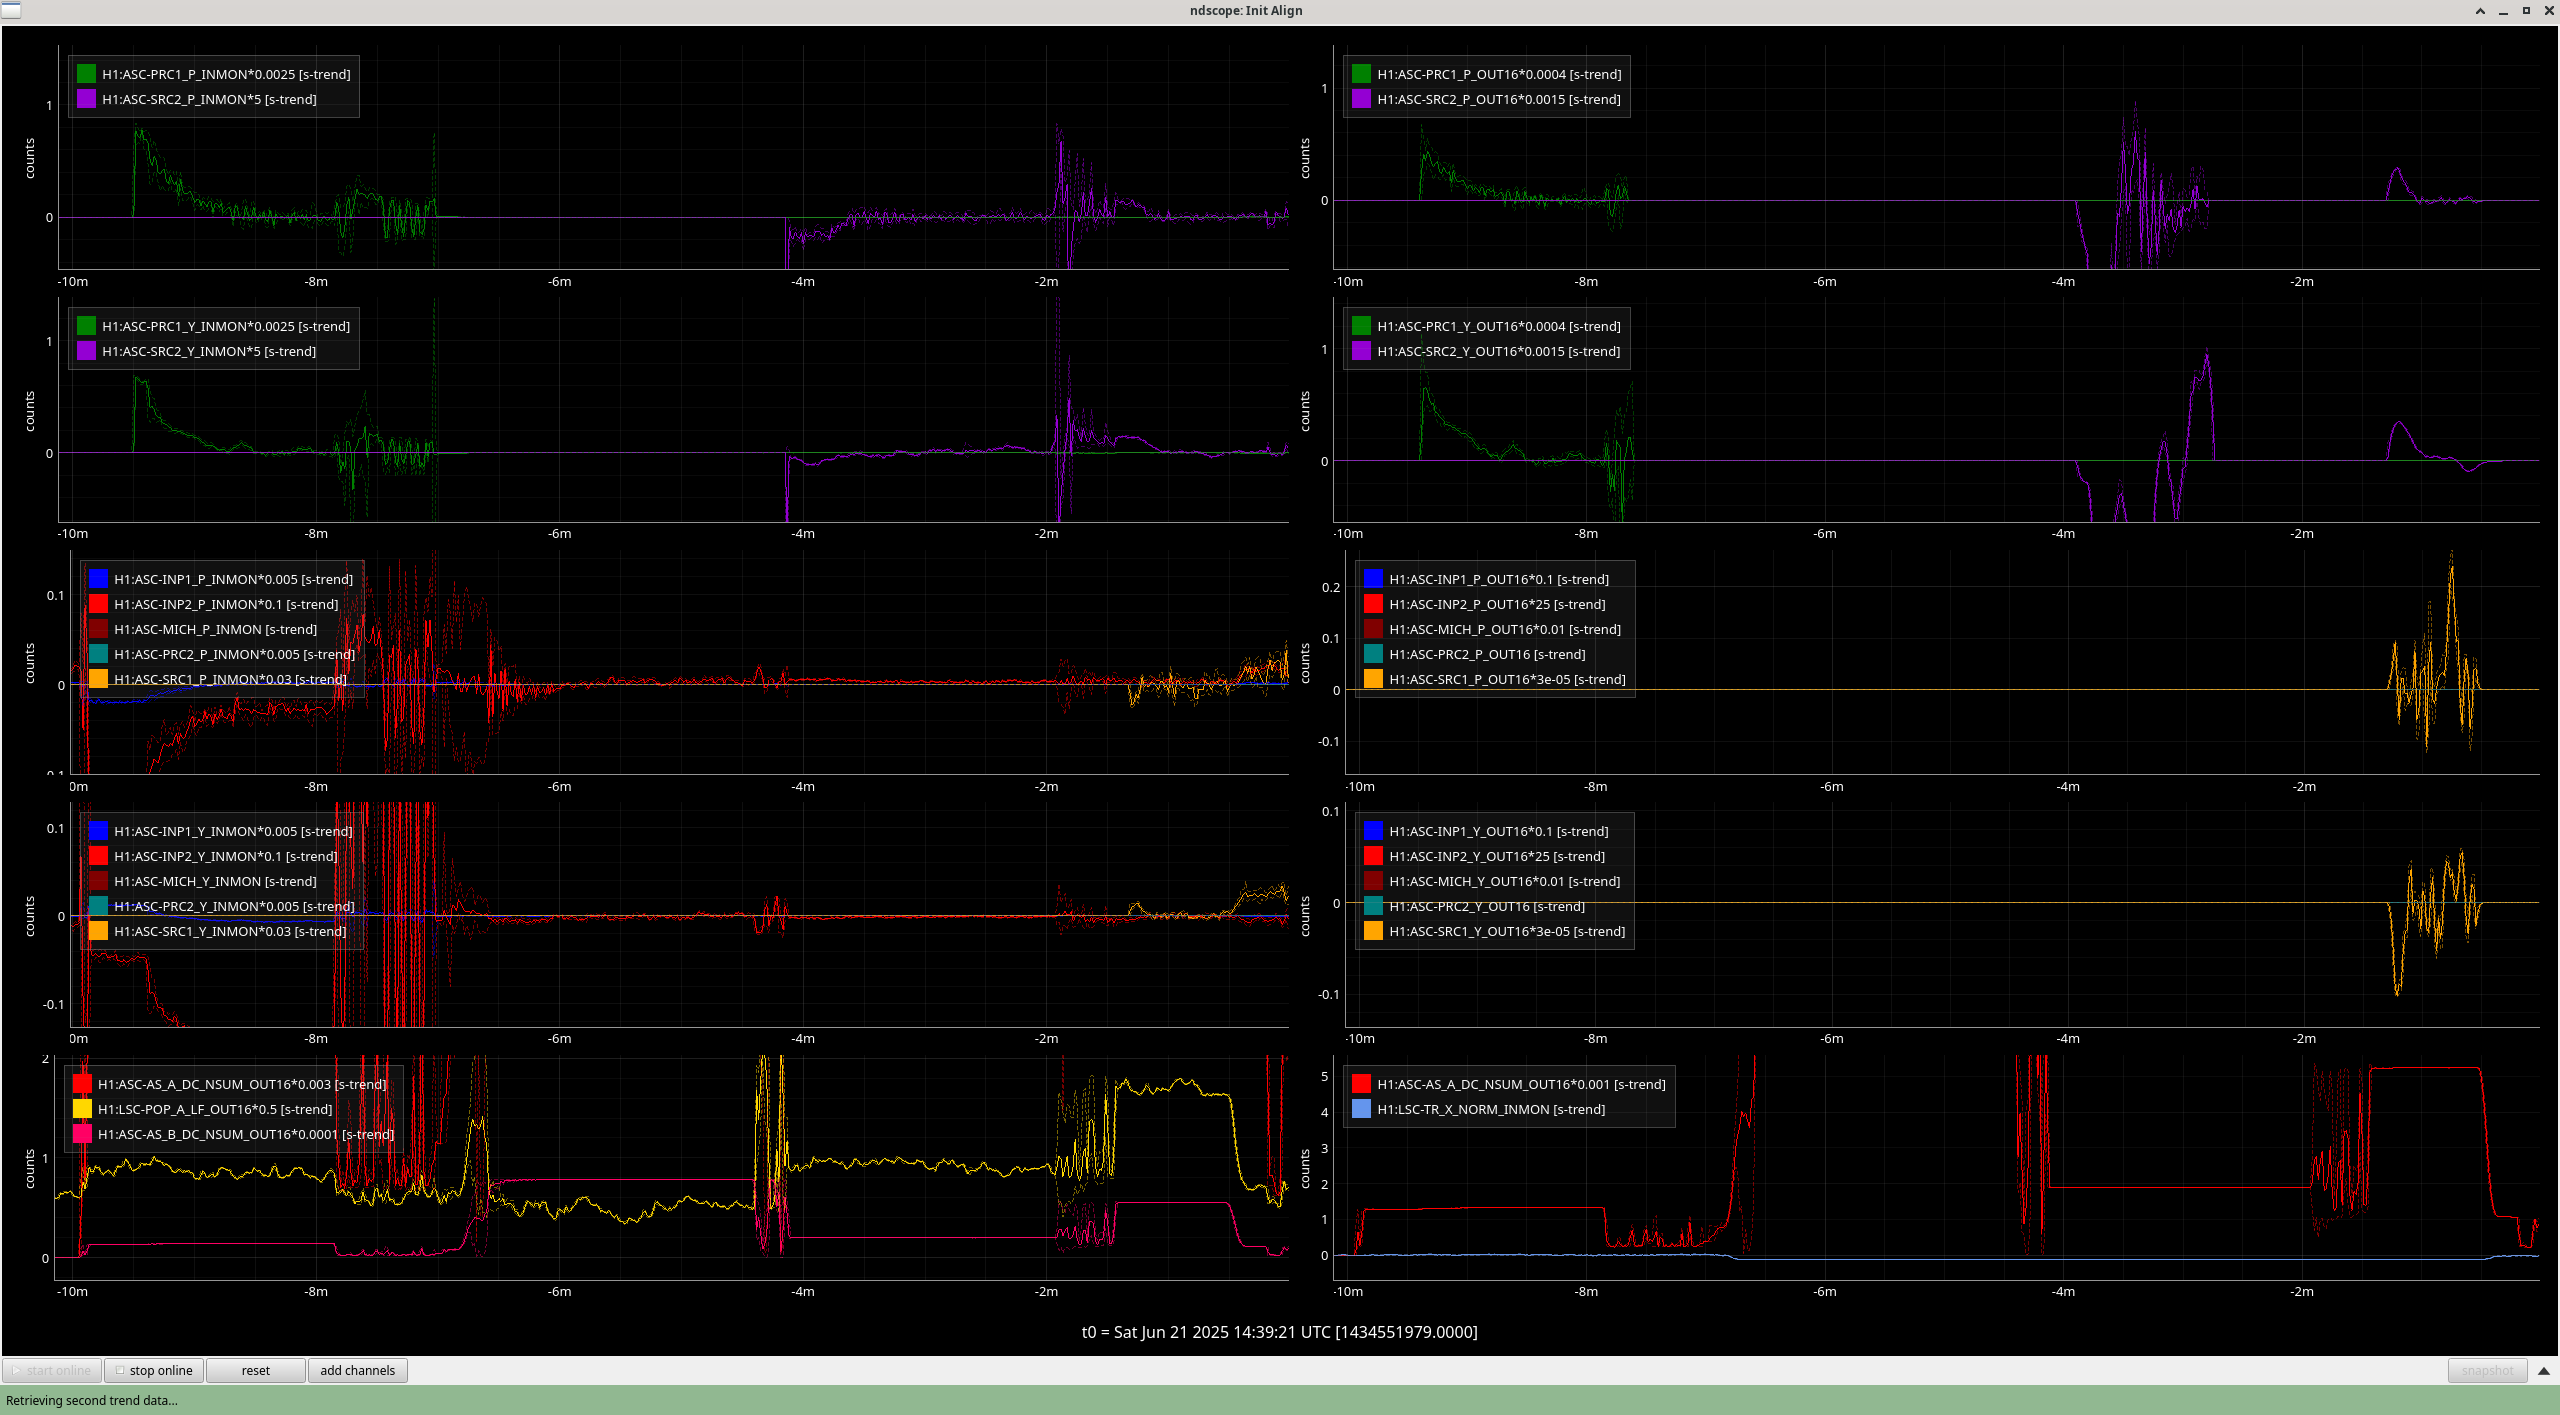
- 1420 ISC LOCK & INIT ALIGN loaded
- 1423-1439 INITIAL ALIGNMENT started for a 2nd time but with reloaded init align
- 1440 LOCKING (60W at about 1526---paving way for thermalized h1 for calibration at 1830utc)
- 1541 back to OBSERVING
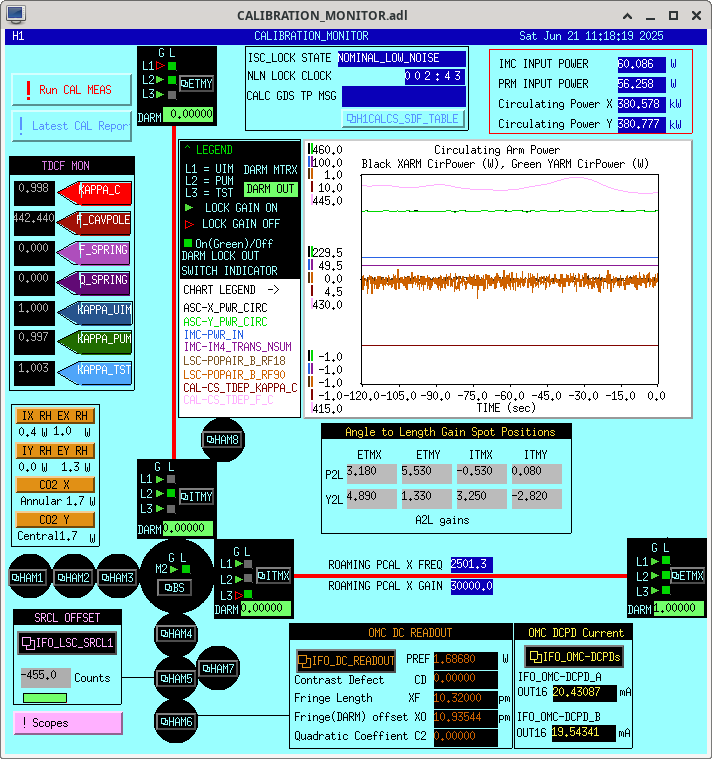
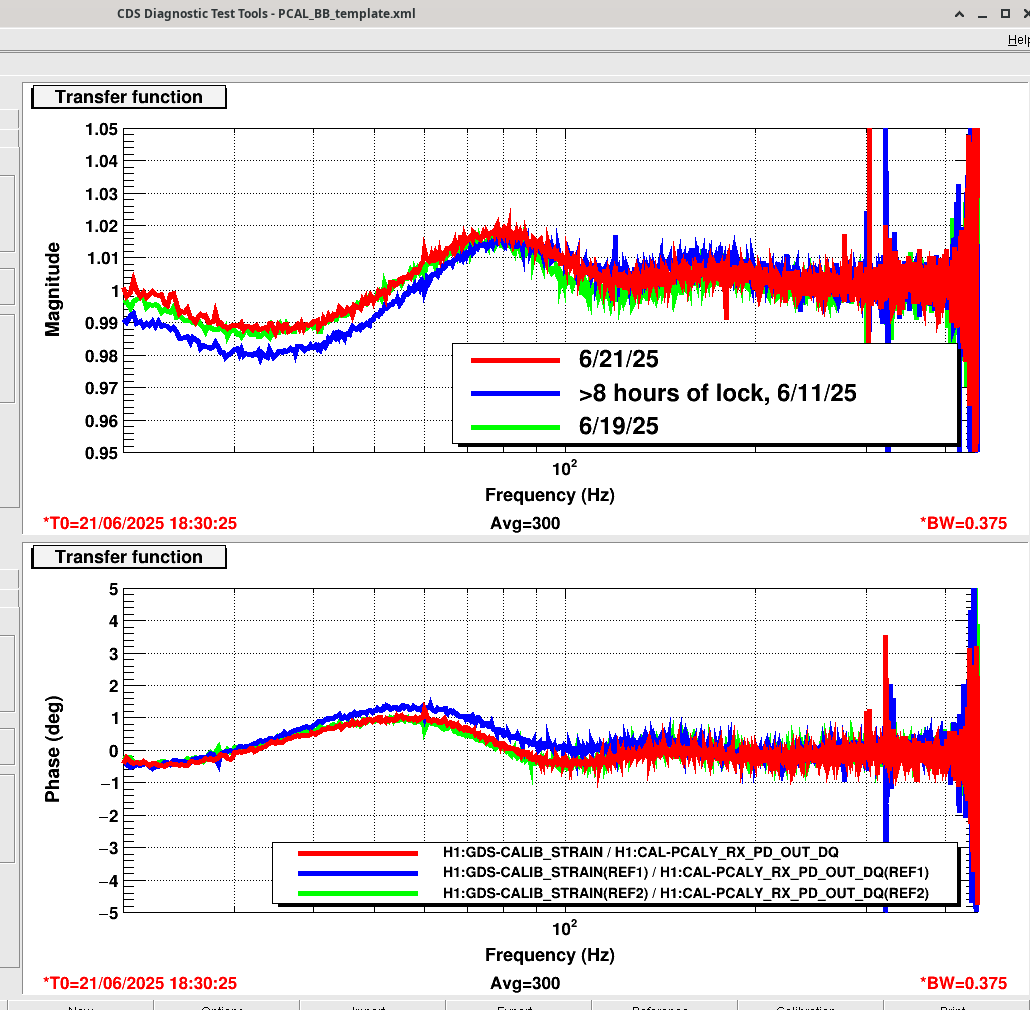
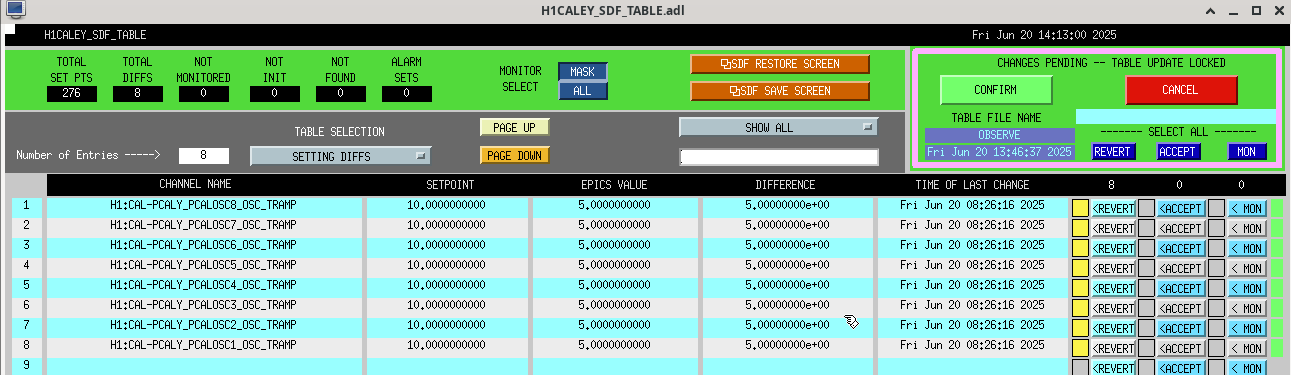
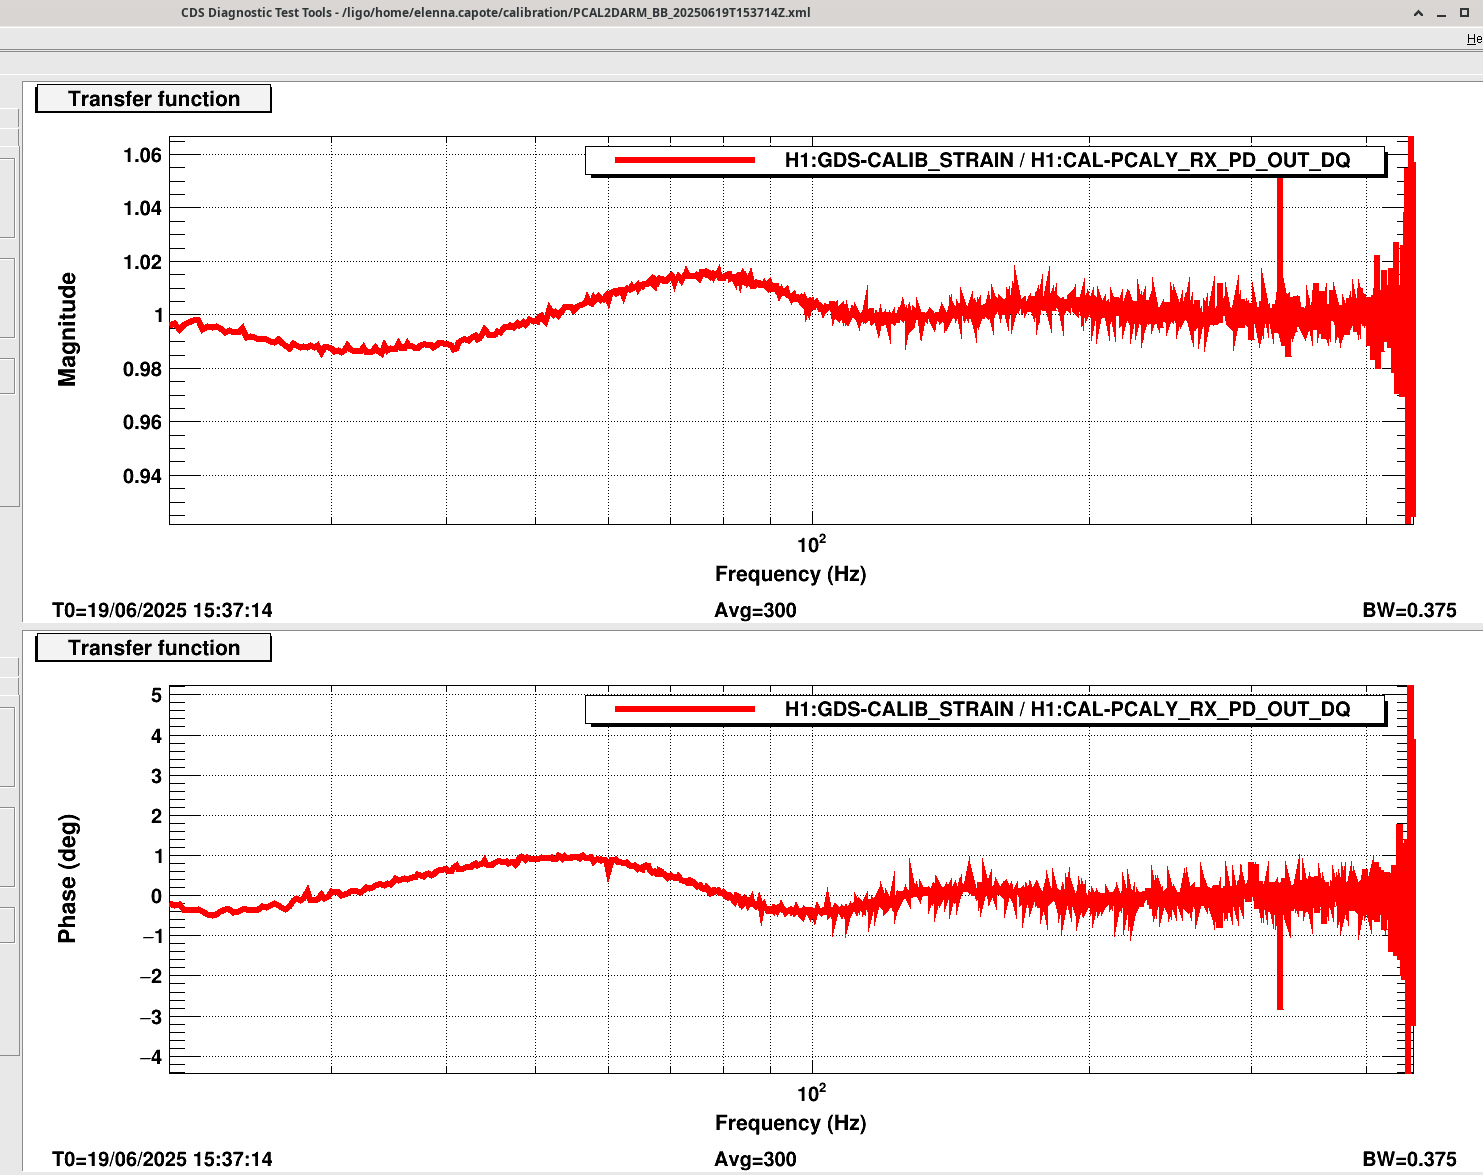
- 1830-1859 Saturday Calibration
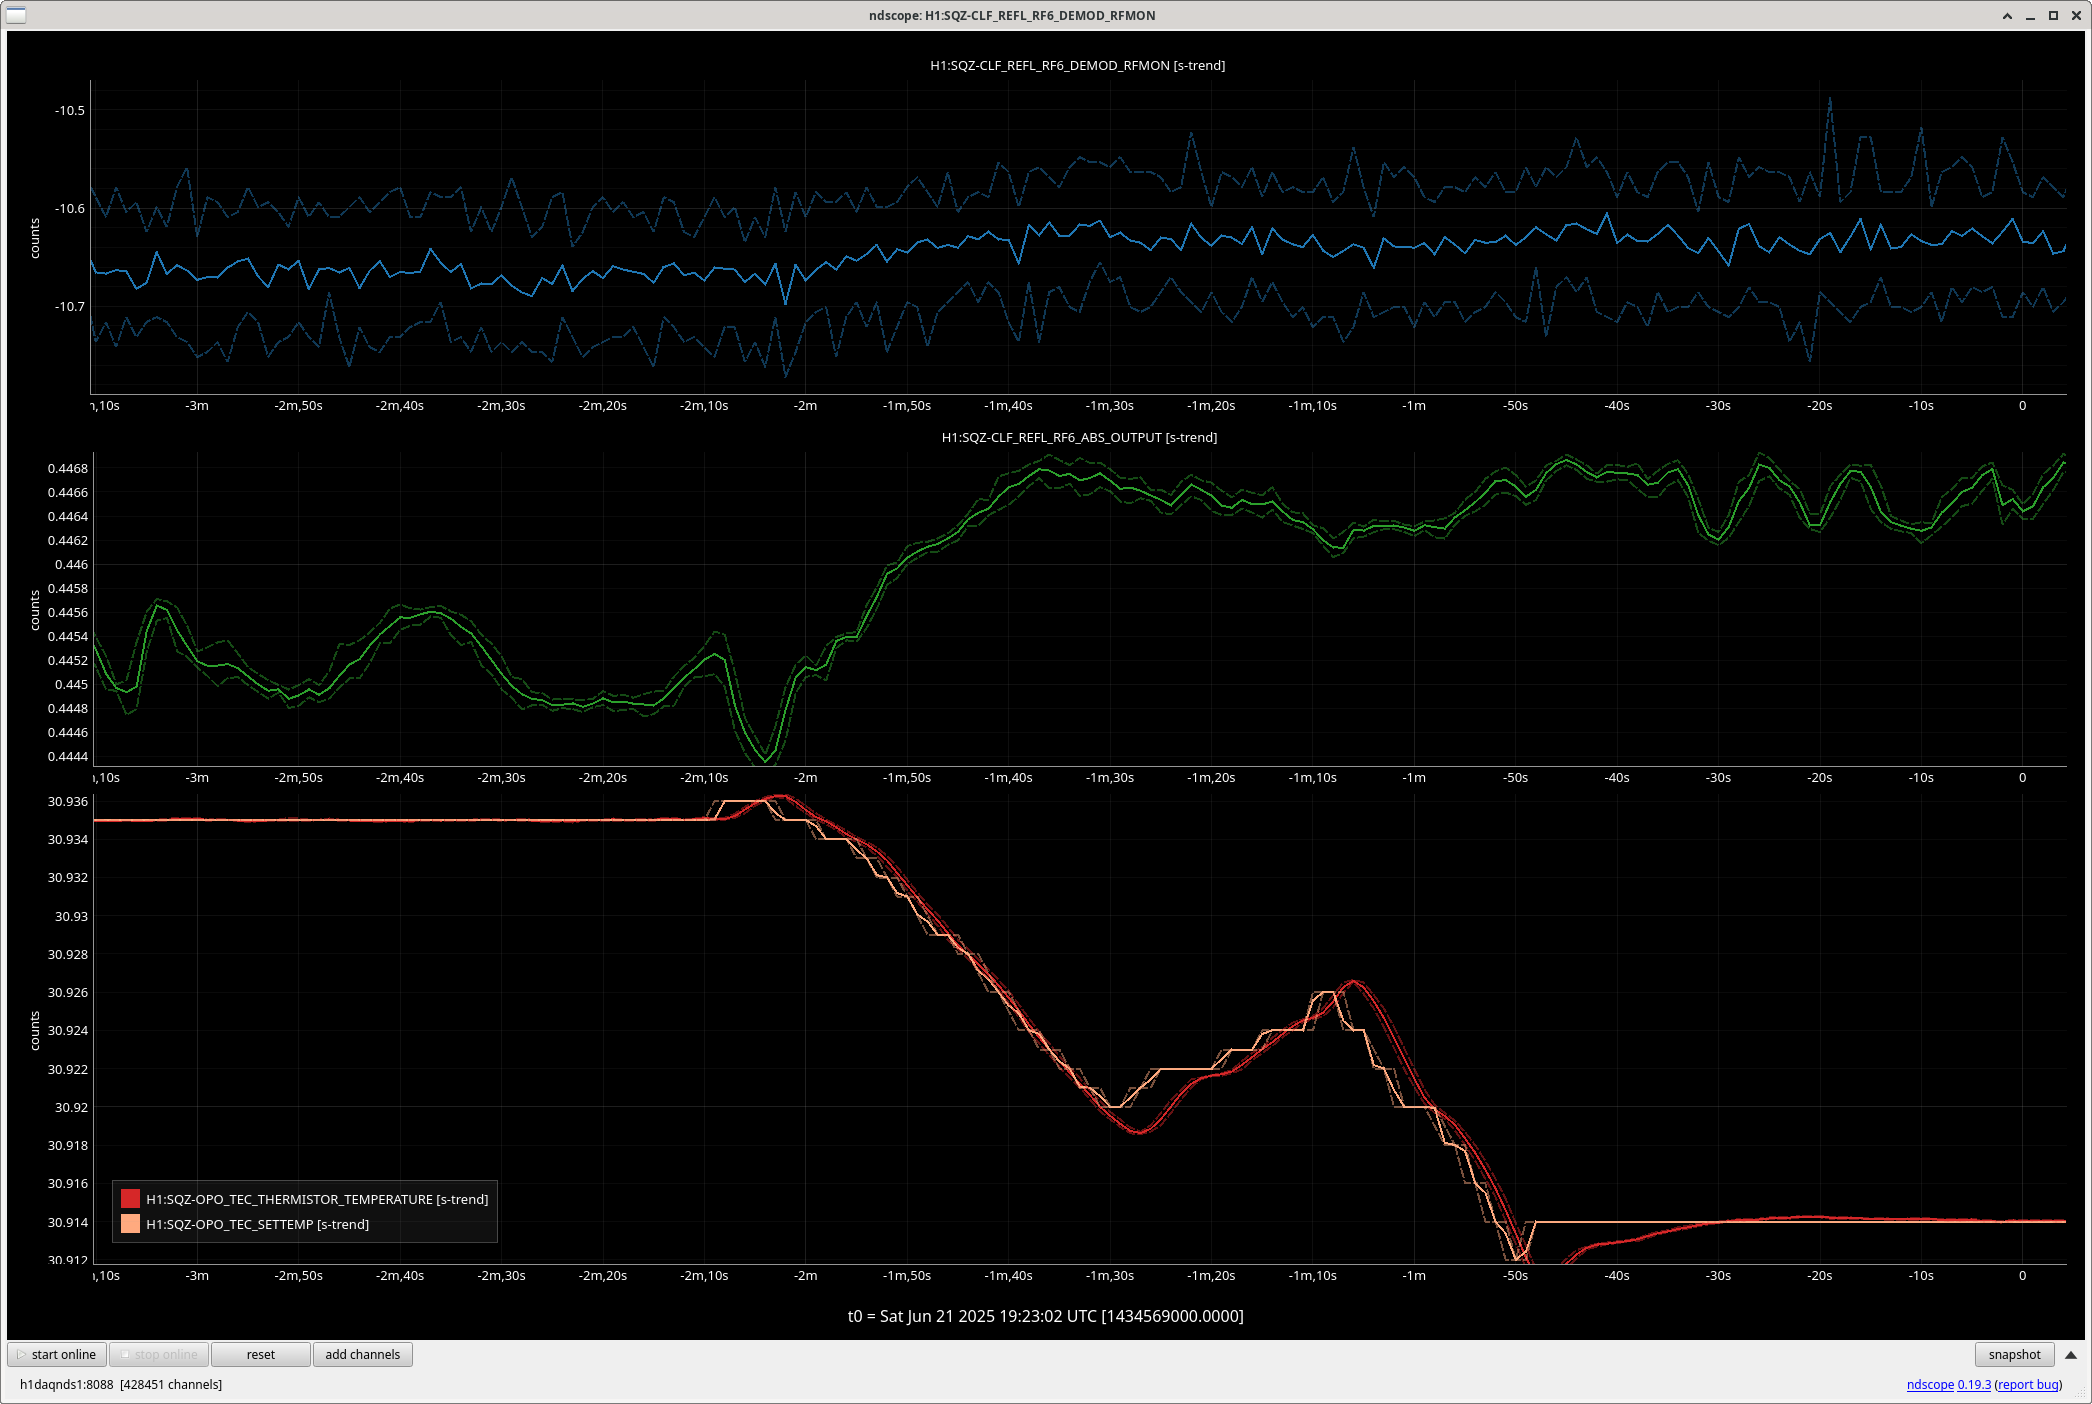
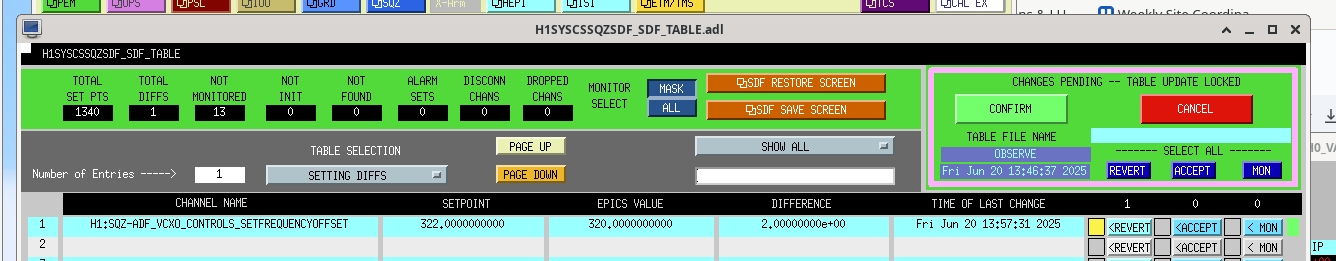
- 1917-1919 and 1949-1956: Out for Sqz Adjustments afterr noticing H1-Live channel was higher than reference (Vicky helped me get through this).
- 2202 Lockloss due to M6.1 EQ @Japan (this was preceded by EQ alarms on Verbal and EQ Mode toggled between states a few times)
- 2300-2321 Initial Alignment


Back to observing at 00:19 UTC. Fully automated relock after a fully automated initial alignment.