Talked with John & Bubba little bit about water pipe that burst yesterday.
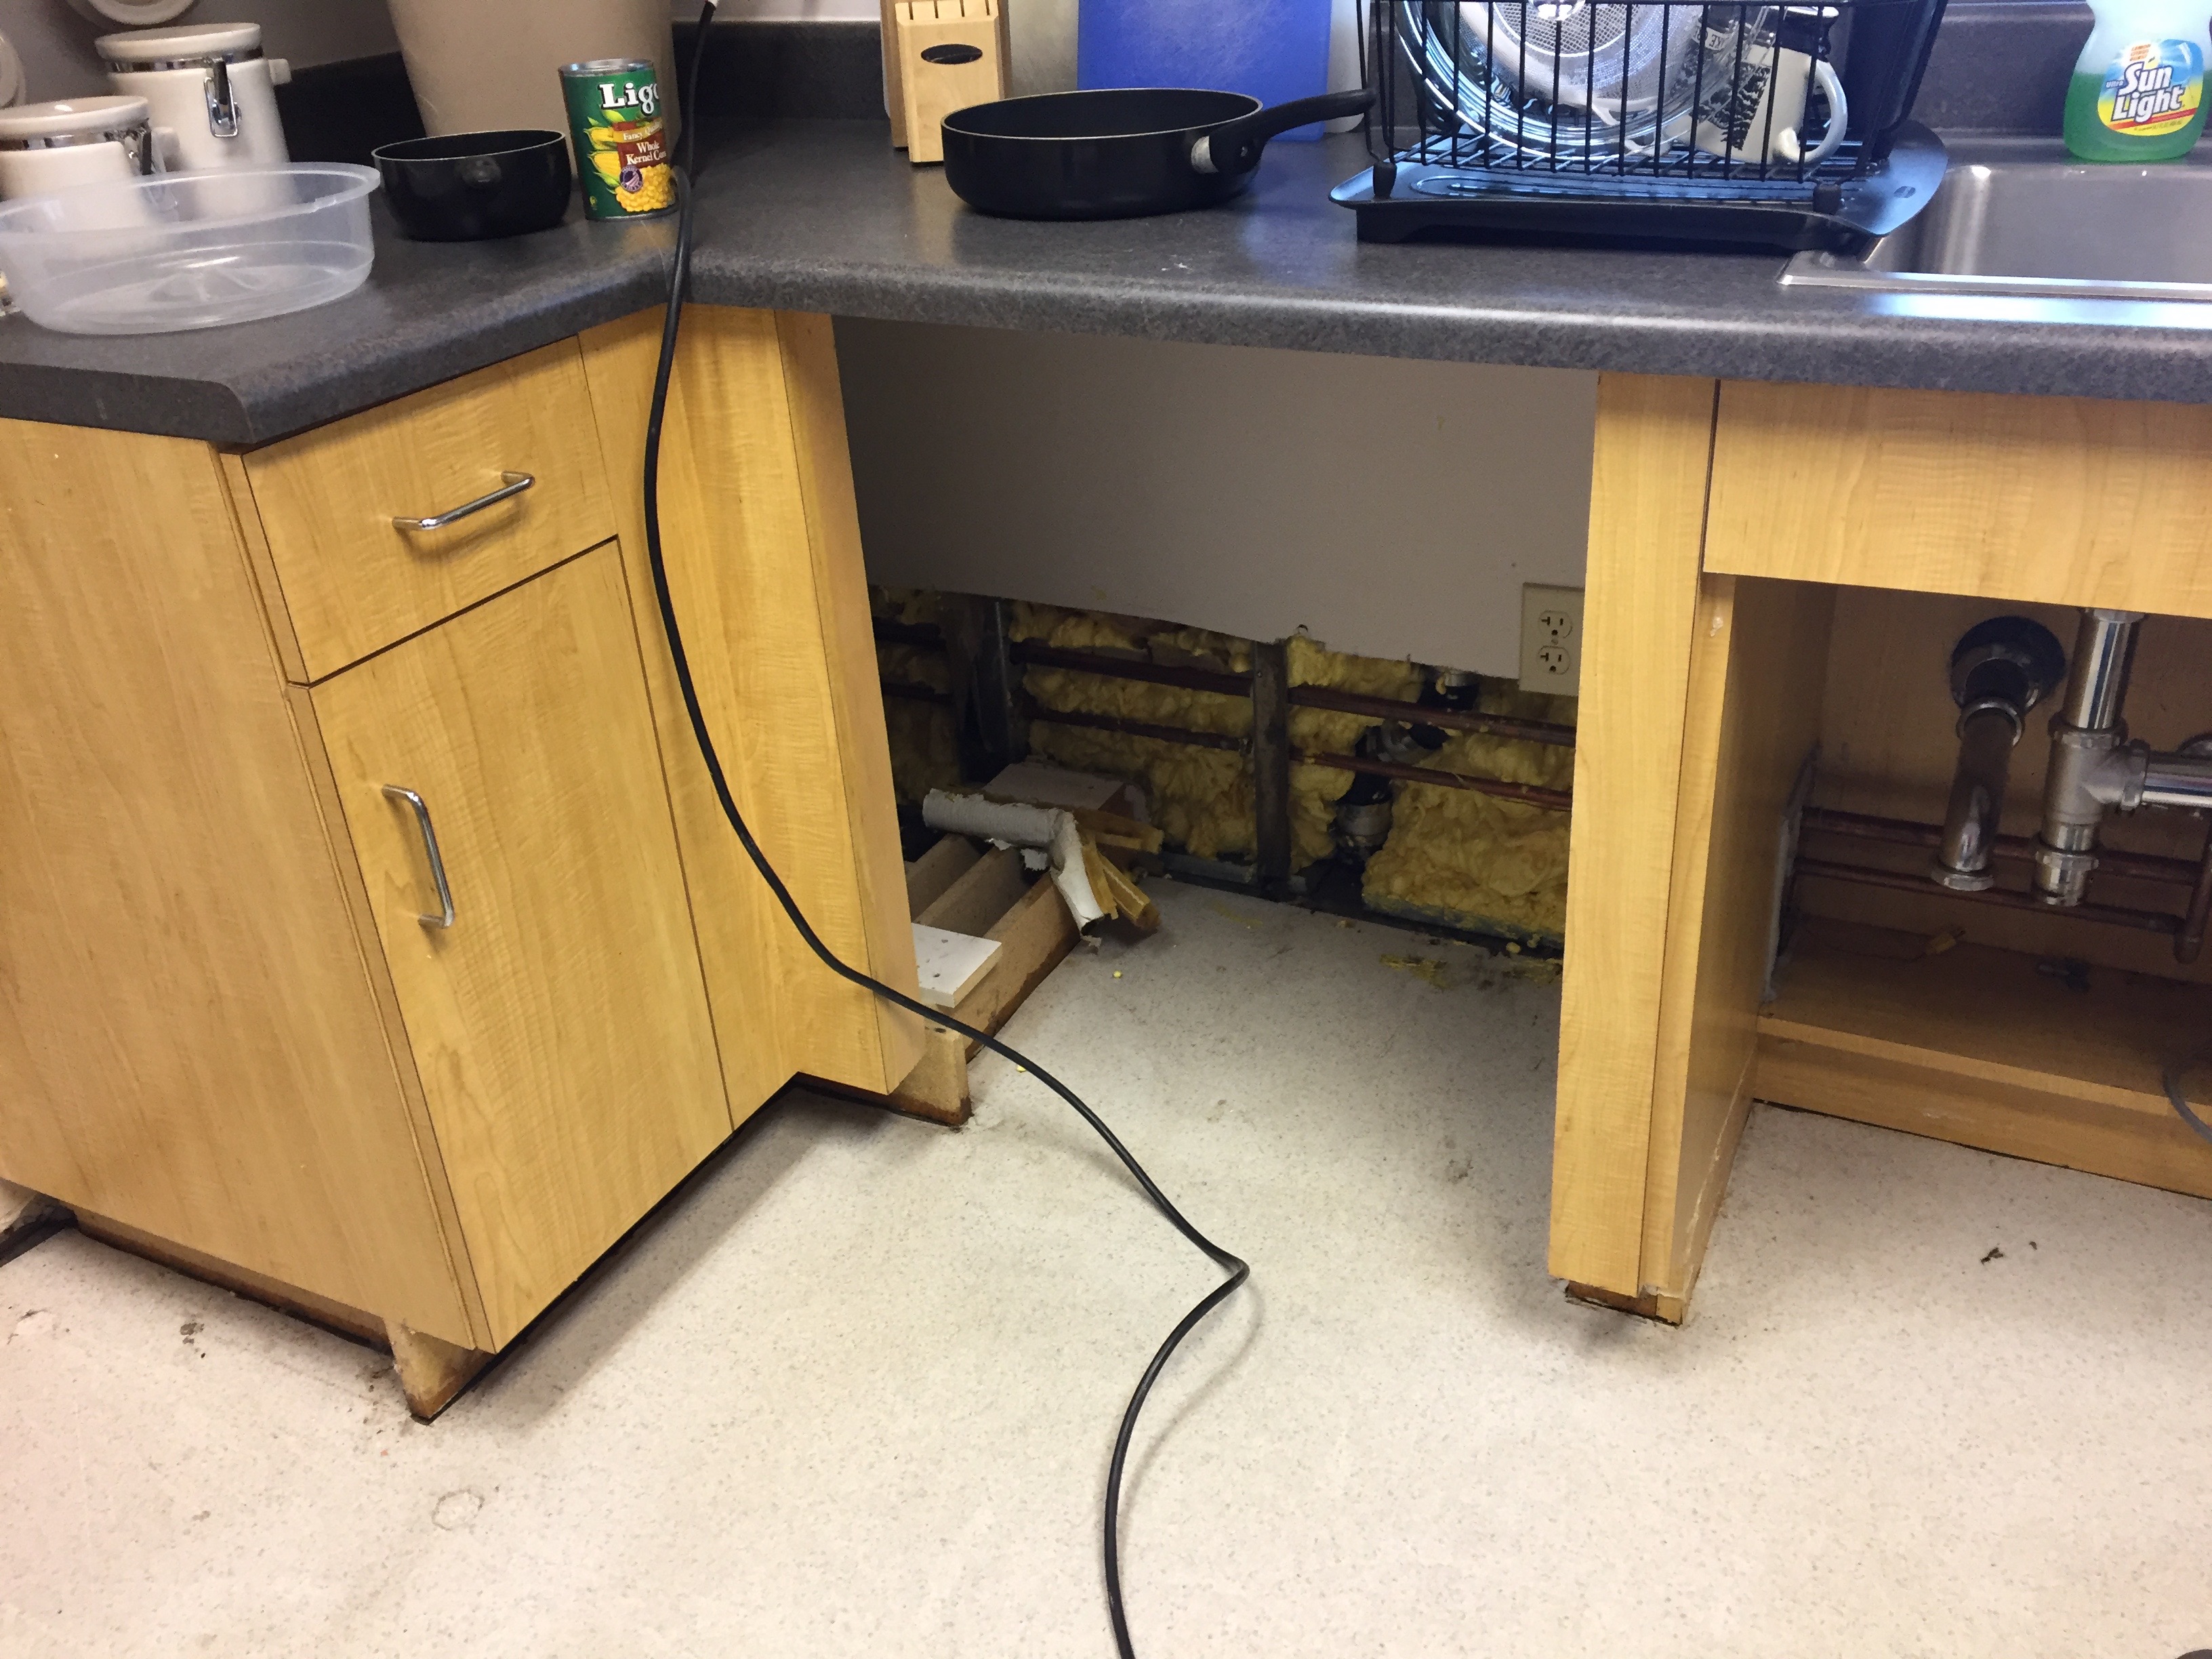
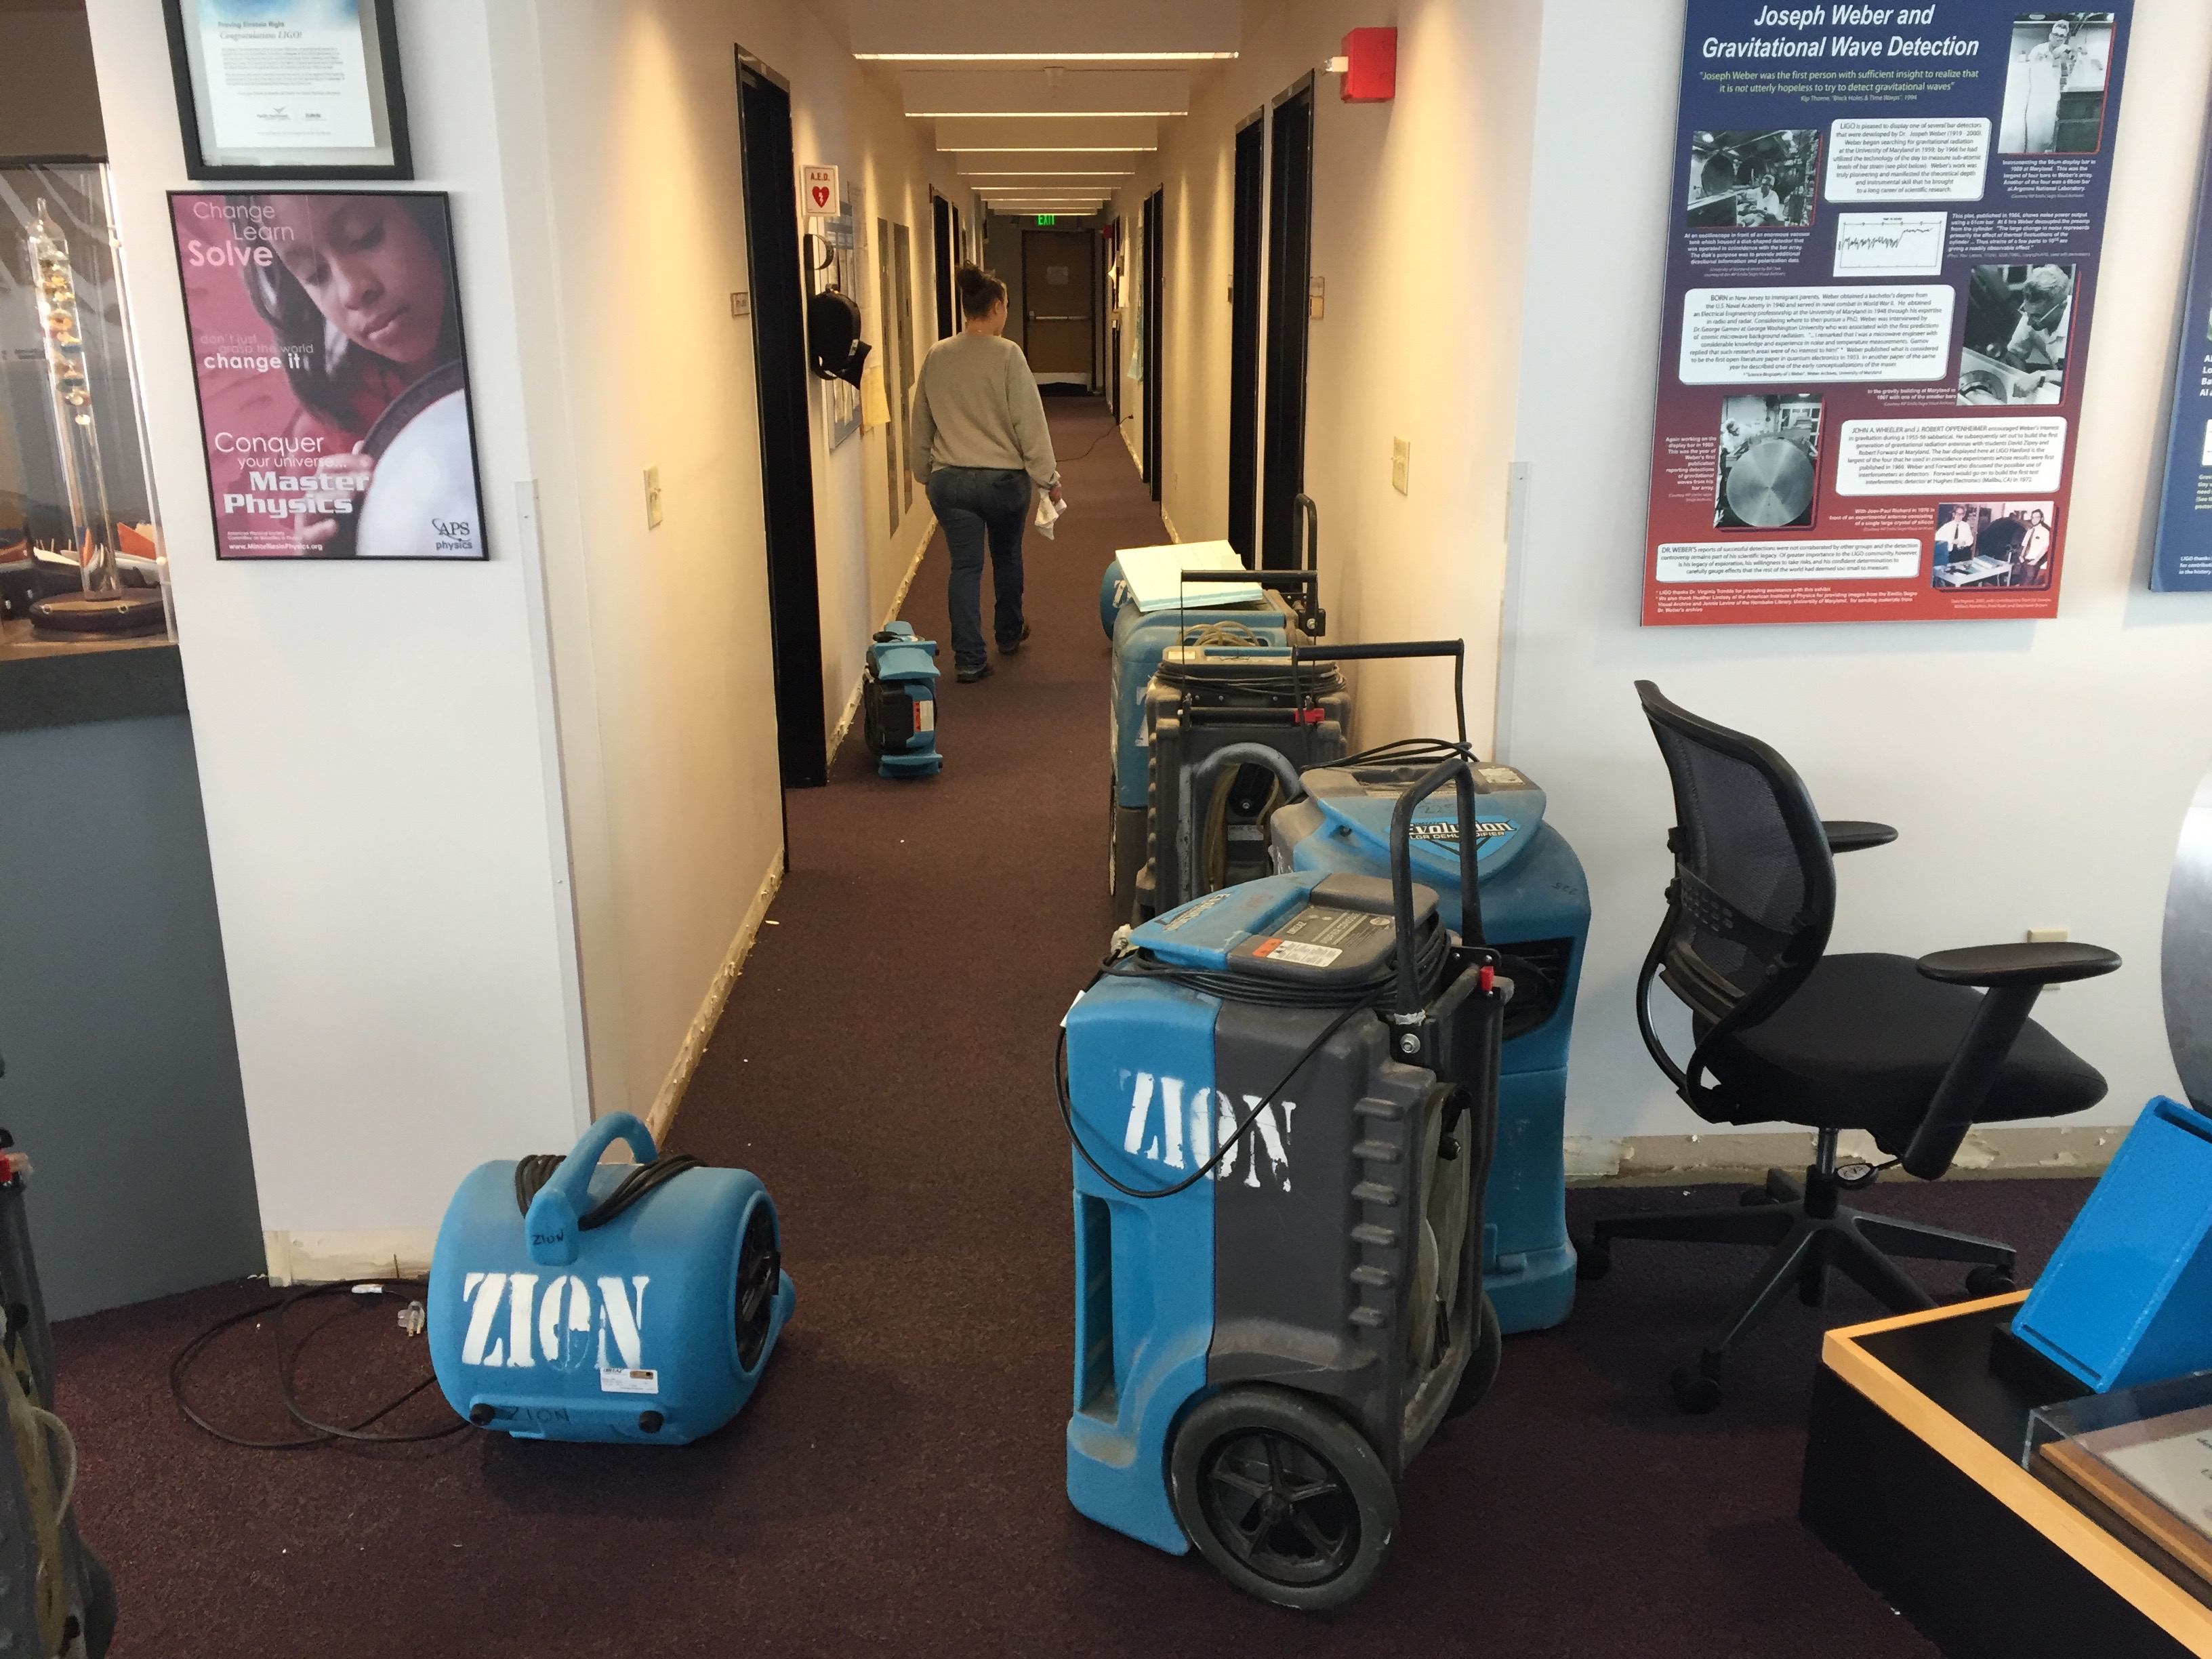
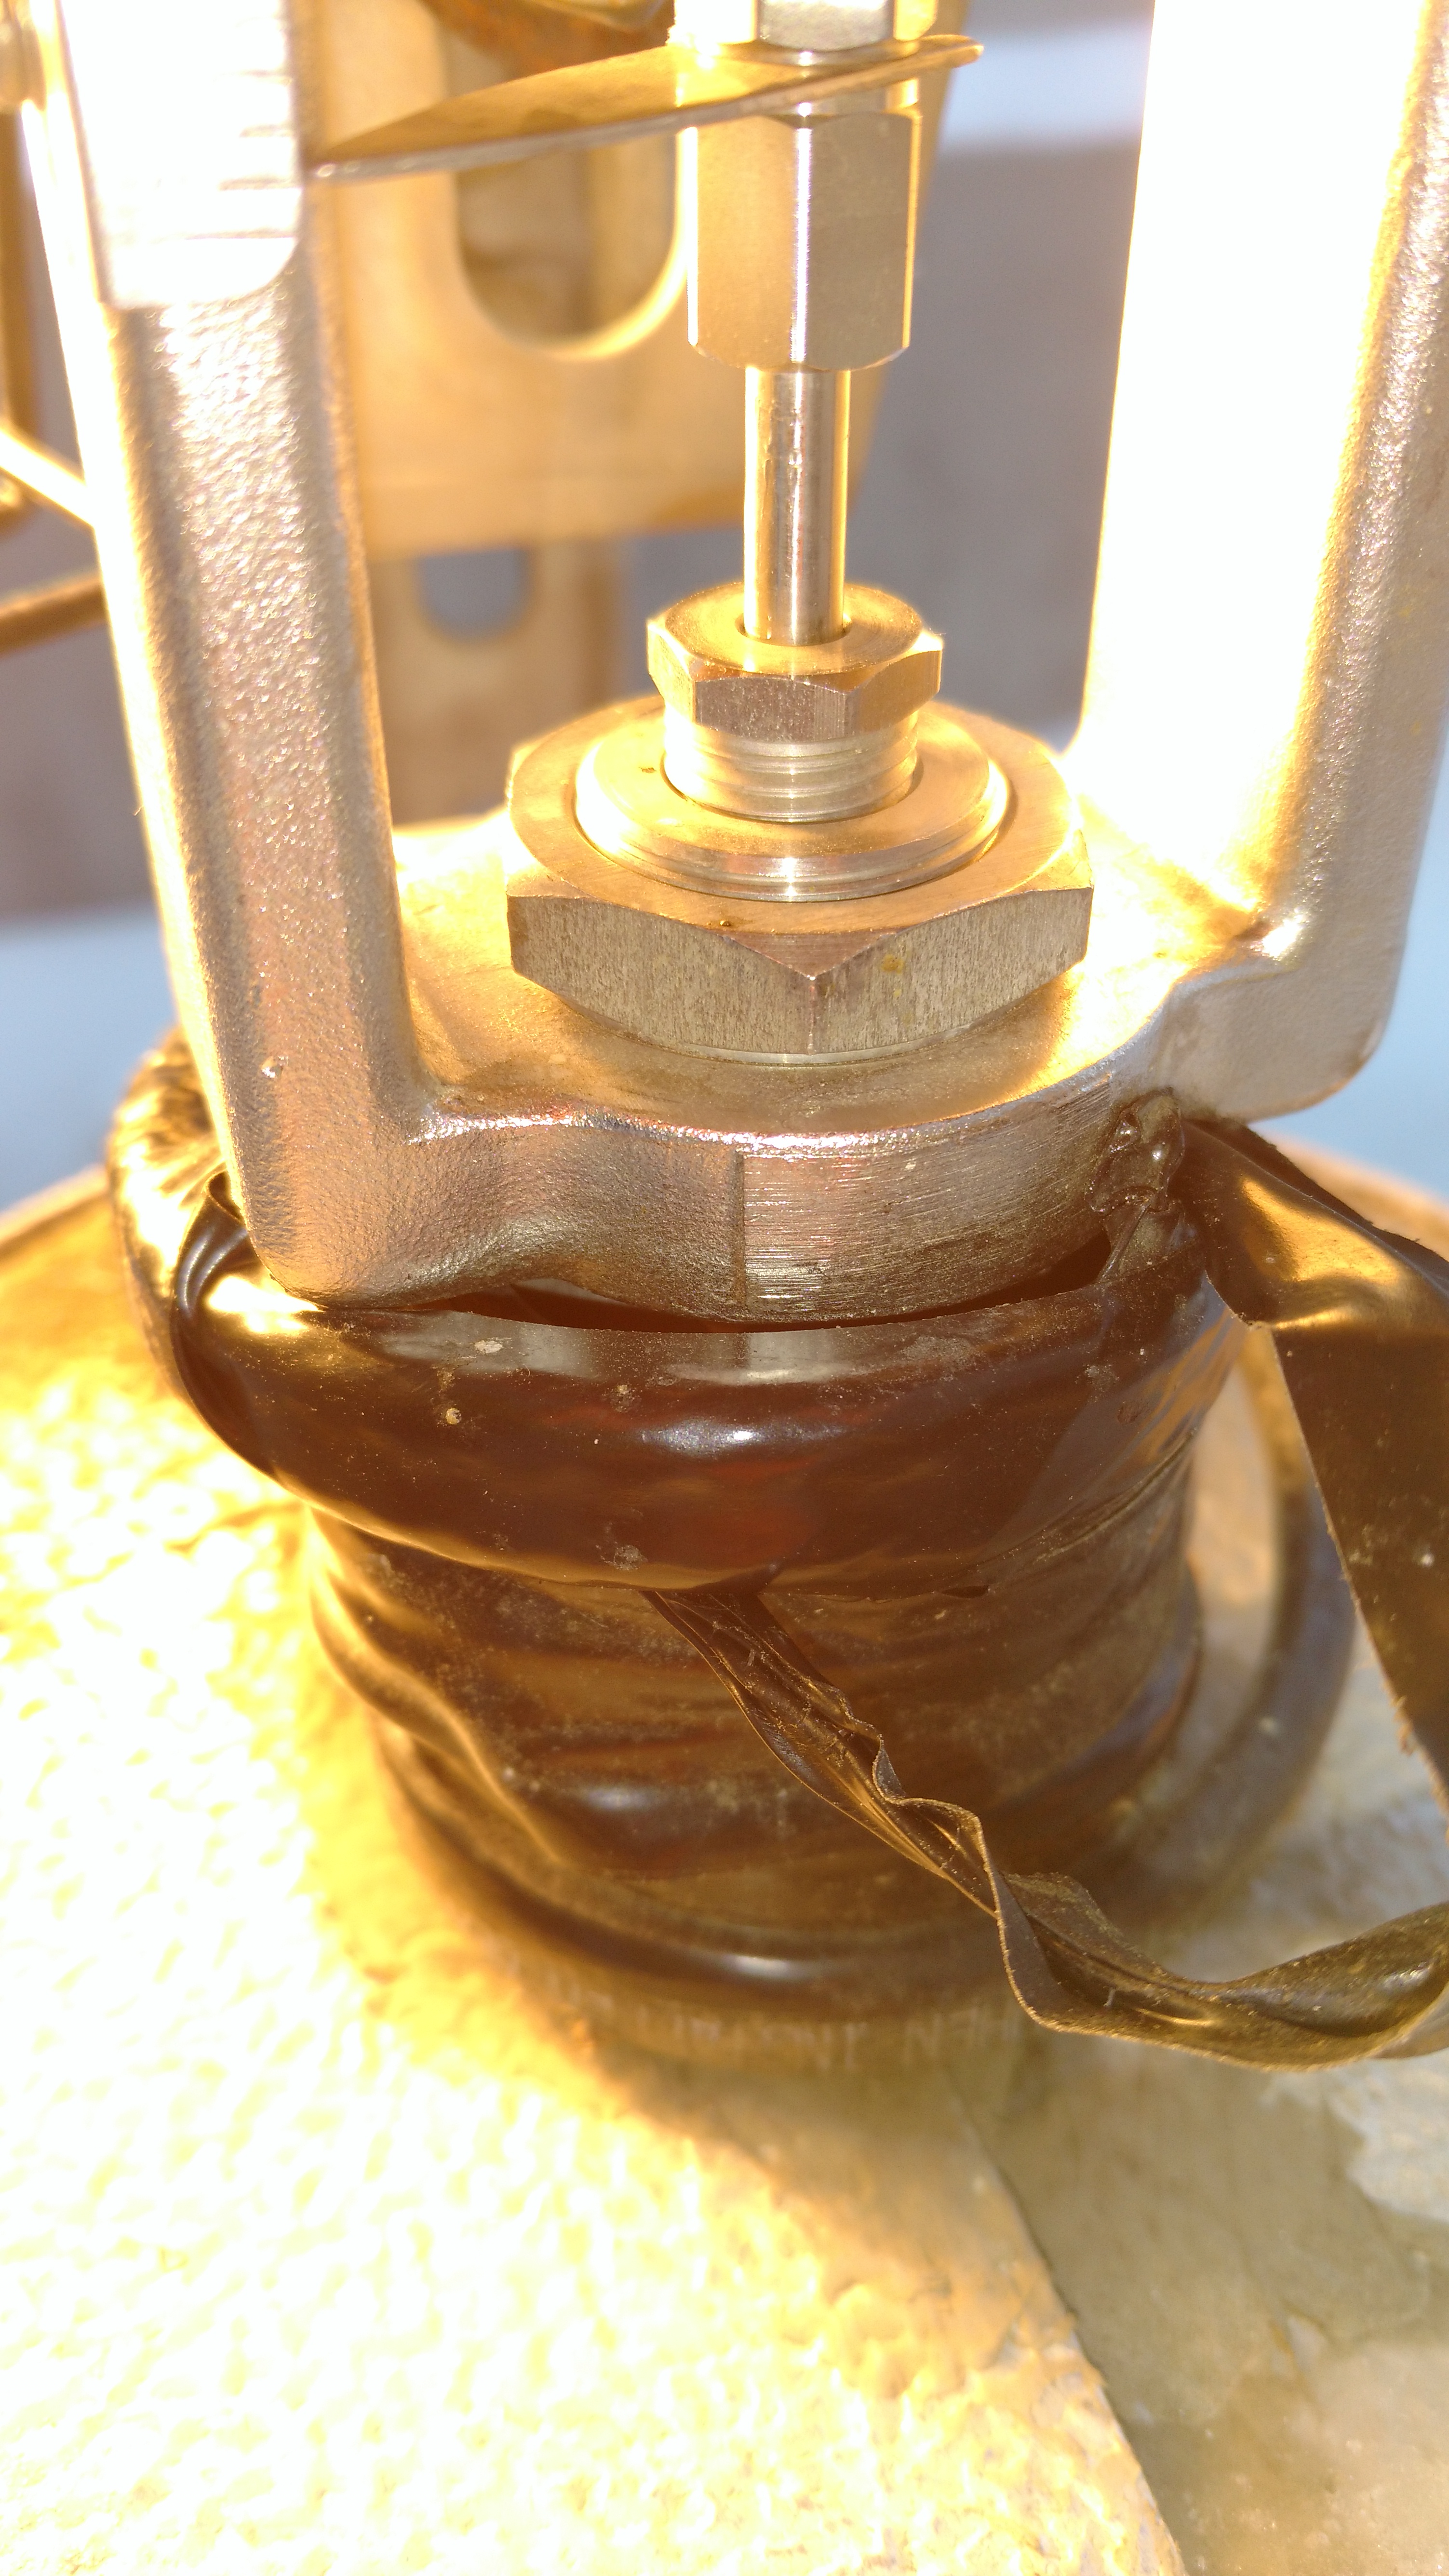
Yesterday, a water pipe behind the dishwasher in the LSB kitchen burst (see attached photo). First inkling of an issue was alluded to in Cheryl's alog about very low water pressure here in the OSB. Apparently the pipe burst yesterday afternoon at some point, and within 2hrs all the water from the Potable water tank was evacuated into the LSB. Bubba started initial clean-up work yesterday and arranged for a clean-up crew to work today (Sunday).
While H1 was locked, I took a quick run down to the LSB to look at the damage. Christina was down there & helping out the clean up along with the crew which has been on-site since early morning. Christina walked me through the areas of damage. The water travel extensively through the building---from the kitchen it went to Fred's office in one direction and into the auditorium in another direction. Baseboards have been removed rom many walls, furniture has been moved, fans are running throughout.
UPDATE: A Second Pipe Burst?
Bubba just informed me a possible 2nd pipe may have burst. The Hanford Fire Dept are onsite to investigate with Bubba.
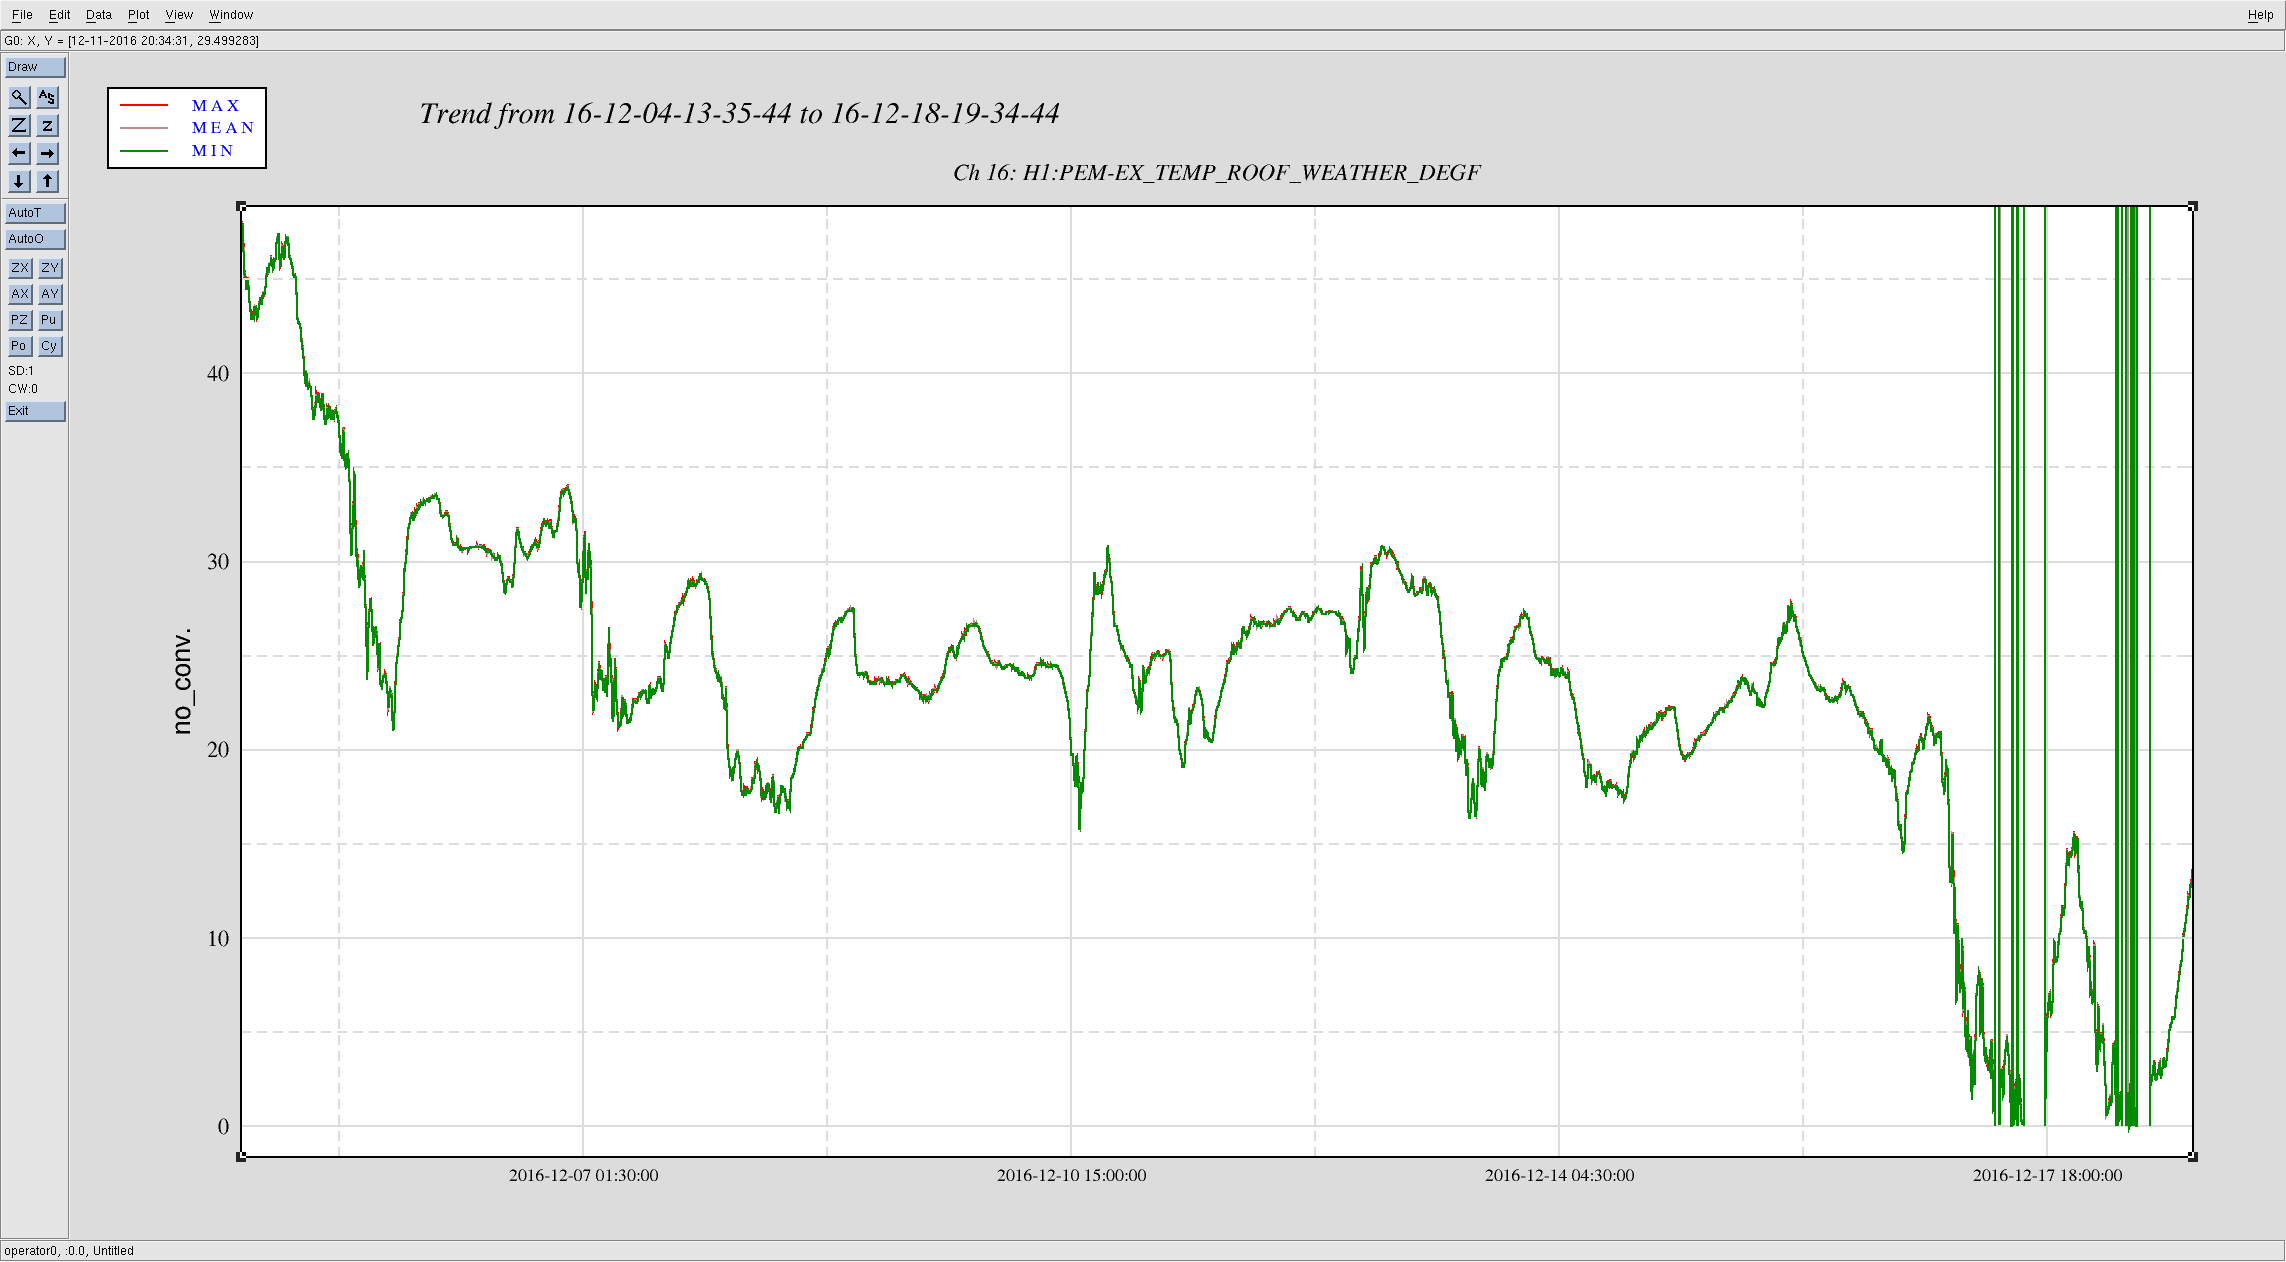
Arctic Temperatures!
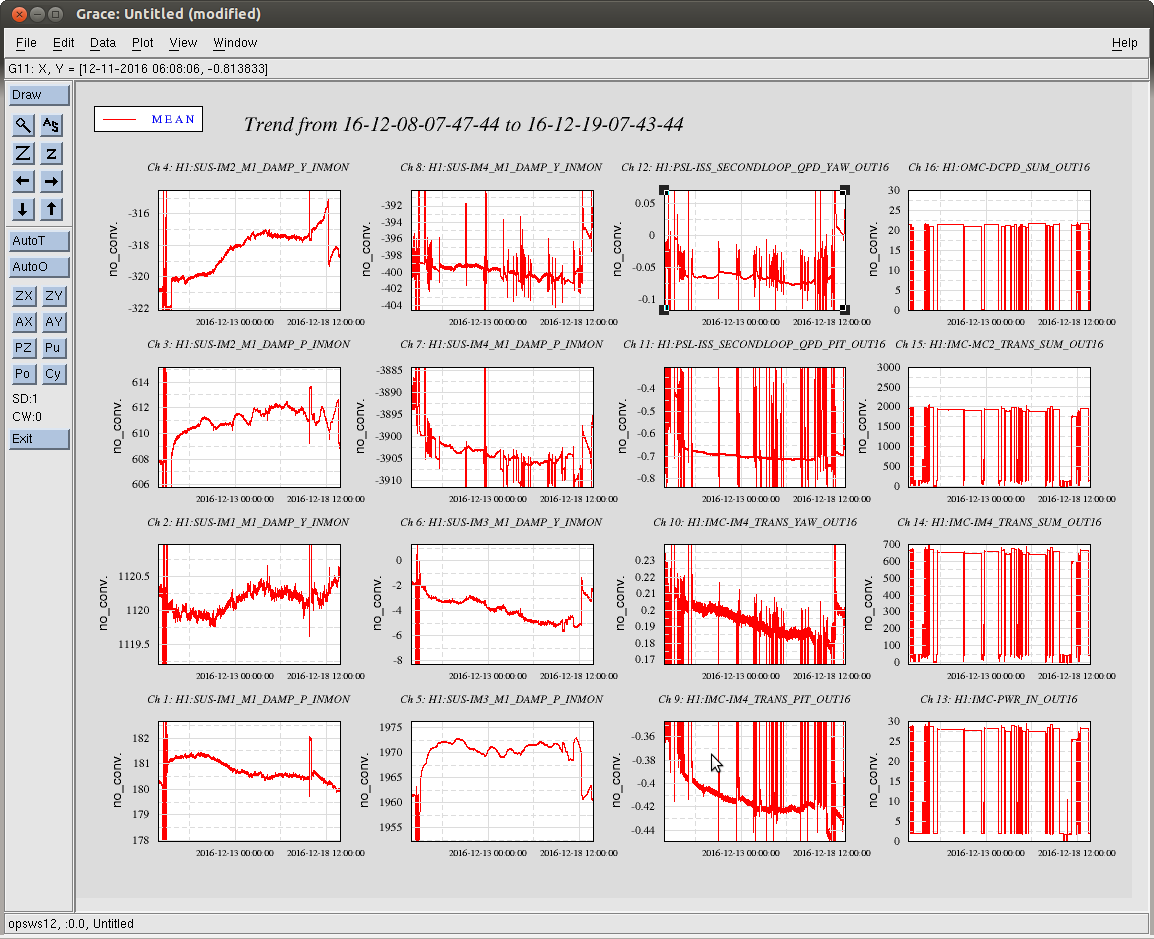
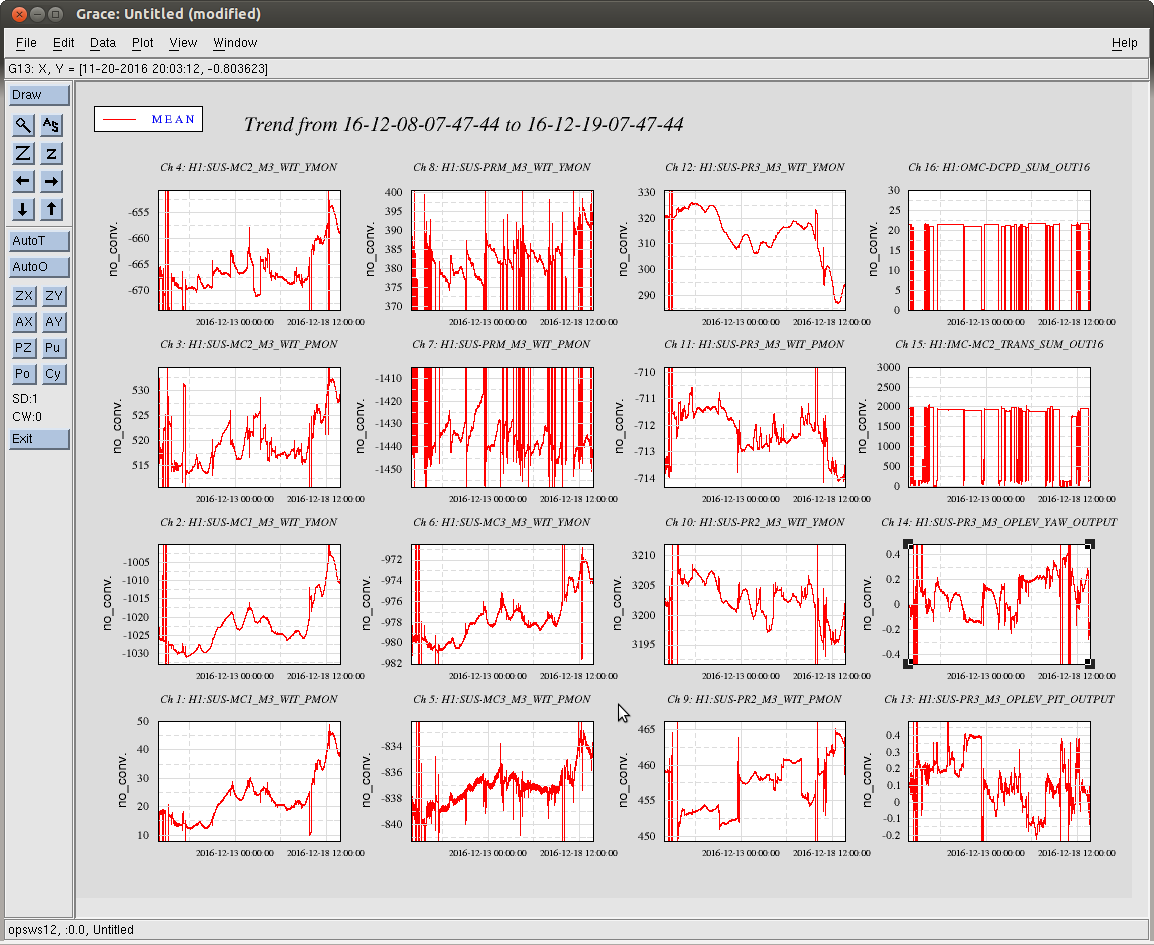
We have had sub-freezing temperatures for the last 11 days (since 12/7), and the last 2 days have we have not made it above 15degF(see attached). Temperatures are due to warm up by Tues as we finally get above freezing.
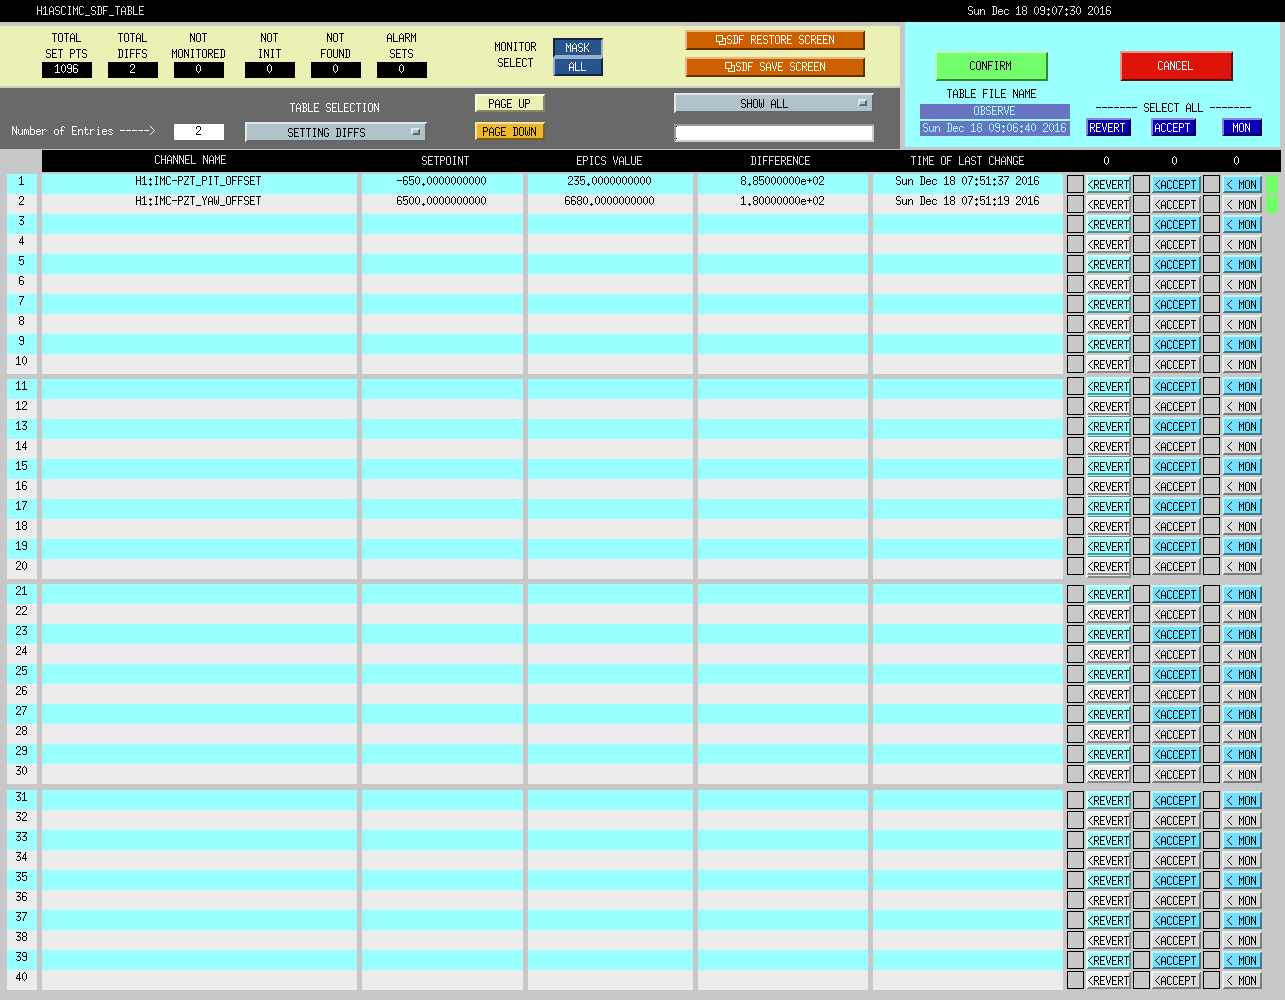

Also bit 4