TITLE: 12/12 Day Shift: 16:00-00:00 UTC (08:00-04:00 PST), all times posted in UTC
STATE of H1: Corrective Maintenance
INCOMING OPERATOR: Patrick
SHIFT SUMMARY:
IFO locked upon my arrival and an EQ in California caused lockloss. The seismic activity rang down quickly and we were re-locked within the hour. The cause of the next lockloss was undetermined but the CPS on HAM5 was going a bit crazy and was under investigation when I left due to a Hanford Early Release Advisory for the incoming weather because my car is improperly equipped for the amount of snow that we've gotten and is expected today. I'm currently working to solve this issue. Patrick is the evening operator and is on site as are other operators.
LOG:
16:29 Fil , J. Batch ad John Worden out to LDAS.
16:42 Jim. Johm and Fil back from LDAS. Electrical panels are tripped. Electrician is on his way to investigate. Still not sure what order things went down.
16:46 Lockloss EQ
16:50 Switched ISI config for Large EQ in Northern California.
17:04 Switch ISI config back to Windy after quick decay of EQ
17:20 GRB alert. H1 not locked
17:34 H1 locked and observing. Monitoring f1 violin modes which are slightly rung up.
19:14 Fil reports that the LDAS power panel trips were due to the room, first, overheating. Queries into remote monitoring of LDAS room temps are being made.
19:17 filed FRS ticket for noisy ops station computer fan.
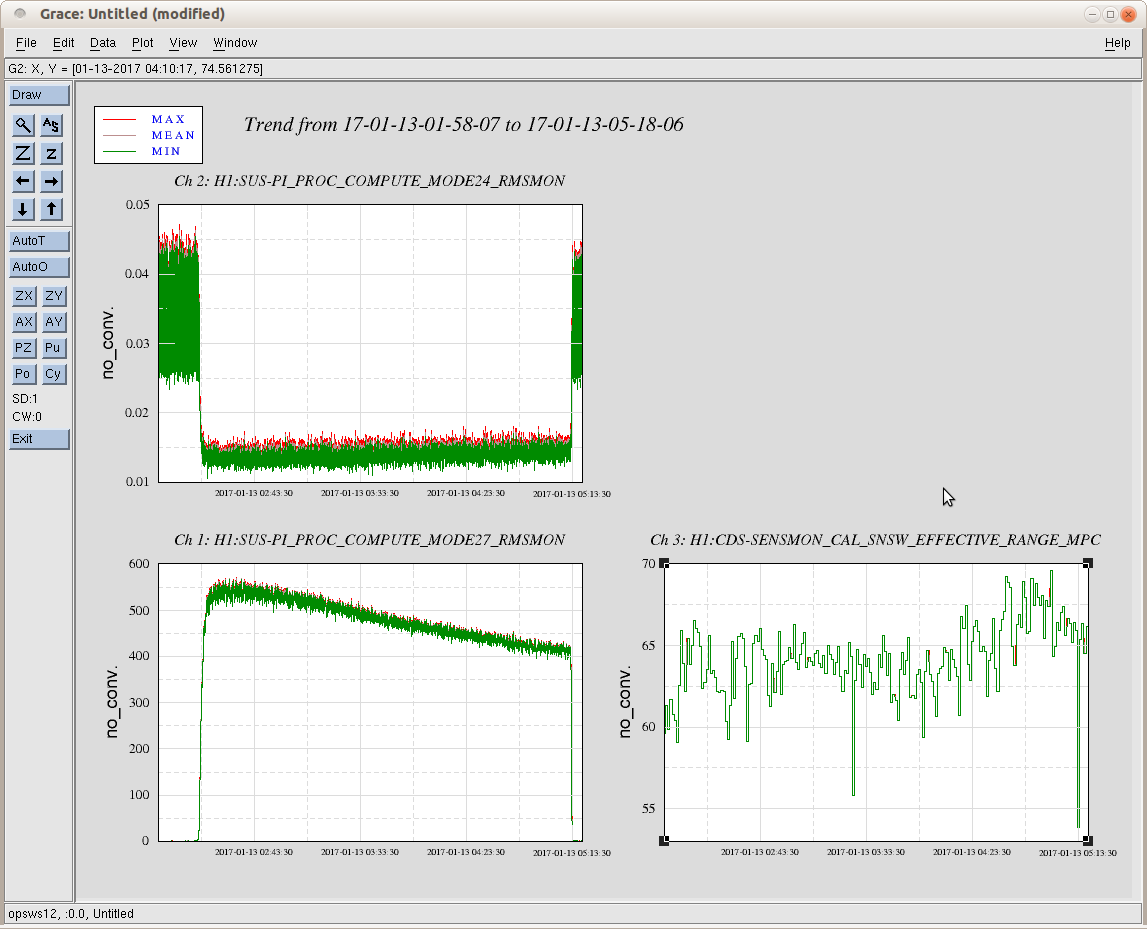
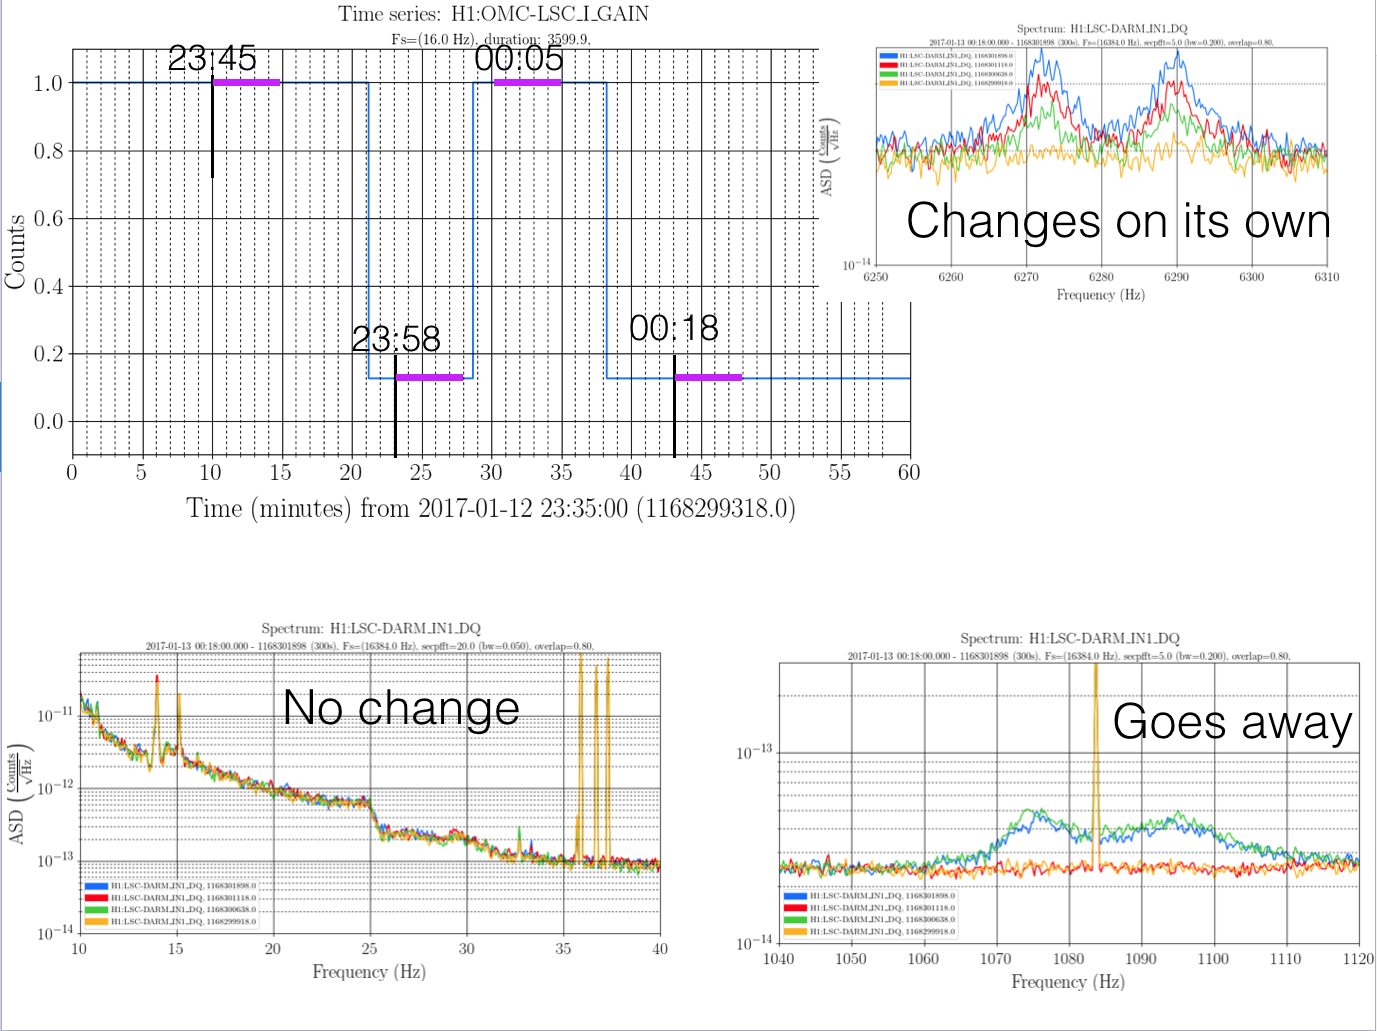
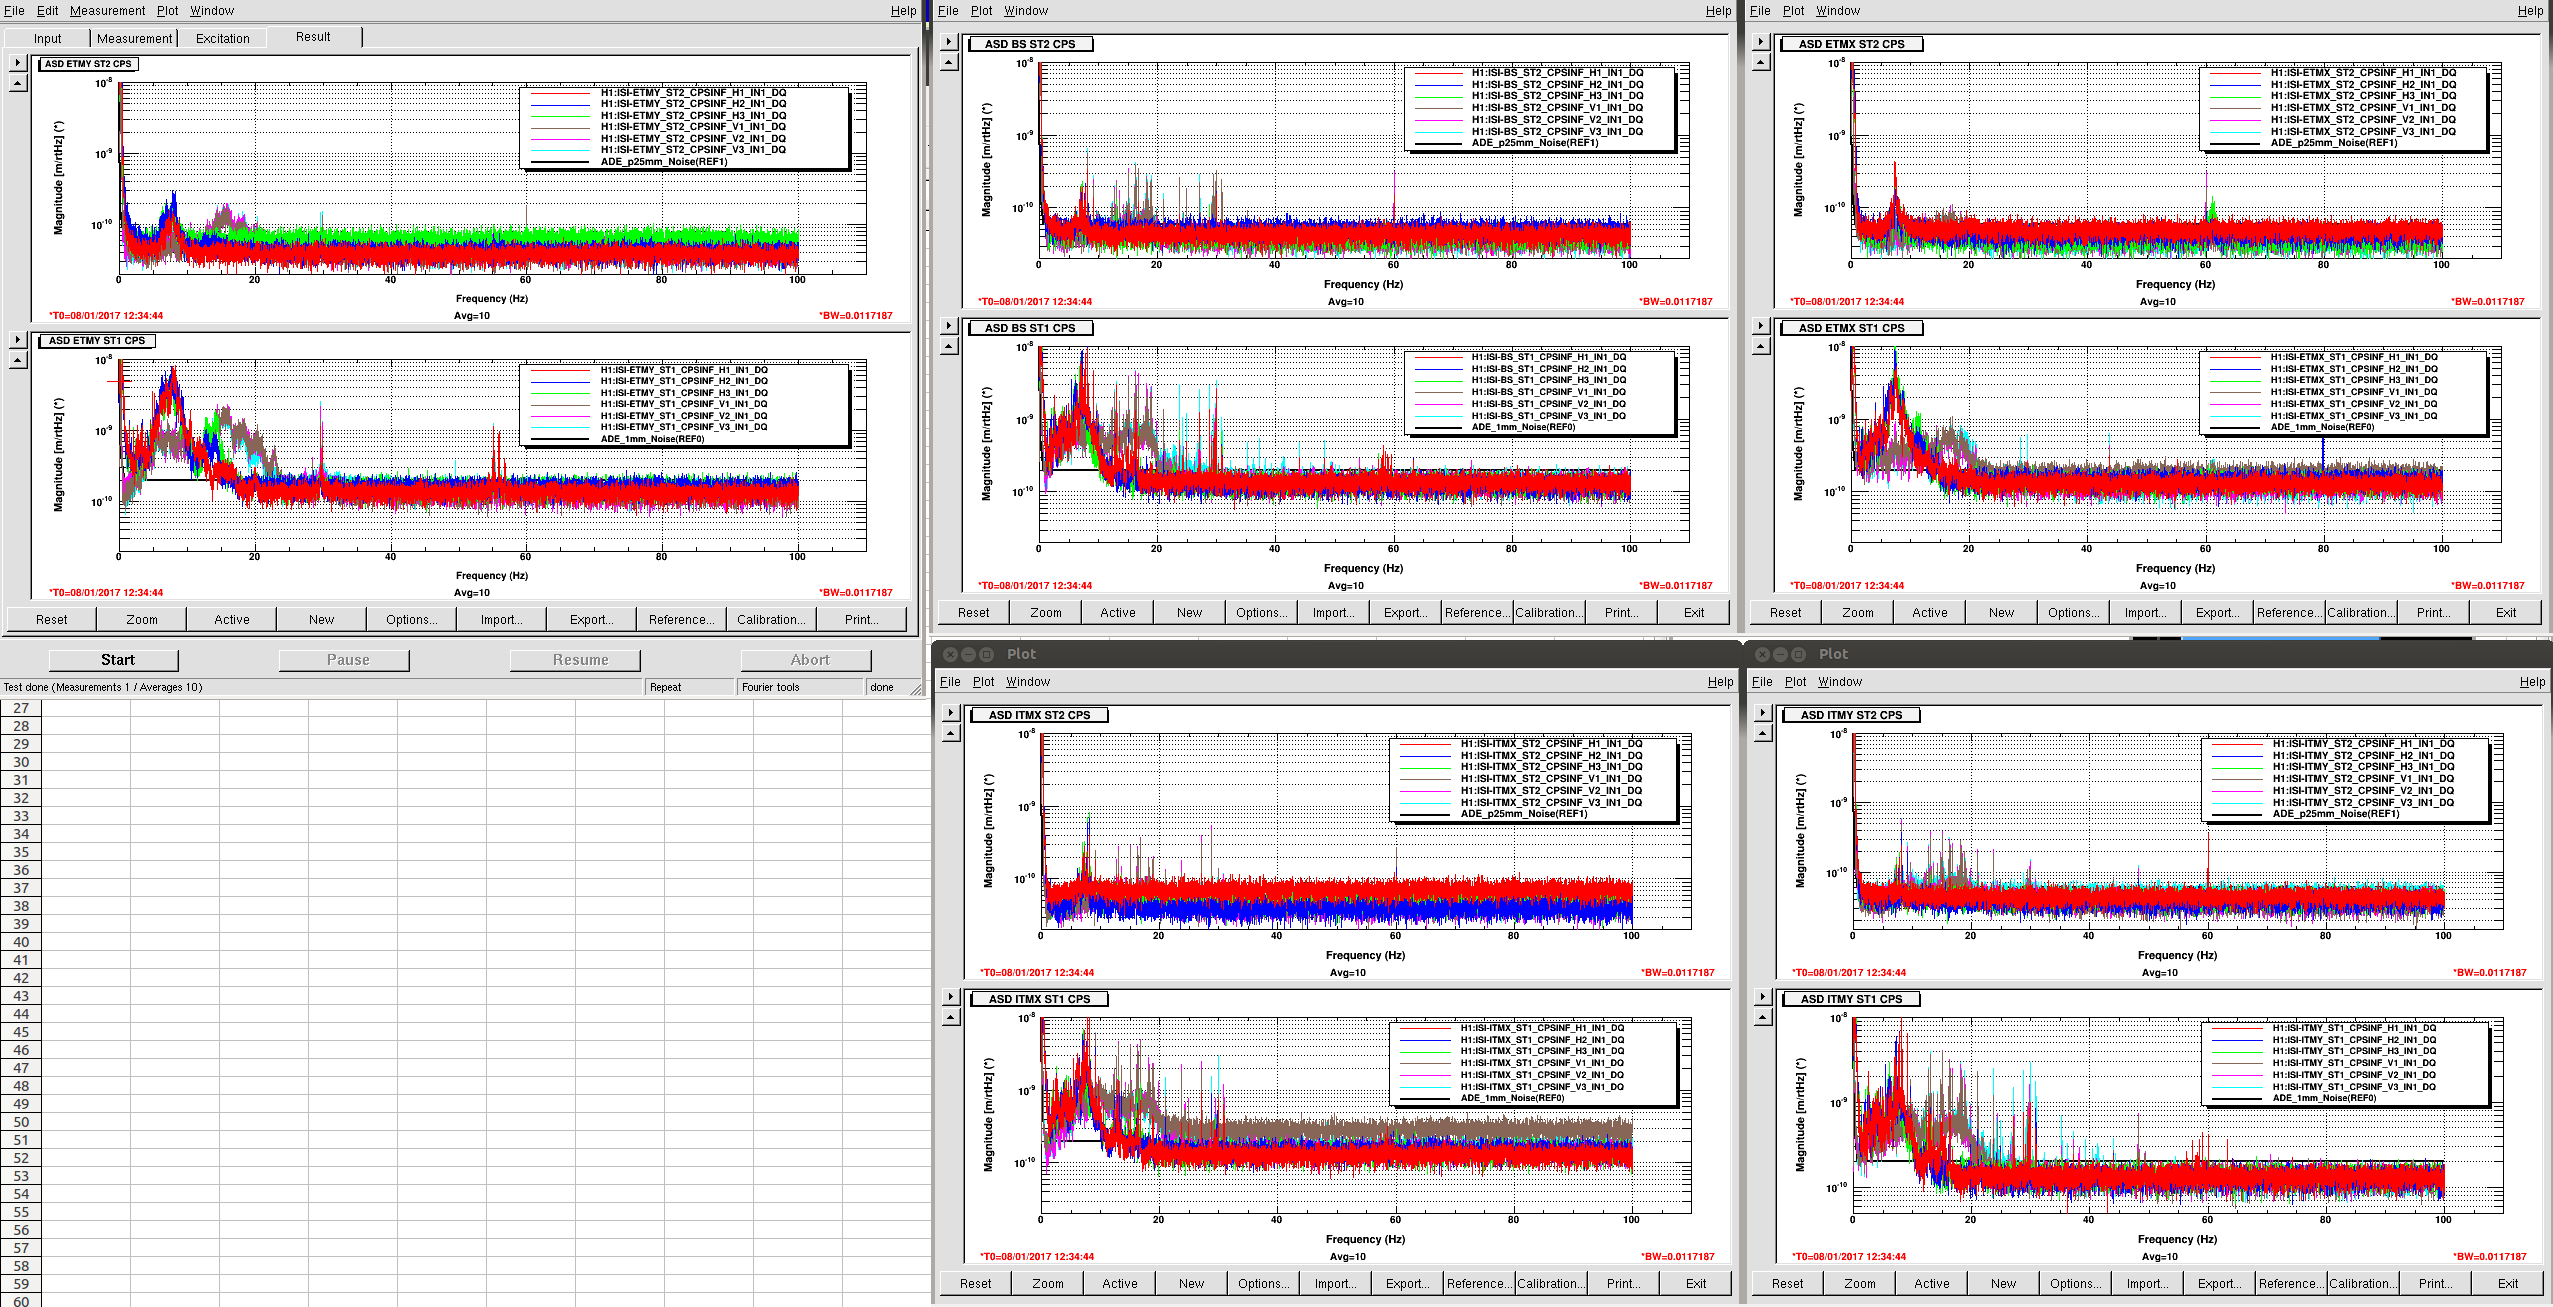
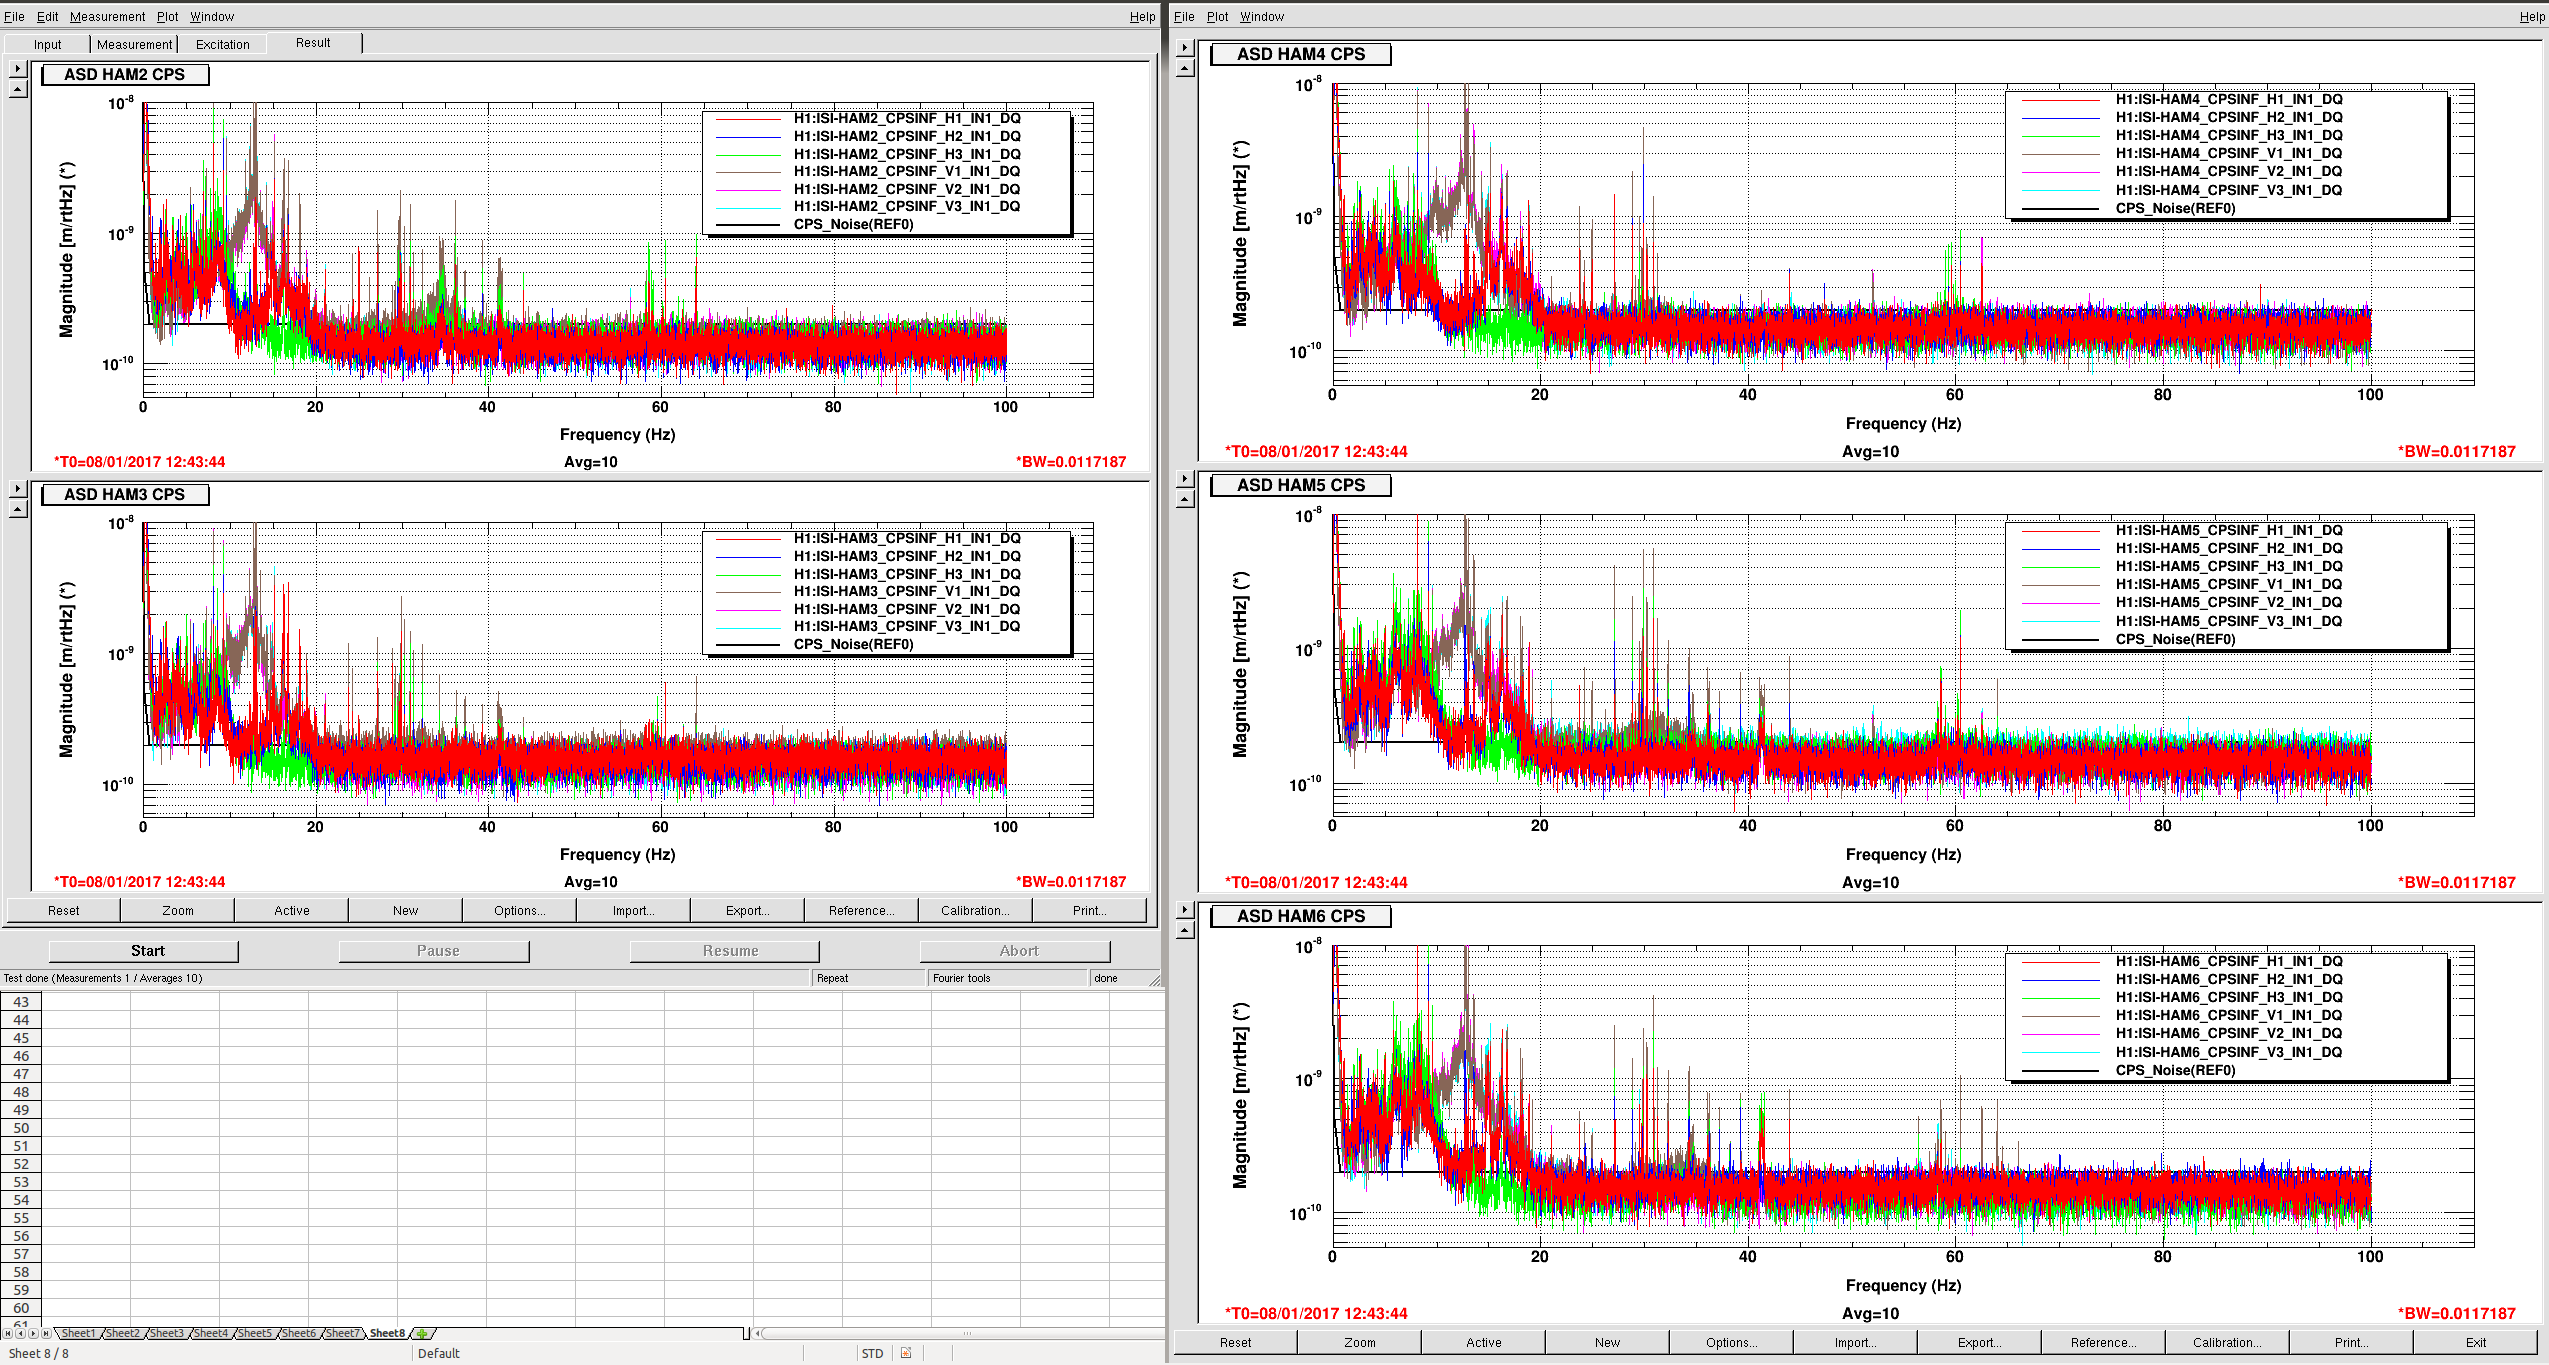
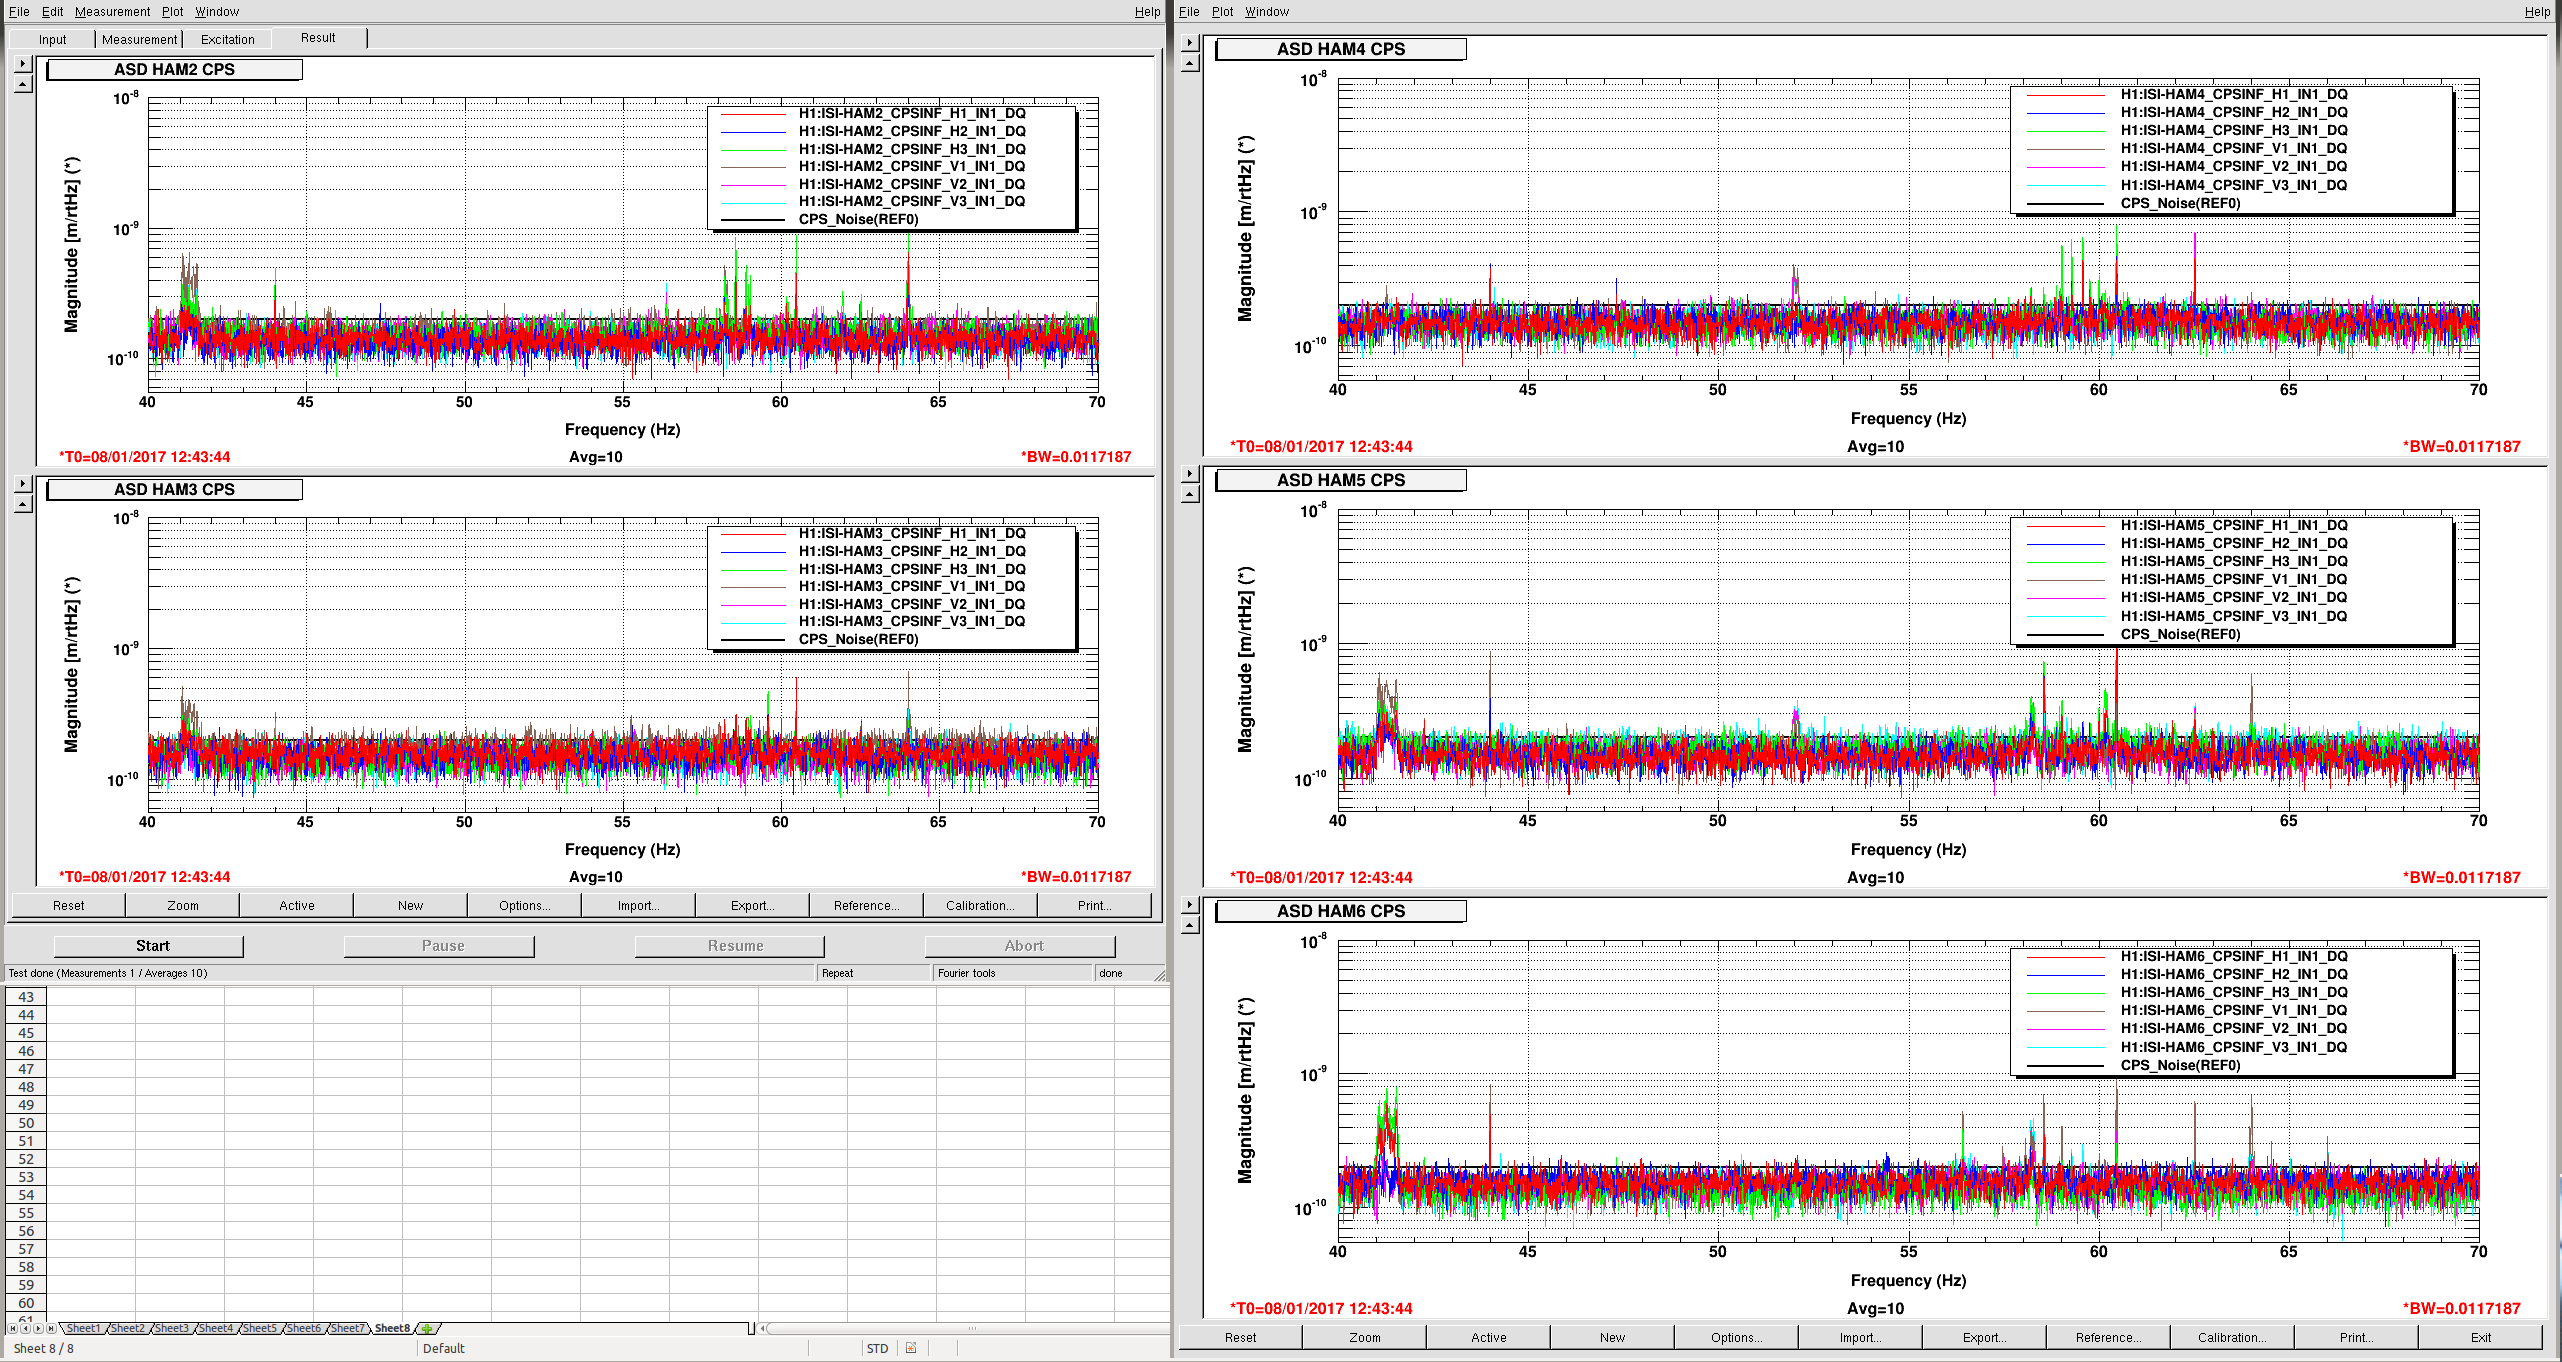
20:12 lockloss HAM5 and 6 ISI tripped
20:20 HAM5 CPS glitching. Jim out to power cycle chassis in CER.
20:34 Jim and Fil out to LVEA to physically "exercise" CPS connections.
21:30 Recieved Hanford Release advisory. Decided that I should get my non-snow ready vehicle home. TJ is there as well as Patrick who is the evening shift operator.
