beverly.berger@LIGO.ORG - posted 14:39, Thursday 12 January 2017 (33185)
DQ Shift: Monday 9 Jan 2017 00:00 UTC - Wednesday 11 Jan 2017 23:59 UTC
DQ Shifter: Beverly
LHO: Fellows: Young-Min, Evan
Full results may be found here.
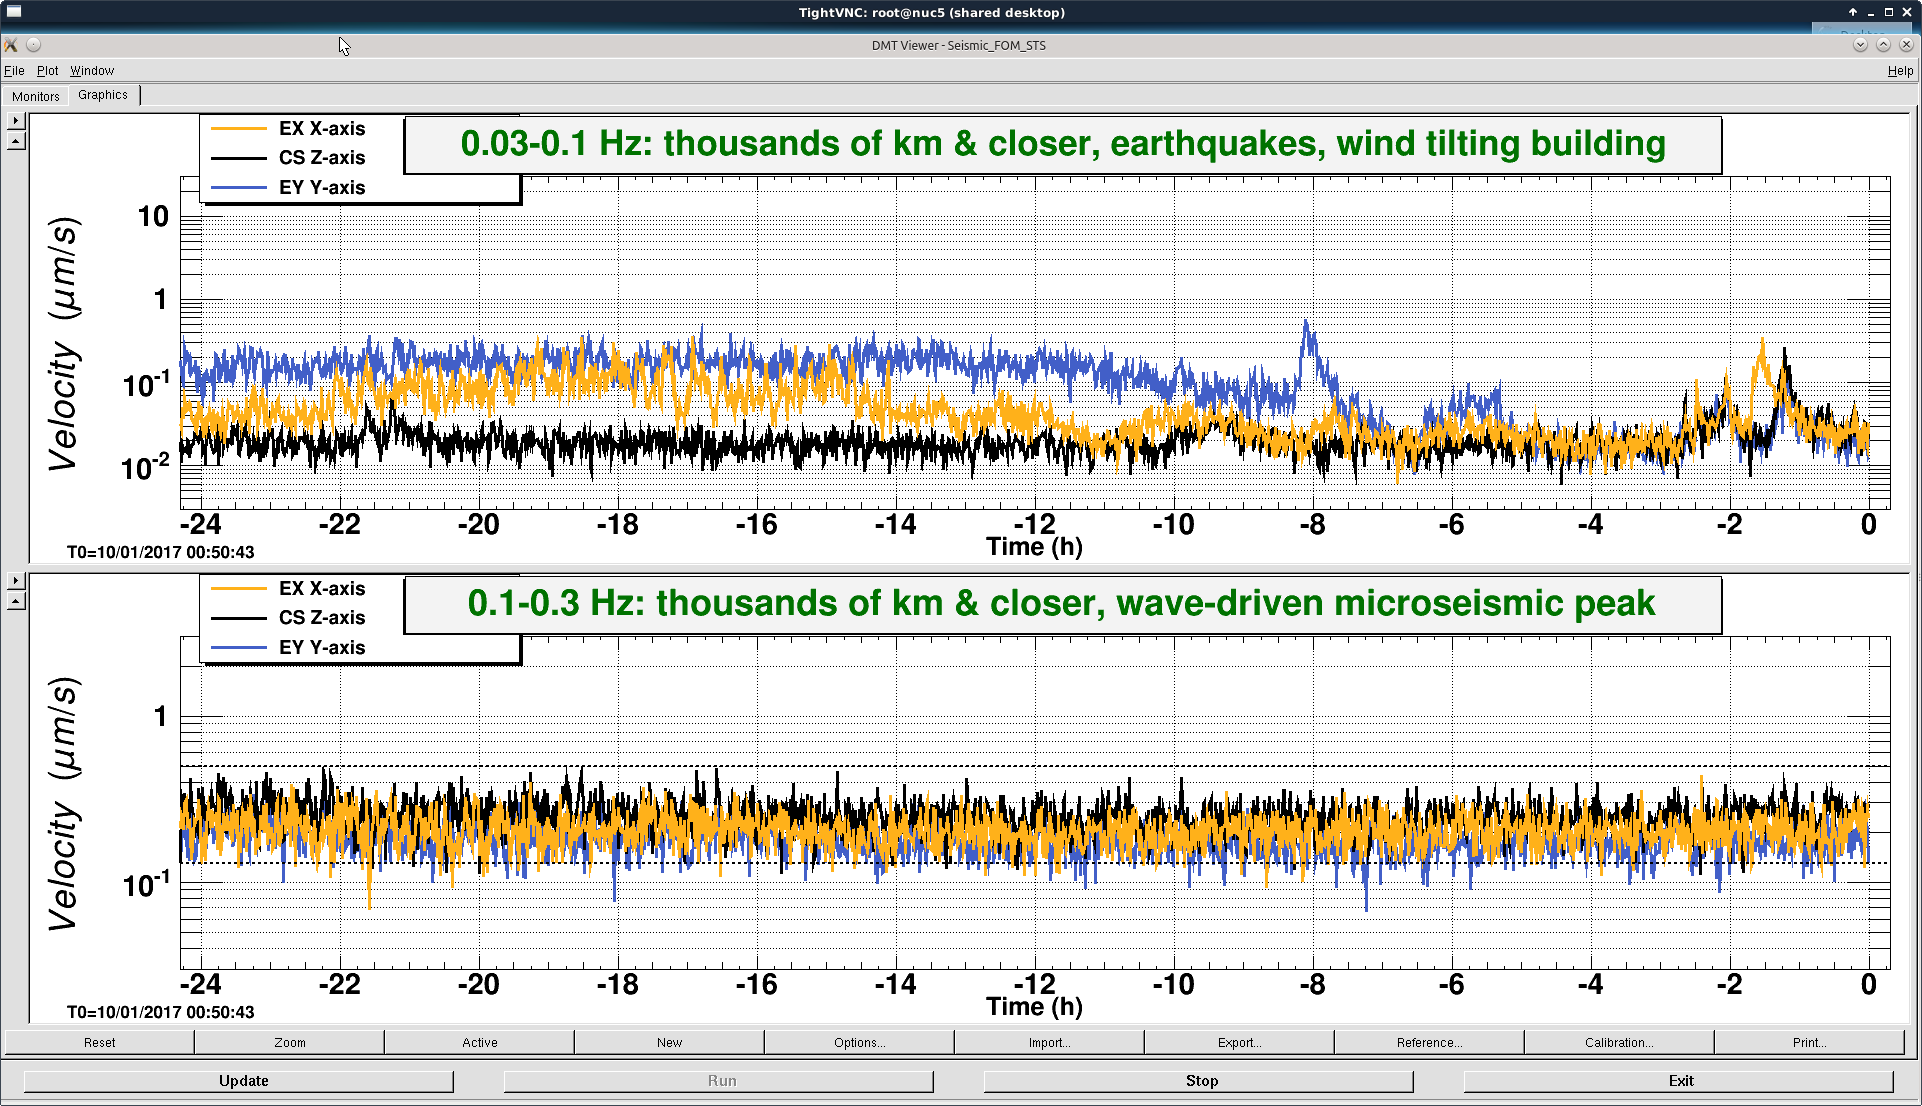
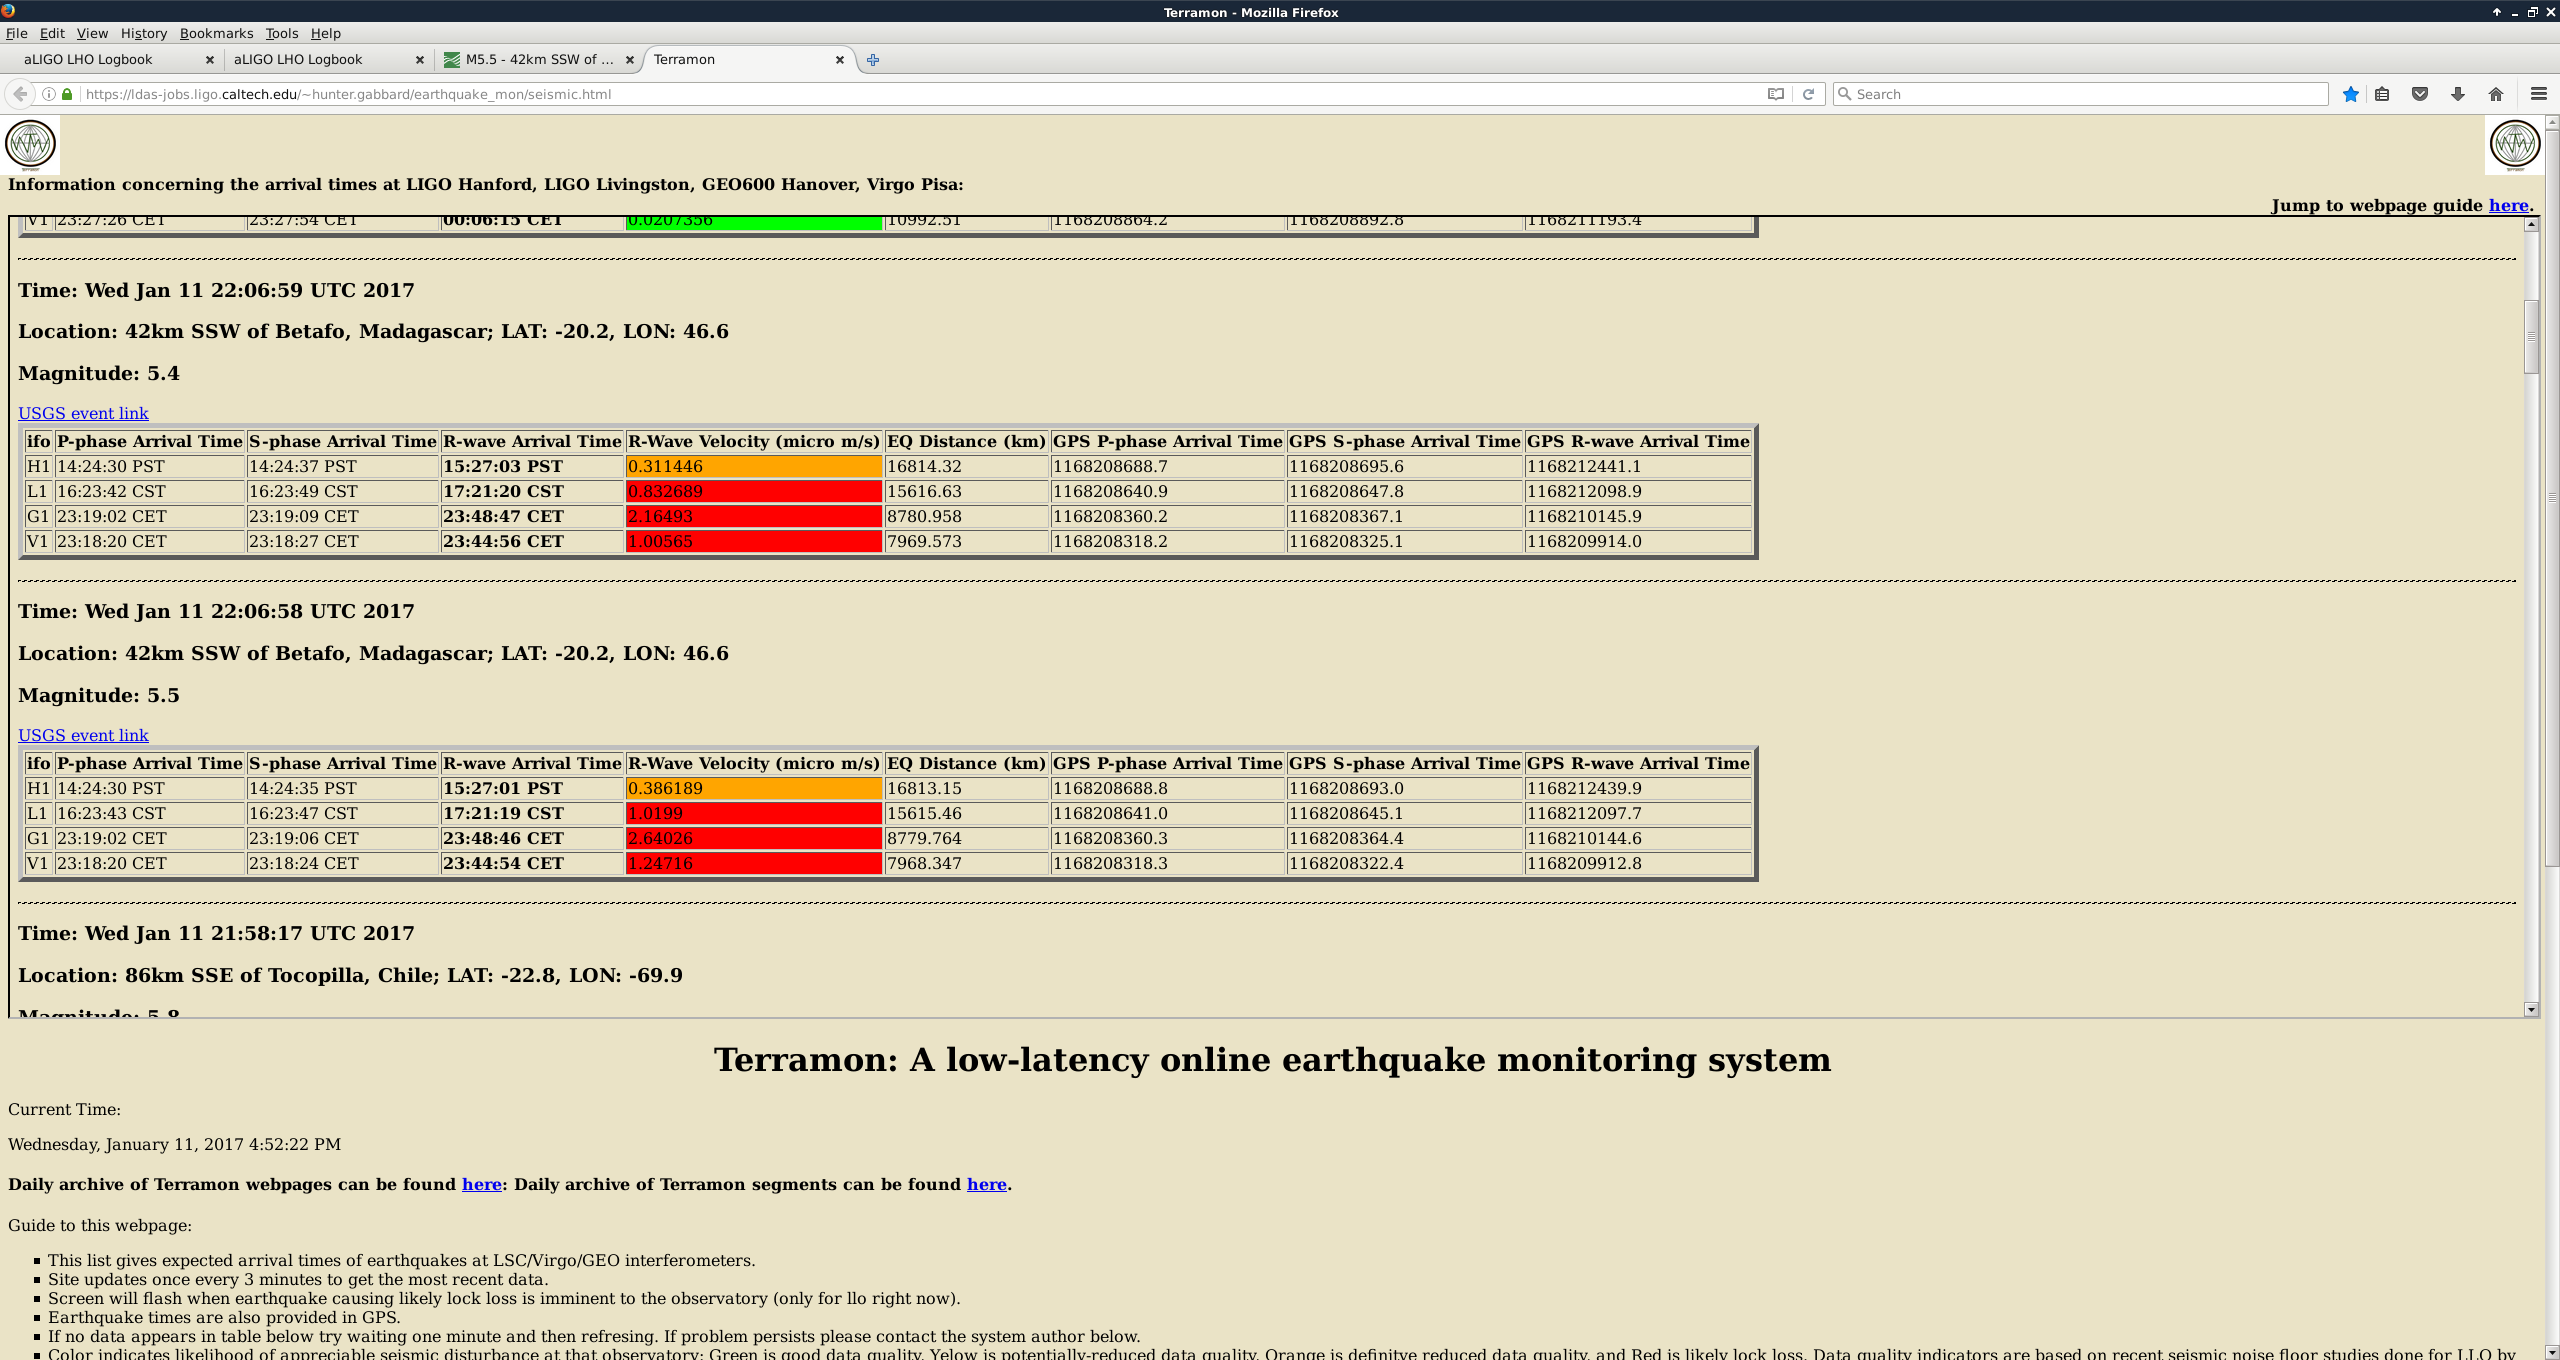
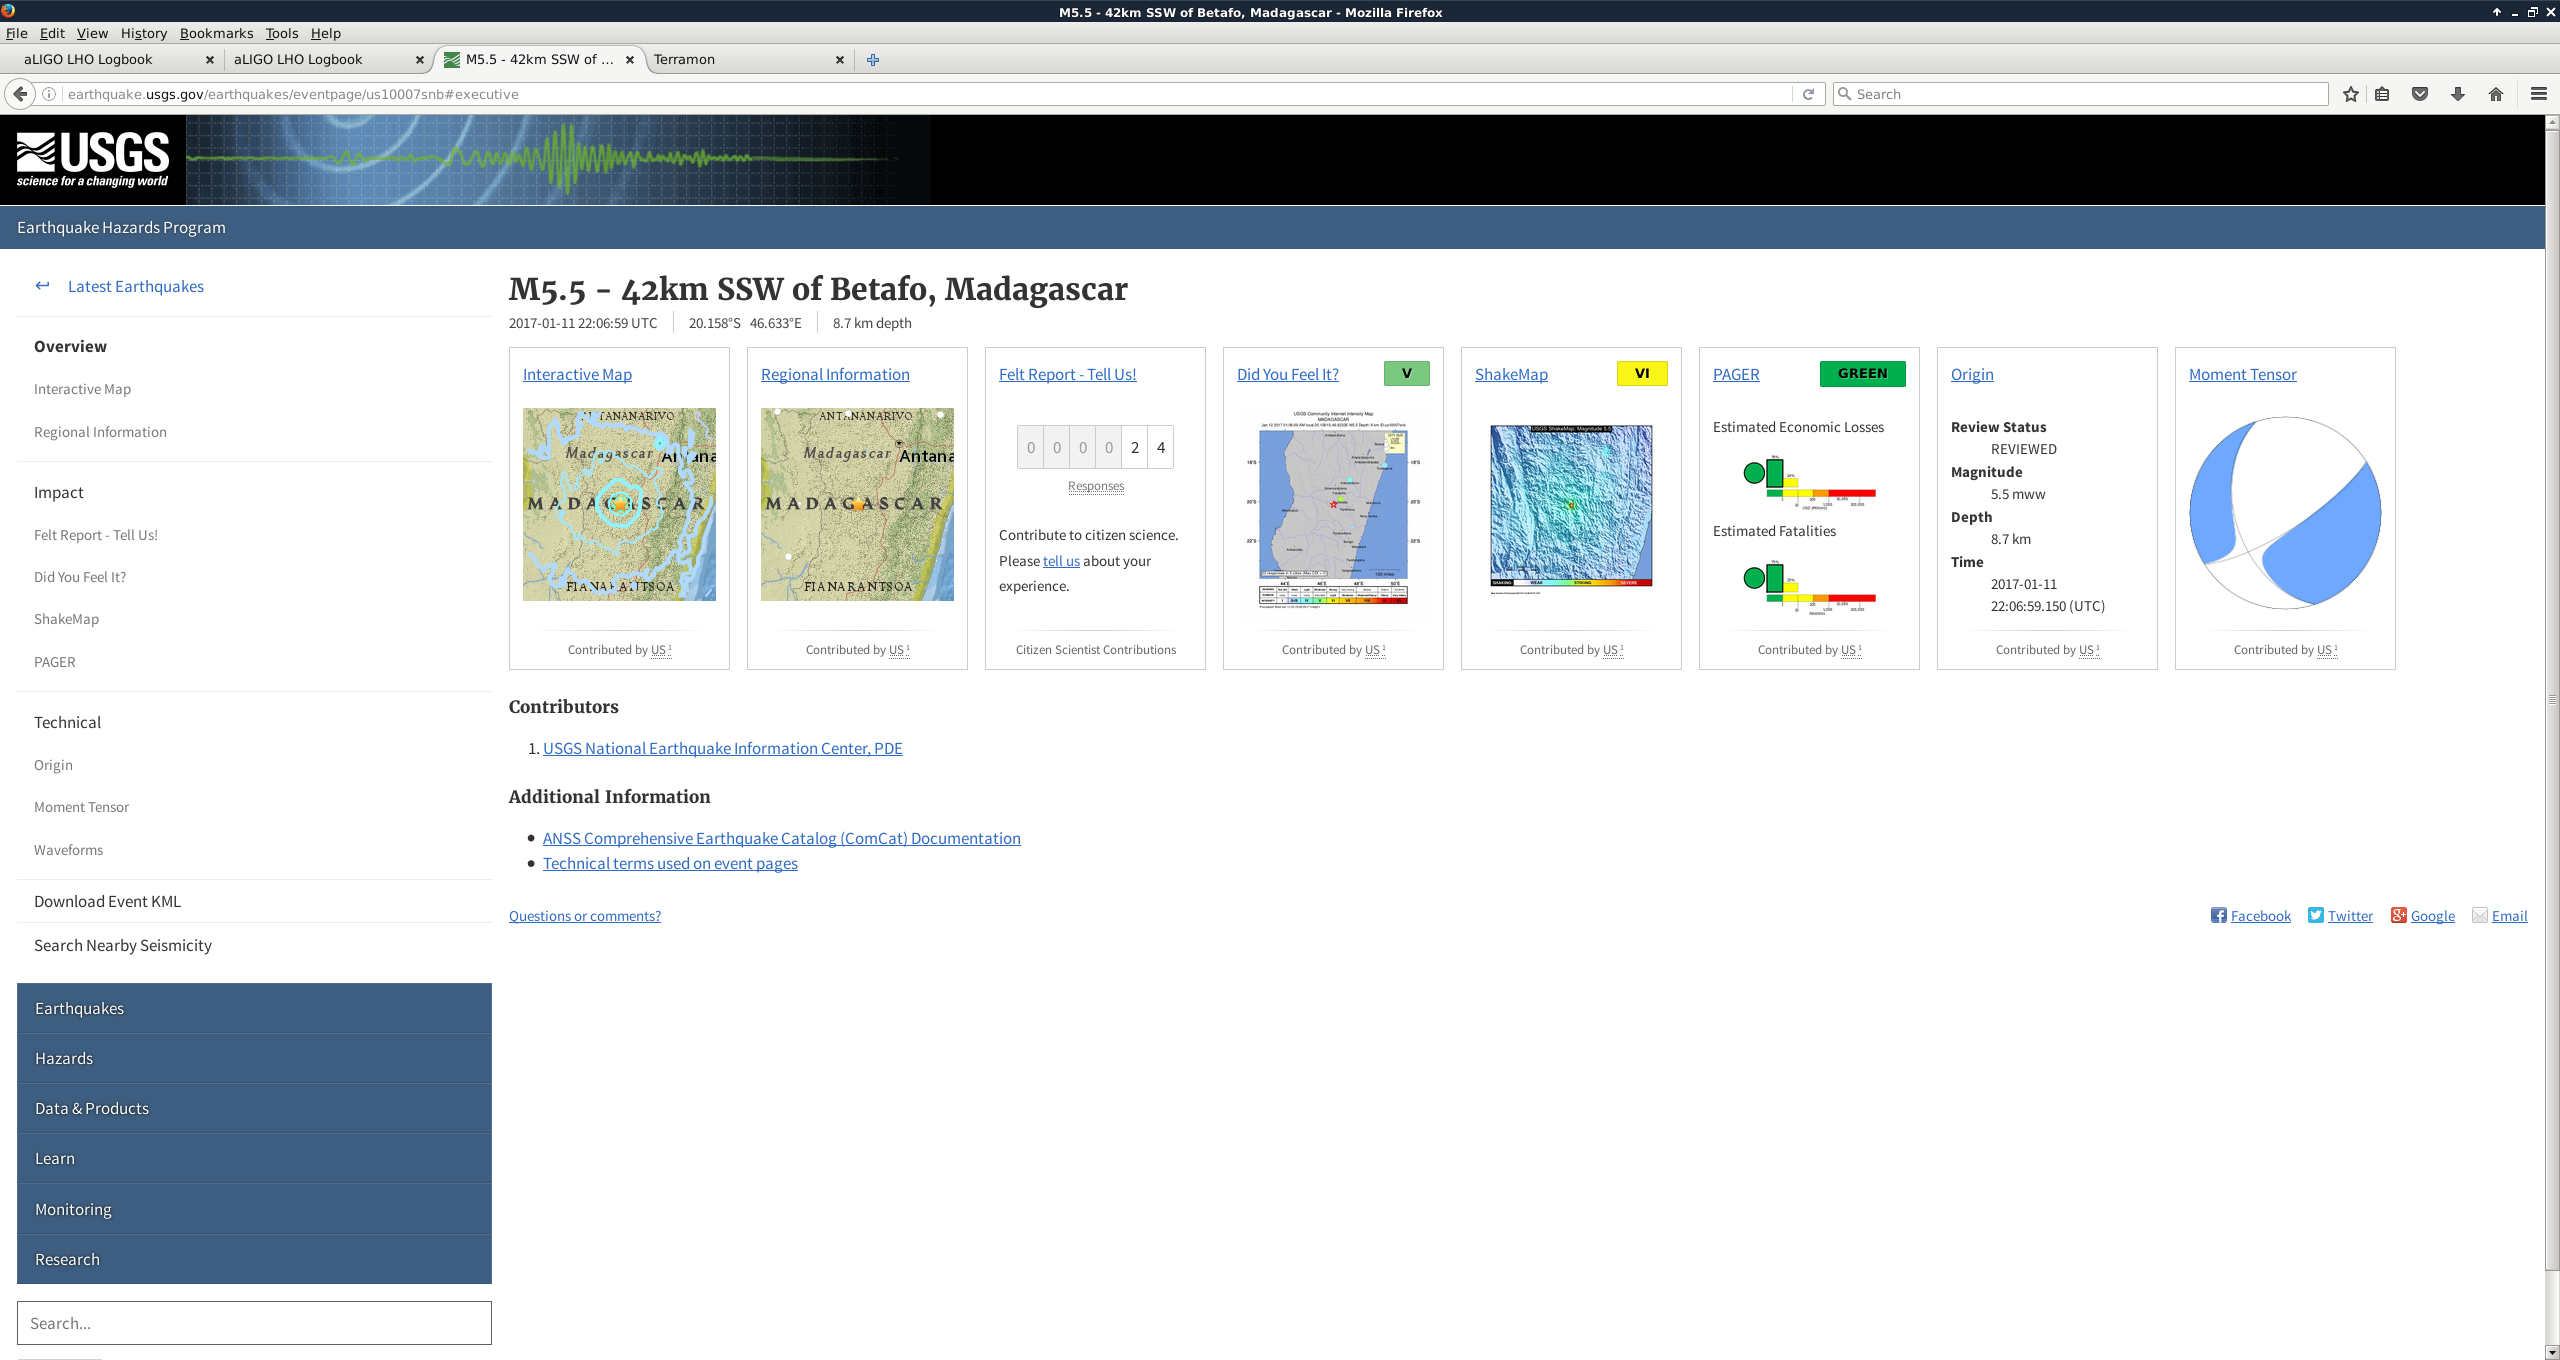
- The duty cycle was rather low (8.4% on Monday, 55.2% on Tuesday, 39.5% on Wednesday for a combined duty cycle of 34.4% ). Ongoing snow and ice made it dangerous for staff to drive so operators were absent for several shifts. In addition, two strong earthquakes ended locks on 10 Jan.
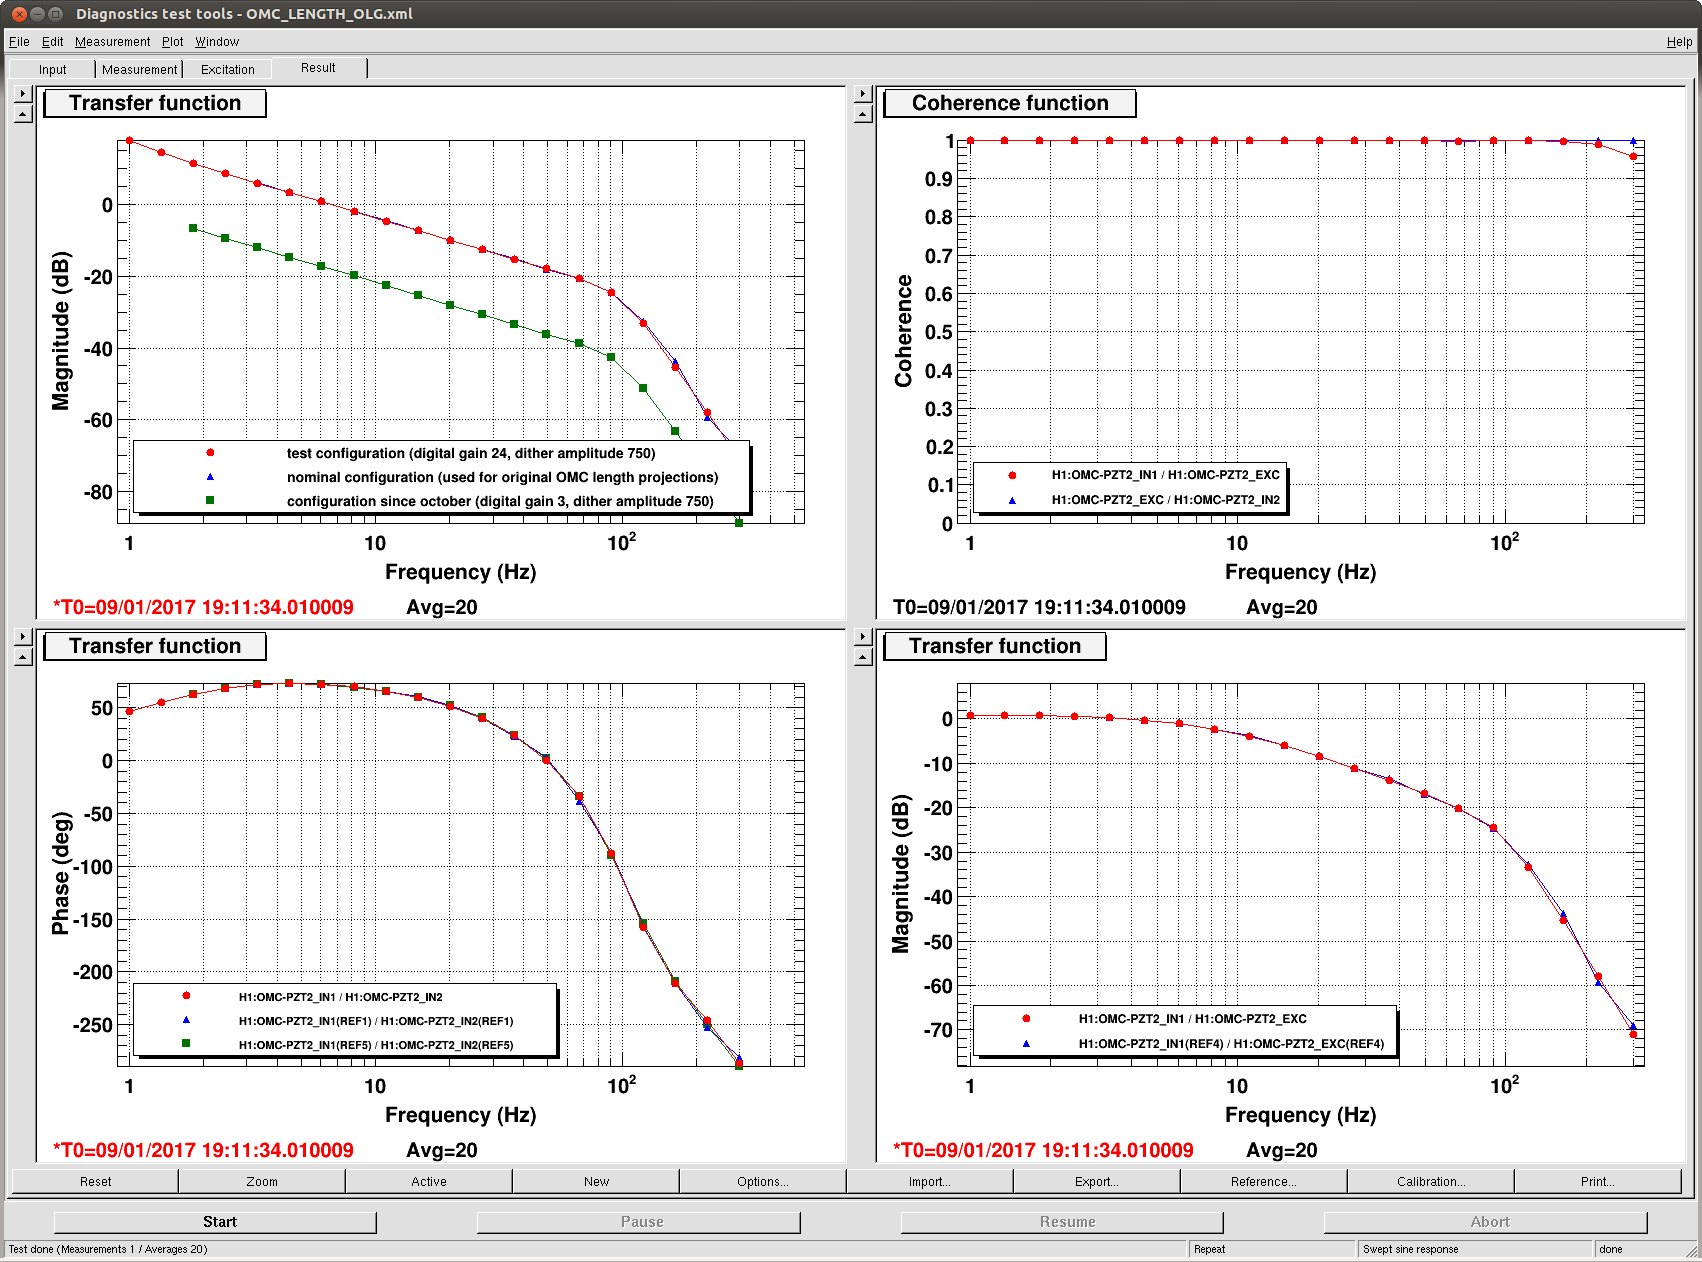
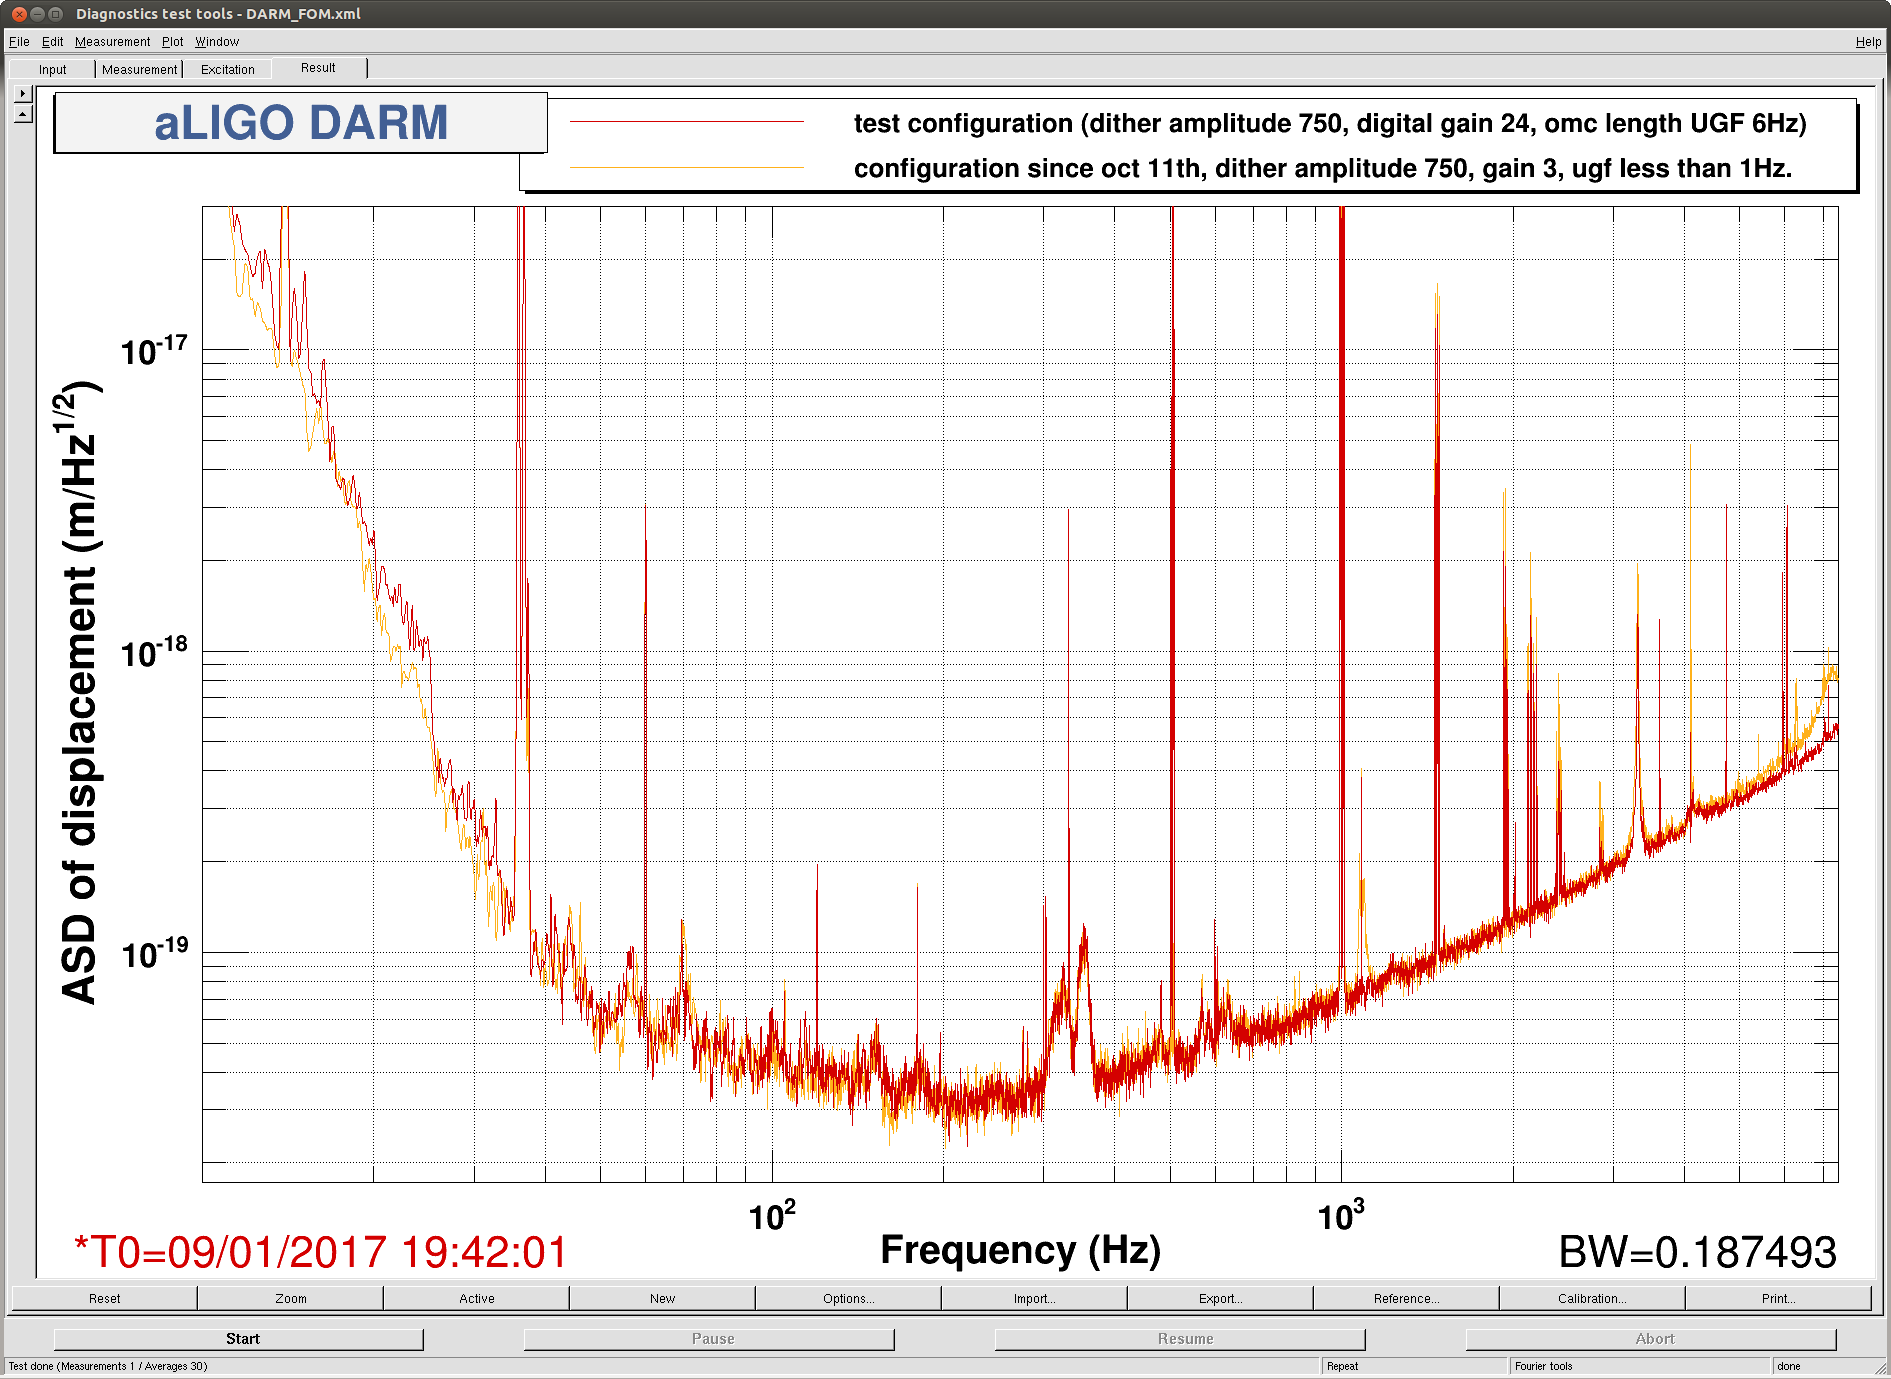
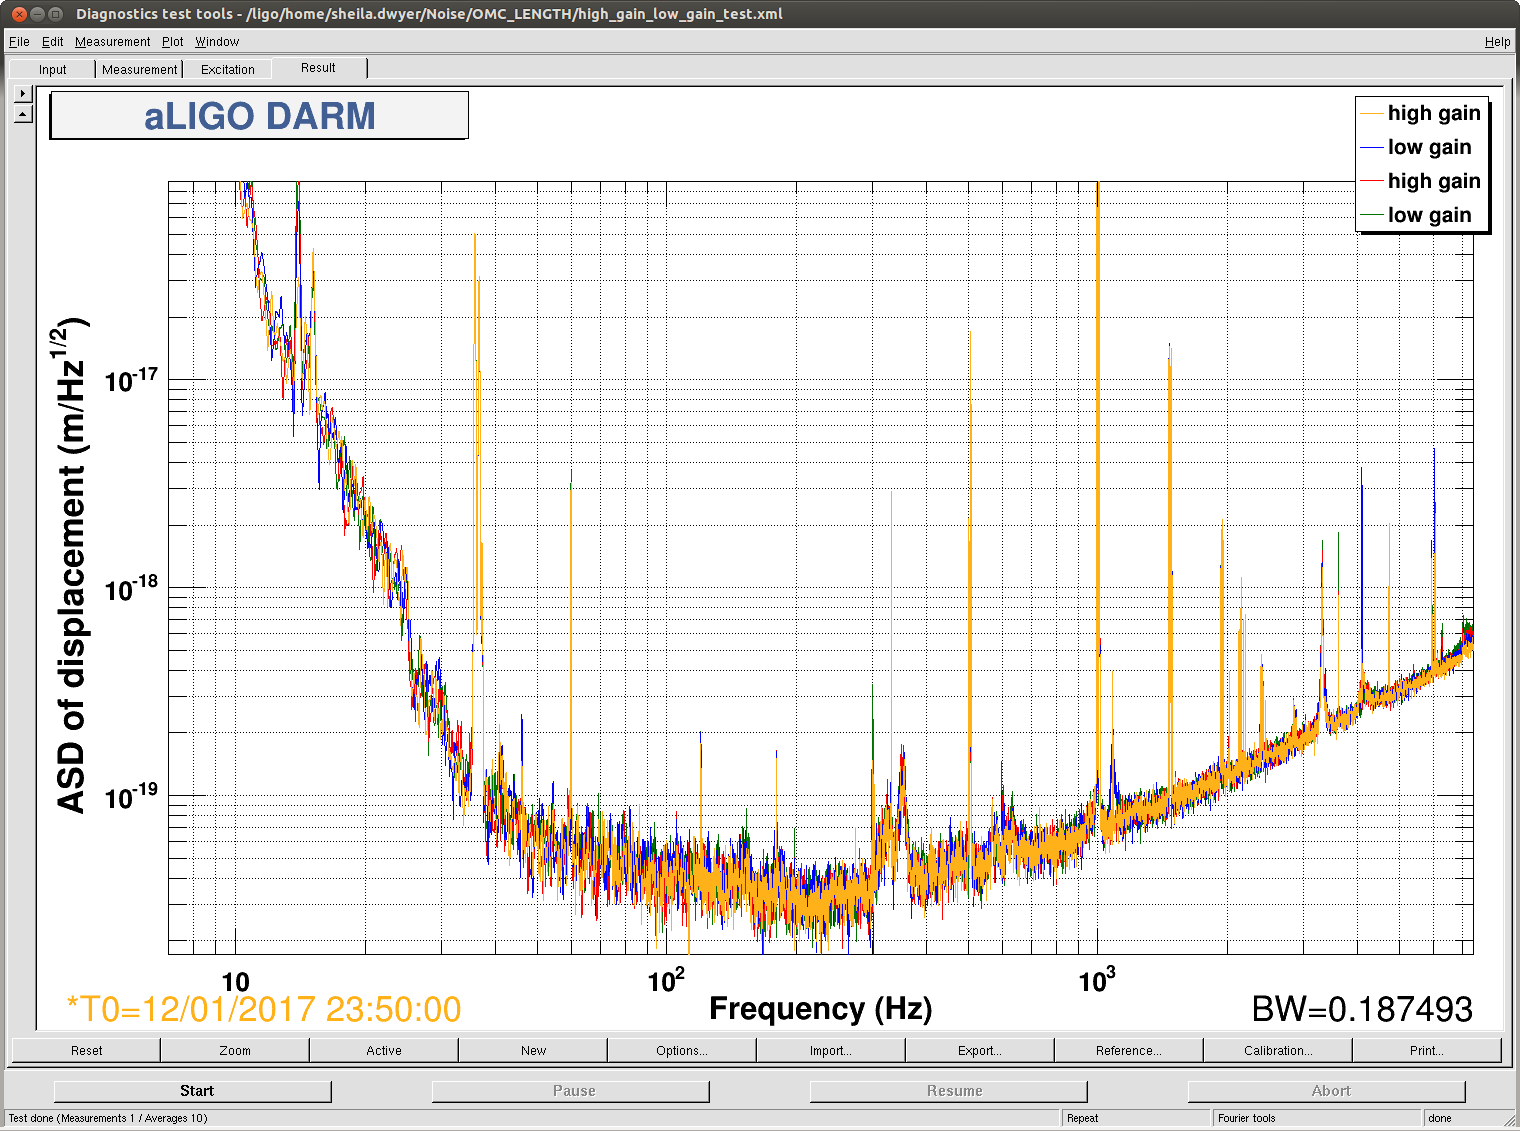
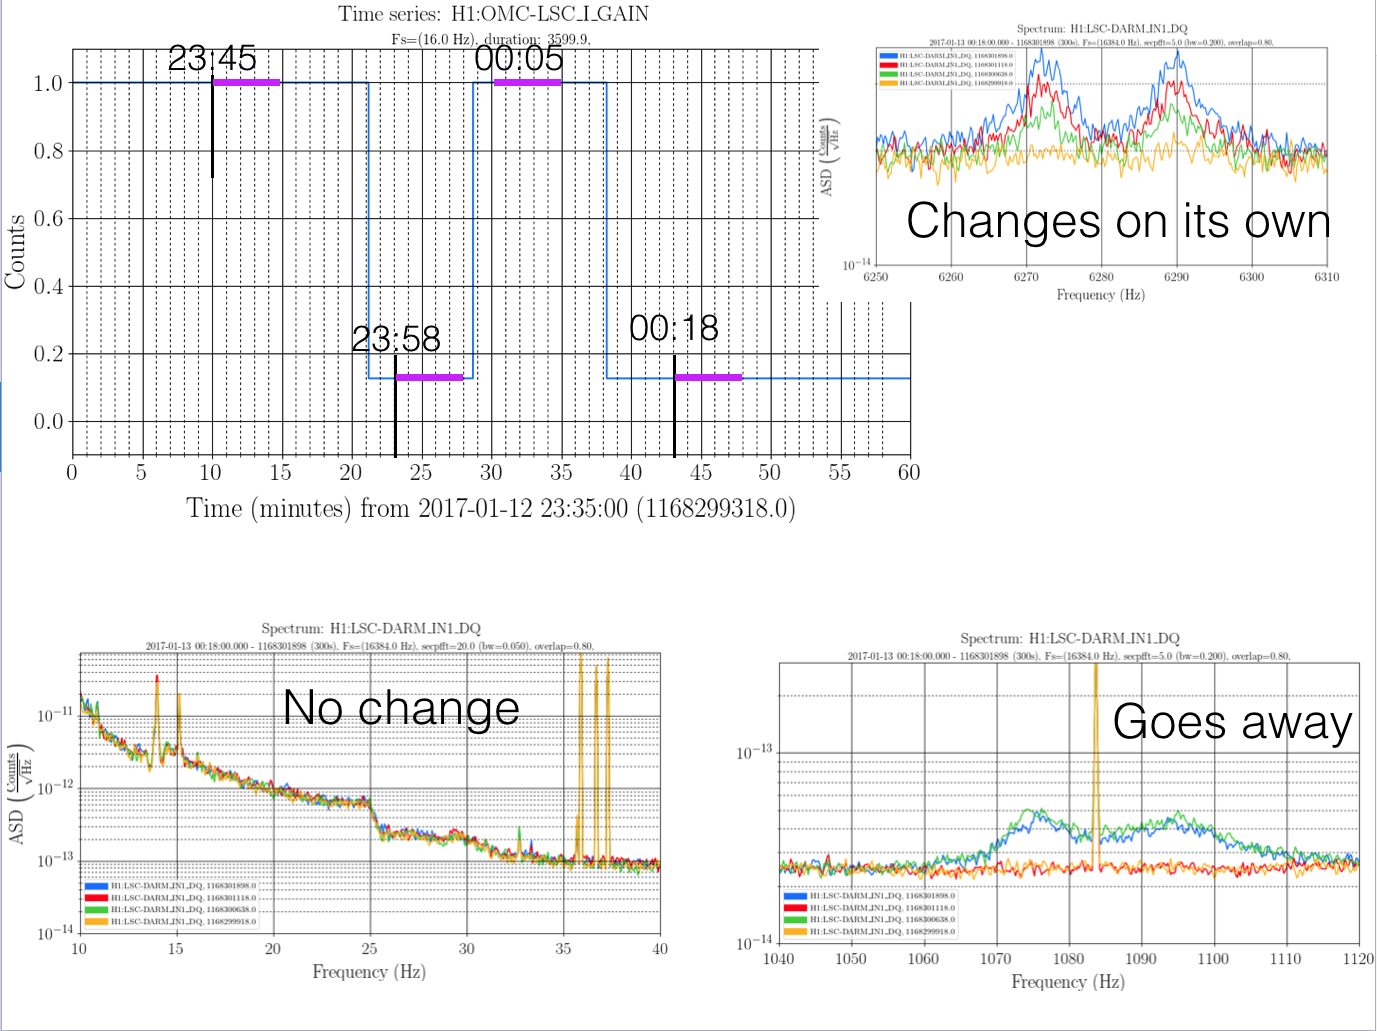
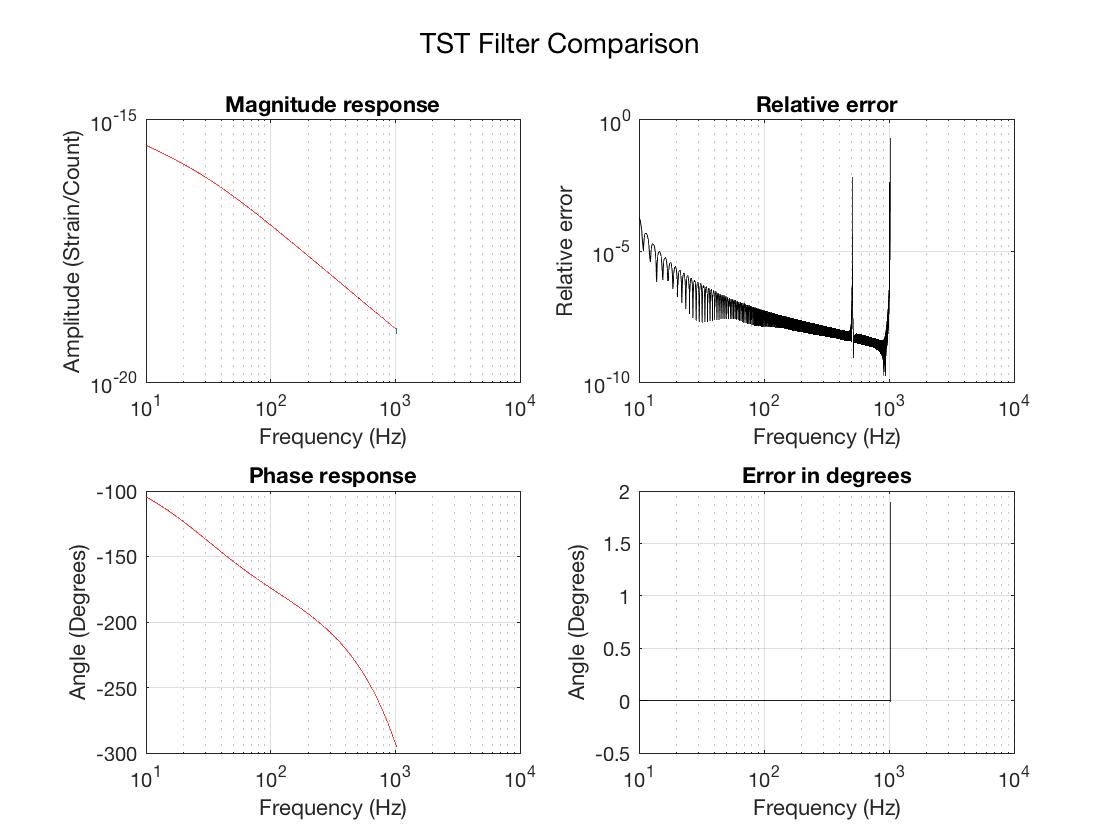
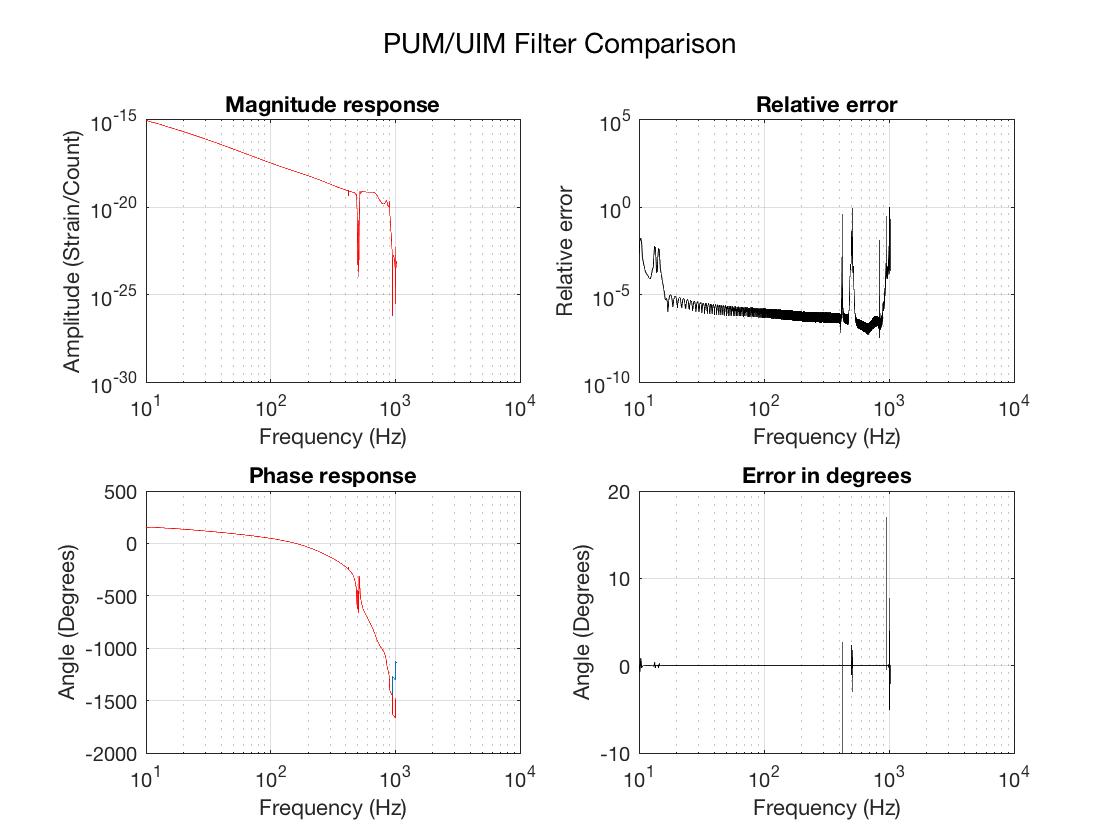
- The 1080 Hz glitches first appeared in the second lock on 11 Oct 2016 and were present ever since. It was discovered on 6 Jan 2017 (PST) that these glitches were caused by a problem with the OMC length control ( 33037). On 9 Jan 2017, the IFO was brought to low noise (but not to observing) to test some proposed changes. It turned out that the dither line amplitudes had been lowered on 11 Oct 2016 when the 1080 Hz glitch problem began. At that time, the OMC length servo gain was not raised to compensate for the amplitude changes. Today they ran with the servo gain set to 24 (to give the nominal 6Hz ugf) and the lowered dither line amplitude from 19:21 UTC to 19:51 UTC Jan 9th (see 33104). The glitches disappeared during this experiment. A second lock of the day, in observing mode, showed reappeared glitches because the changes during the experiment were reverted due to the ongoing configuration lock and concern that other channels might be adversely affected.
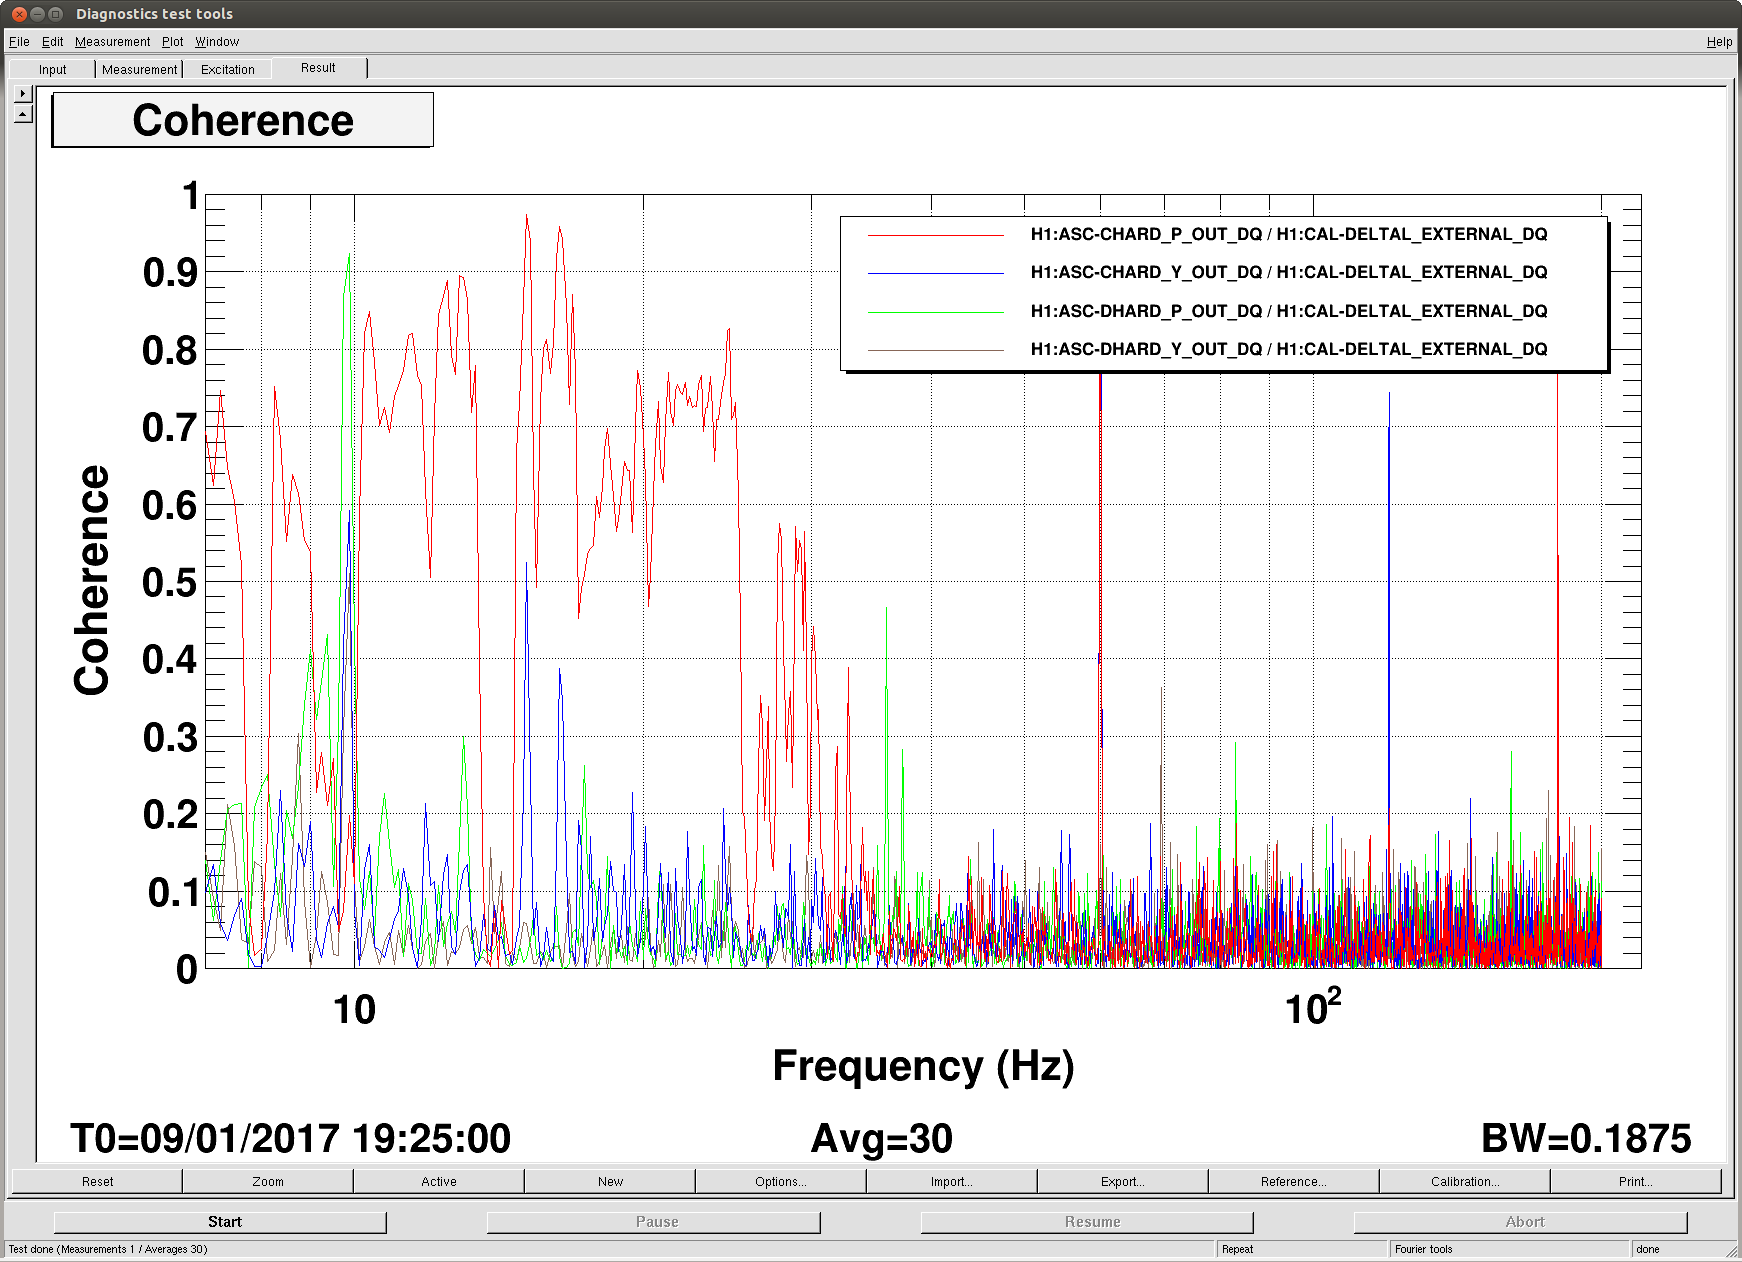
- A later investigation was made showing that channels found by hVeto to be associated with these glitches were either unaffected by the experimental configuration or had their glitching reduced by it. (See attached PDF.) However, concerns arose about increased noise from 10-25 Hz in DARM during the experiment although there was no evidence for correlations between DARM and OMC-LSC. See alogs (33175, 33176, 33177).
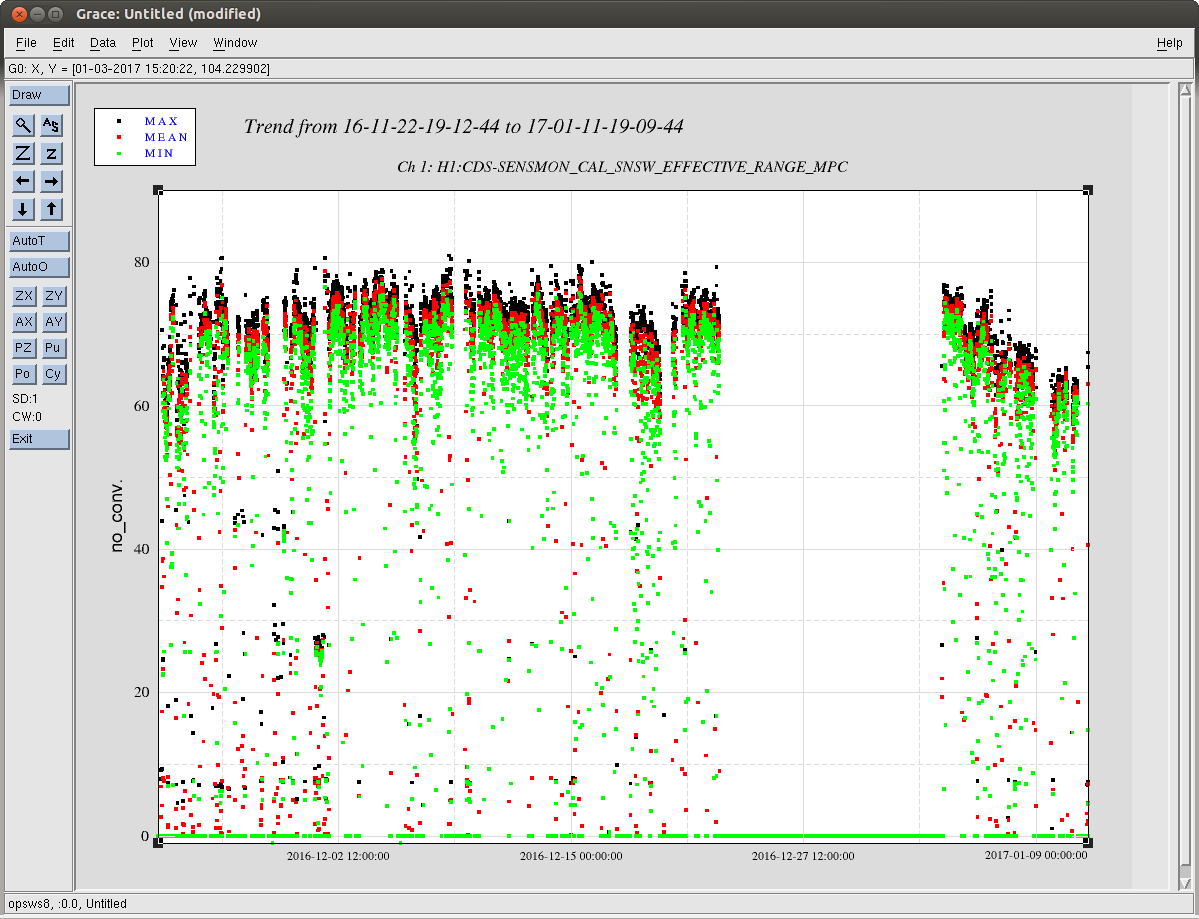
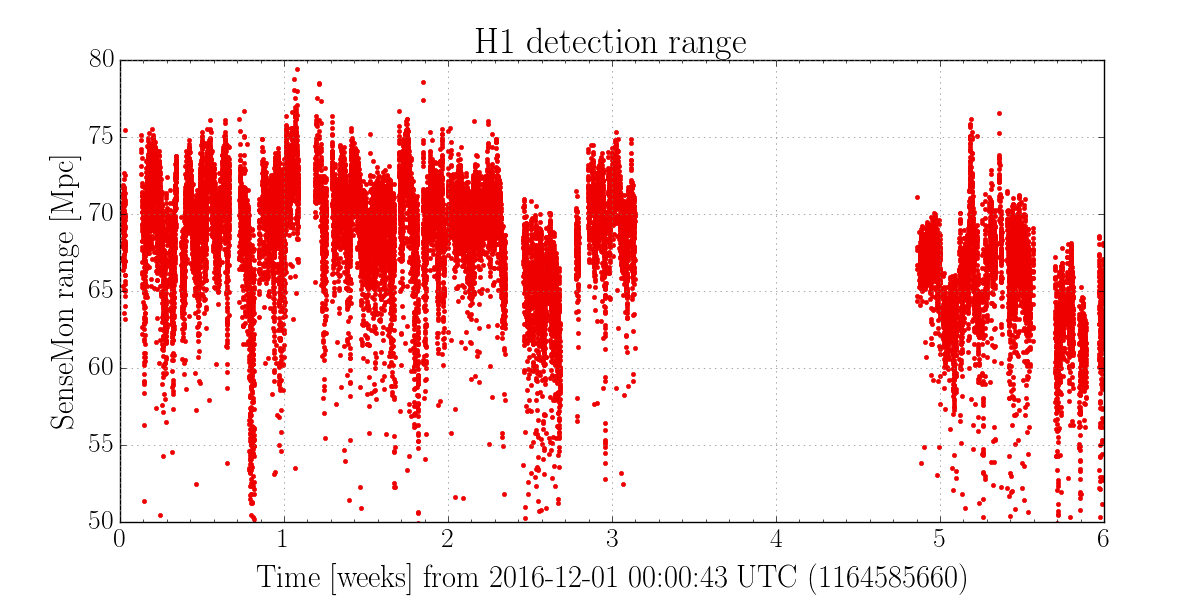
- The BNS range during this shift was only about 60 Mpc (with periods of lower range during episodes of snow plowing). Evan reports that Sheila has noted a steady decline of the range during O2. This has been getting worse in January. No obvious reason was found during this shift for the worsening range. See (33155) for a test to see if closing the POP beam diverter to reduce scattering improved the range. It did not. Range trend is shown here (as an attachment to alog 33155 by Sheila) or here (by Duncan McCloud).
- The elevated glitch rate (especially around 200 Hz) first seen on 6 Jan (and previously seen in December) seems to have decreased on 10 Jan and decreased further on 11 Jan.
Non-image files attached to this report


