|
From the DOE Hanford Operations Office: Due to the snow currently falling on the Hanford Site and surrounding communities, non-essential Hanford employees will be released from work early today. Only essential employees needed to maintain minimum safe operations are to remain at work through the remainder of the shift. To alleviate traffic congestion, please adhere to the staggered schedule below. • 200 East Area and all Areas South of the Wye Barricade, including employees working in Richland, 12:45 pm • 200 West Area and 100 Areas, 1:30 pm The Rattlesnake Barricade will remain open until 6:00 pm. Employees must check with their manager prior to leaving, are urged to use caution when driving home, and be prepared for adverse weather or road conditions. Employees are advised to stay tuned to area radio stations for possible road closures, which could affect travel. In addition, swing shift and graveyard shift has been cancelled tonight for non-essential employees. Only essential employees needed to maintain minimum safe operations are to report to work at the usual time. For updated information call the Hanford Hotline at 376-9999 or log-on to the Hanford Home Page at www.hanford.gov.
Weather
									Station# 12  (WYEB) at 550 ft above MSL

 Time: 15:30:00 PST      Date: 1/10/2017

 Ave Wind Direction = 316
 Ave Wind Speed     =  15
 Max Wind Speed     =  21
                         Celsius
 Ave Temp = 25.9          -3.42
 Max Temp = 26.0          -3.31
 Min Temp = 25.4          -3.64

 Wind Chill  =  13.8

 Rain Gauge = 0.00
|
TITLE: 01/11 Eve Shift: 00:00-08:00 UTC (16:00-00:00 PST), all times posted in UTC
STATE of H1: Observing at 59.2008Mpc
OUTGOING OPERATOR: Travis (handoff over phone & thumbs up on road) & TJ who gave me a verbal handoff in hallway
CURRENT ENVIRONMENT:
Wind: 18mph Gusts, 15mph 5min avg
Primary useism: 0.09 μm/s
Secondary useism: 0.27 μm/s
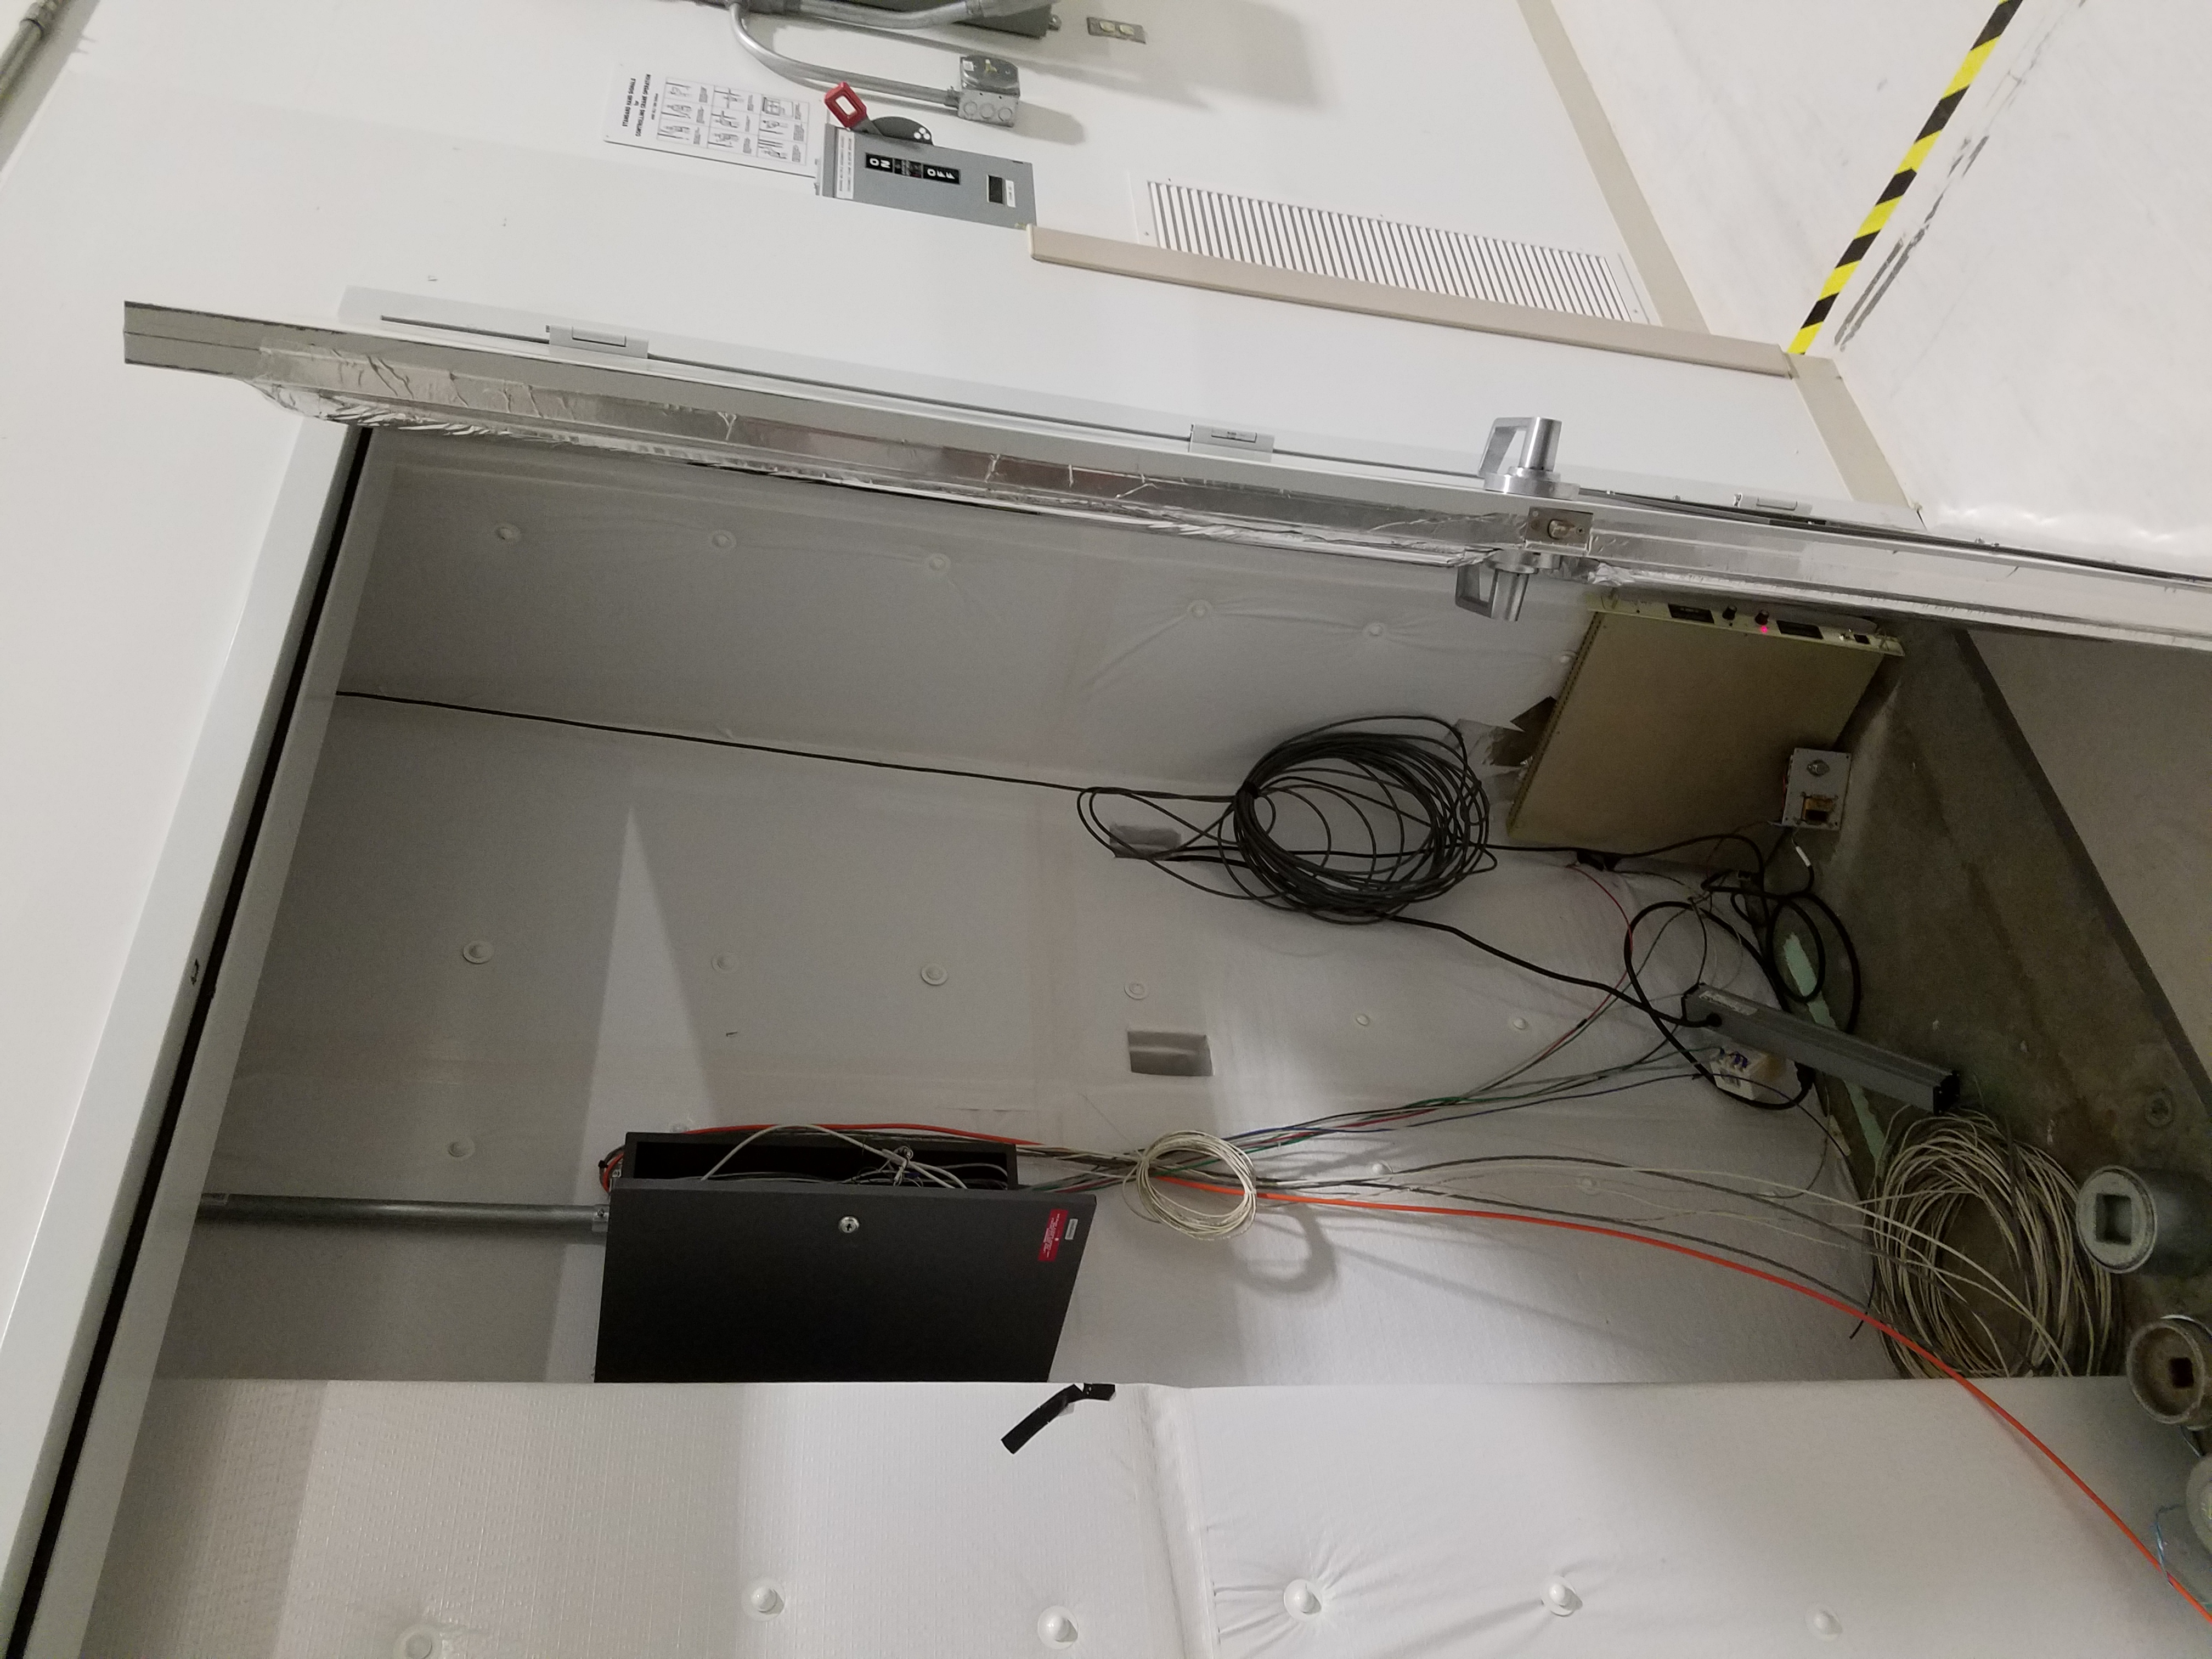
Hanford Site issued an early DAY shift ending at 12:45pmPST. Drive in was snowy & not terrible, but Route10's inbound lane (which I was a sole occupier of) was not plowed much & had some drifts of a 1' which caused me to throttle it down to 40mph (mostly less than that). Also saw one sad stranded BIG 4x4 truck on the side of the road on SR240 (which I was on from Twin Bridges to Route 10). It probably only took me 30-40min to come in on my usual 25min route (but this included me stopping to take some photos).
Winds look to be picking up and are hitting 20mph (more so on the Y-arm).
QUICK SUMMARY:
As I entered the building TJ, Kissel, & Dick were leaving. There was mention of pesky PI Modes, but other than that, I was handed an OBSERVING H1 with a range hovering around 60Mpc. We had just completed (at 0:14utc) the STAND DOWN time for a GRB at the end of the last shift.
I will carry on with the shift, but I am hesitant about the whole shift and will issue an email to Warner about our wintry conditions for his OWL shift.
Just before submitting this alog:
- 0:34utc GRB via Swift
- Stand down until 1:34utc
- Contacted Jeremy and they were also aware.


Observing at 22:43 UTC.