Jeff, Jenne, Sheila, Daniel, Young-Min
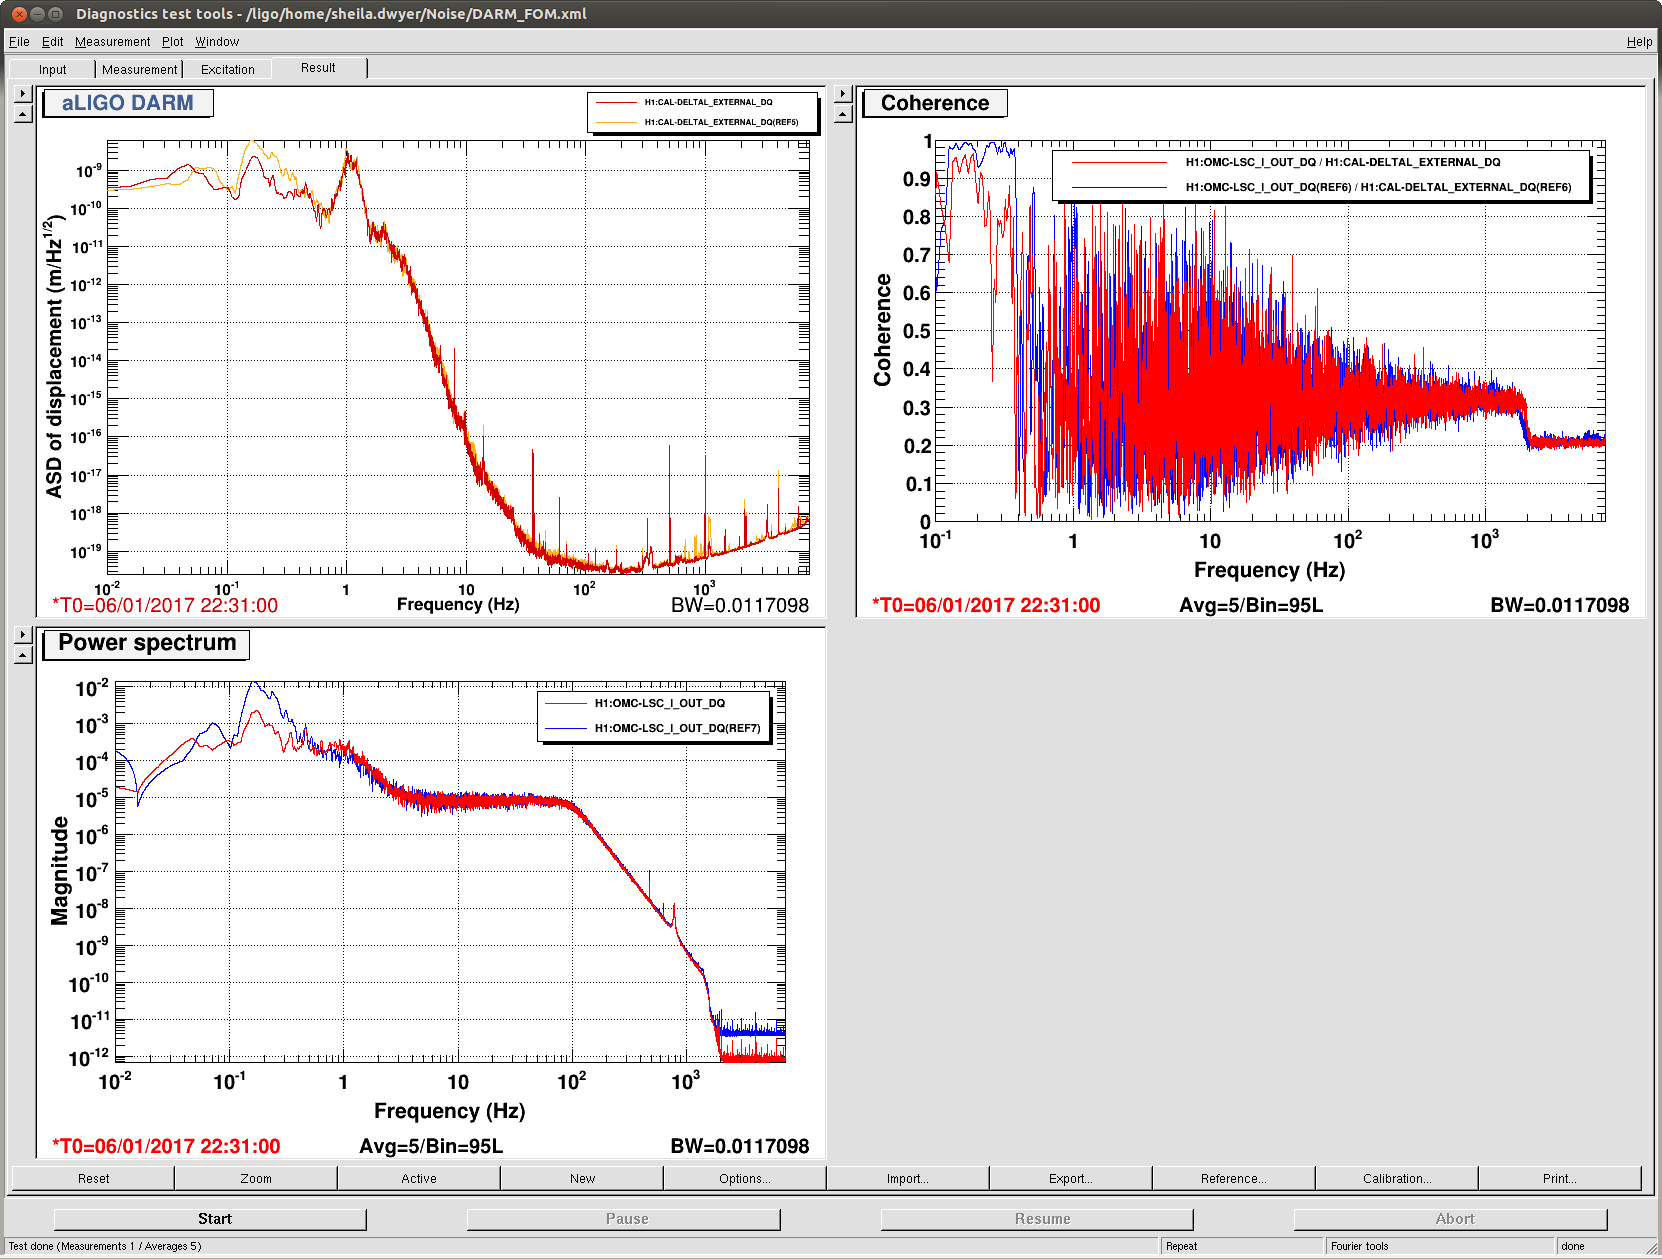
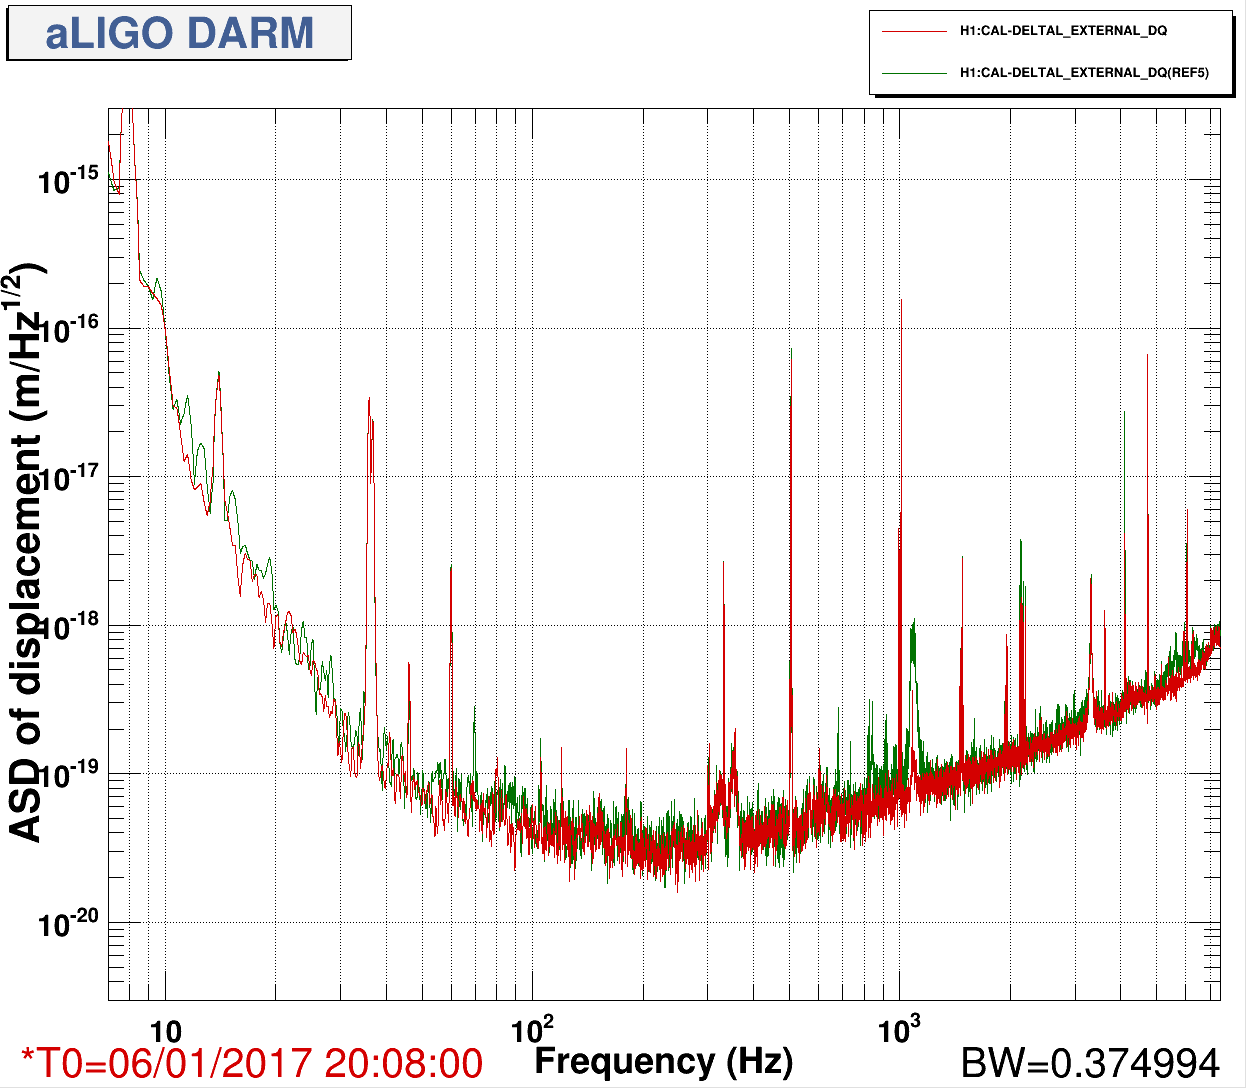
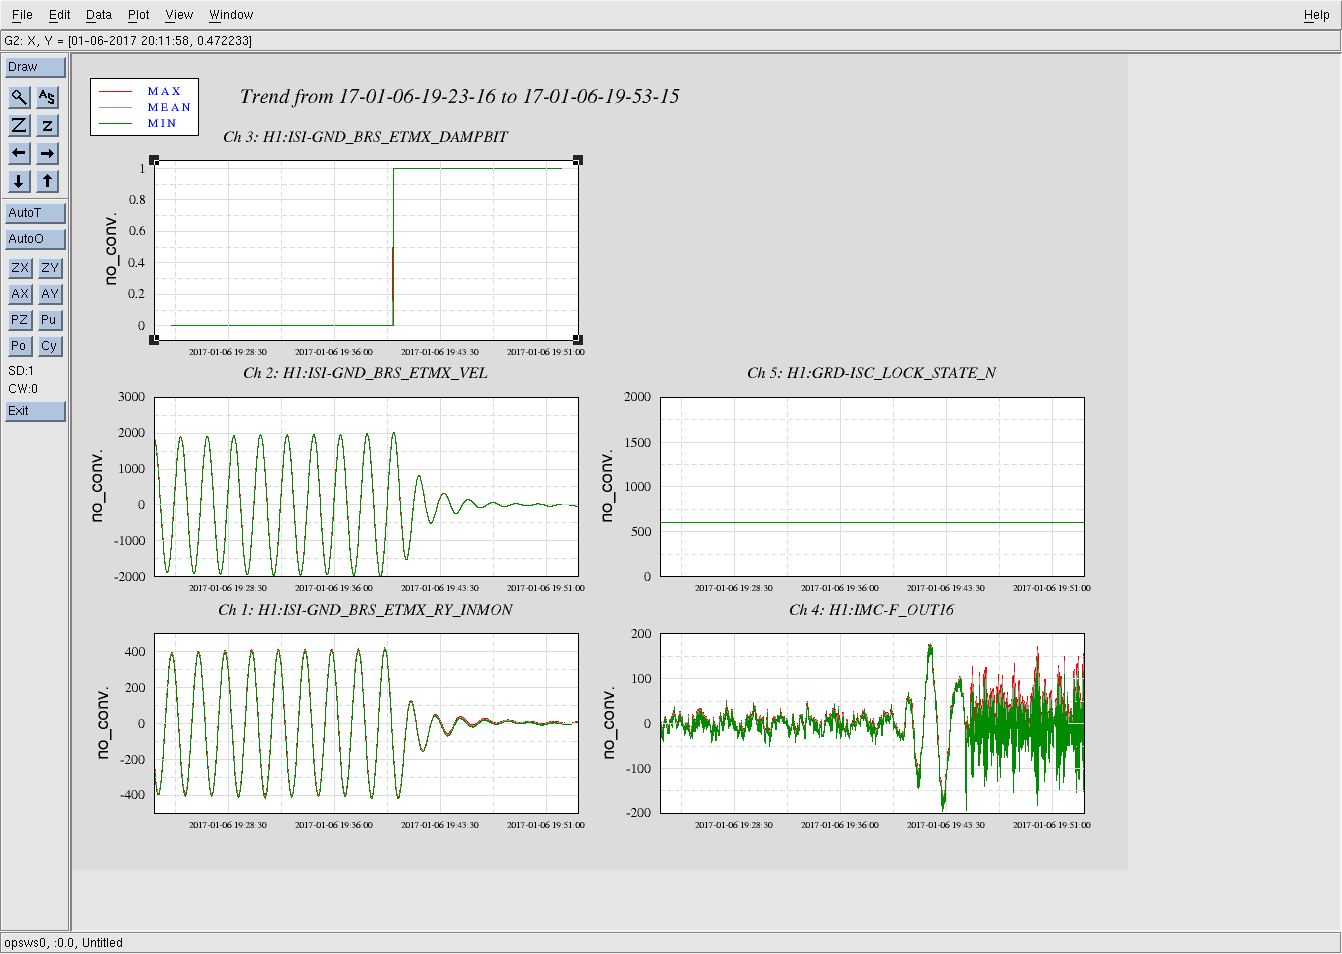
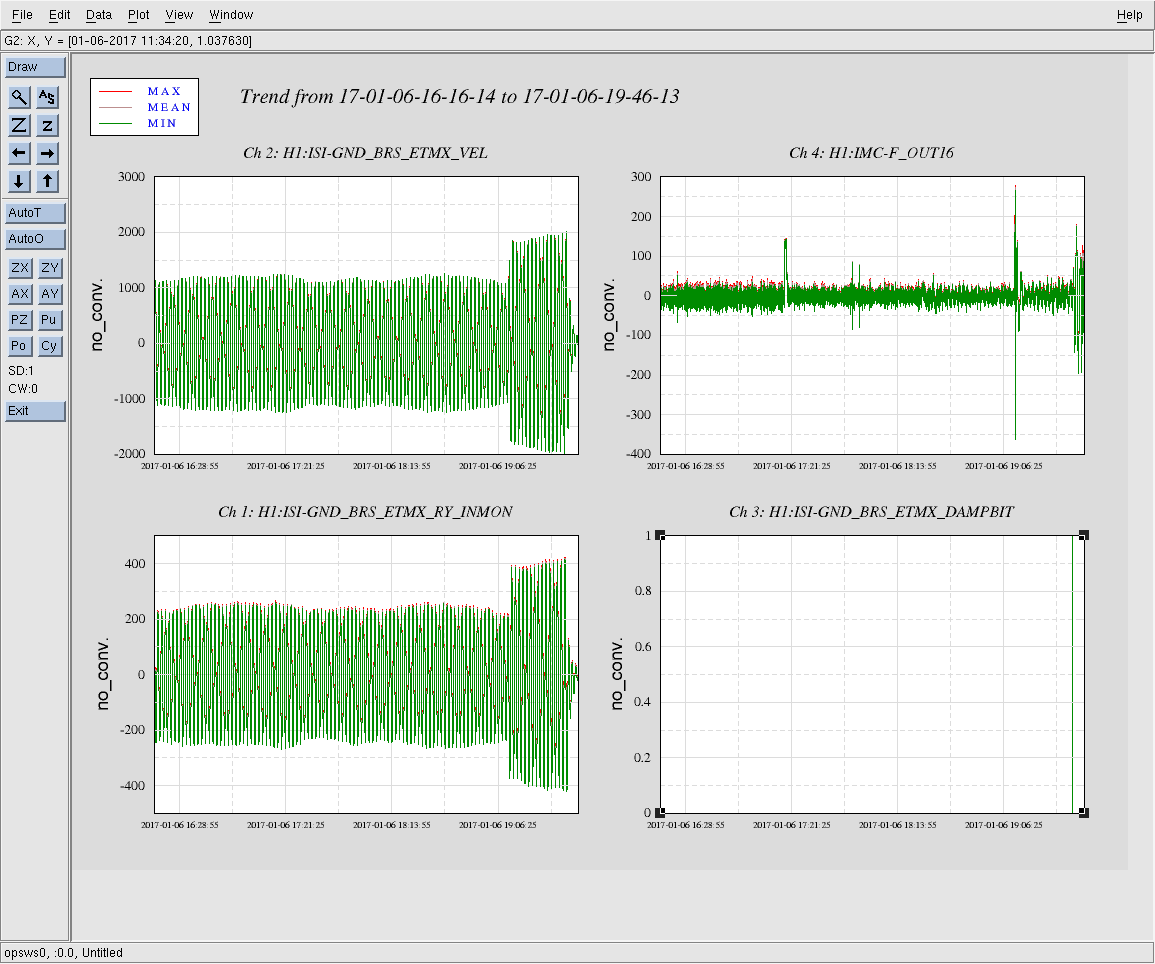
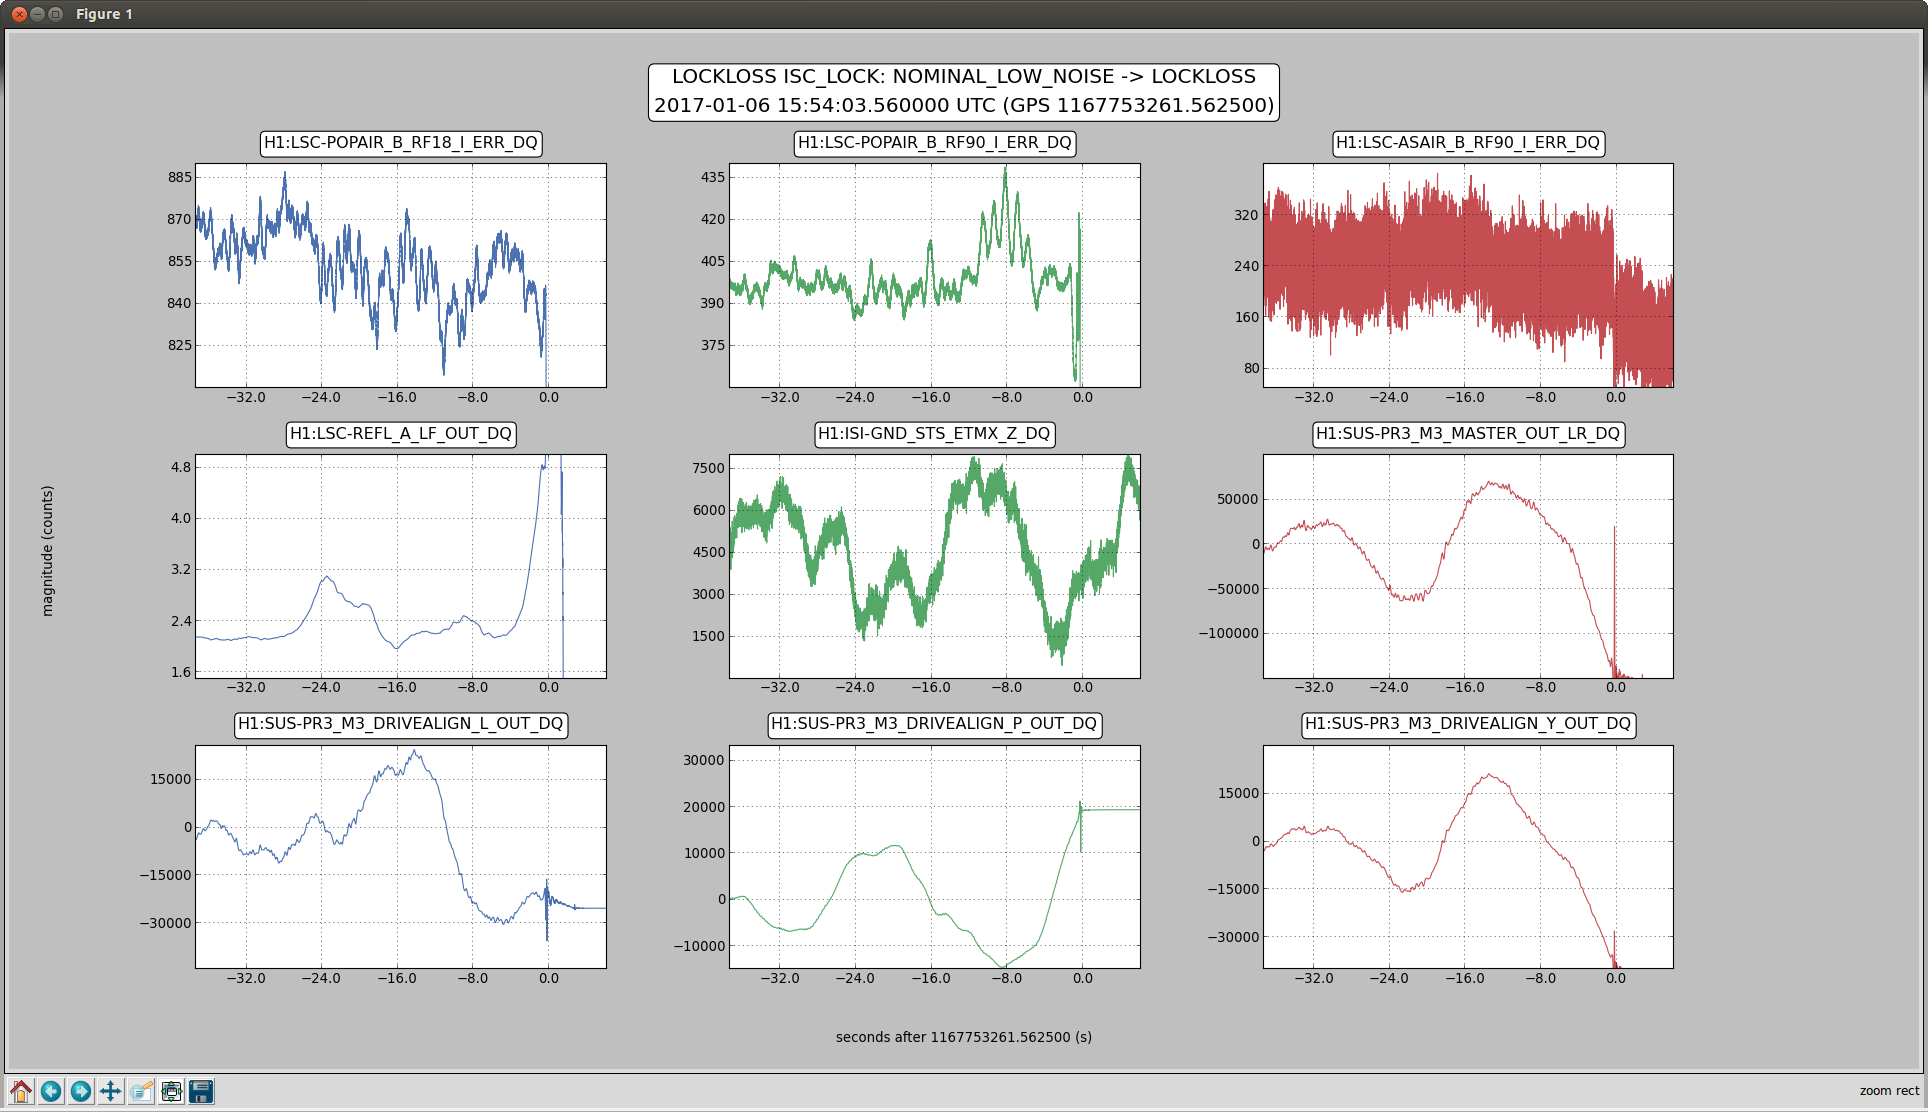
Earlier today Jim turned off ETMX sensor correction because of a problem with the BRS. This caused an increase in the motion of ETMX at low frequencies which will cause an increase in the frequency fluctuations of the laser through the CARM loop. The OMC length loop has to follow the laser frequency. Our current thinking is that the OMC length locking residual becomes too large when the sensor correction is off, so that the binear coupling of OMC length to DARM adds a lot of noise. We redid this test at 22:40 UTC to 22:50 UTC, the screenshot attached shows references from the time that sensor correction was off and red traces are from times when sensor correction was on. Young-Min did BRUCO scans from sensor correction on and off times, and saw broad coherence with OMC-LSC_I
In the past I tried to estimate noise in DARM due to OMC length noise: 30510 If you look closely at the 3rd attachments to that alog, you will see that there is a feature around 1084Hz in the estimated OMC length spectrum. This is probably where our peak in the spectrum which has been causing bothersome glitches come from. You can also see in the 5th attachment that this feature is predicted to be about a factor of 10 below DARM, so the coupling must be underestimated somehow. New realization: We reduced the amplitude of the dither line on October 11 to reduce the accoustic coupling at HAM6, (alog 30380), which coincides pretty well with the appearance of these glitches on the summary pages. The measurements I used for the estimates in alog 30510 were all taken before this change.
A second reason to suspect that the coupling is underestimated in alog 30510 is that the same model of OMC length noise would have suggested that the 16Hz comb on the dither line would not have appeared in DARM, but we know that it did: alog 25703 and comments. Understanding the OMC length coupling seems important because we have seen that we can add broadband noise to DARM with OMC length excitations.
According to the model of the OMC loop we have room to add a boost of the OMC length loop, to see if this helps with the feature at 1084Hz (we tried this once which broke the lock, we should remeasure the loop before transitioning to DC readout to try again). First I would like to try reverting the change to the OMC length dither amplitude, but we will hold off on doing that for now.
Updated to 5.7M on USGS.