Summary: shutting down the main HVAC system increased the range by 2-3 Mpc. The shutdown produced a large change in DARM, 8-10 Hz, and ~ 3% change between 48-130 Hz. The feature in the 8-10 Hz band may be due to turbulence in the Y-end chilled water flow and would probably be reduced by lowering the frequency of the VFD at Y-end. It is not yet known if this will reduce the noise in the 48-130 Hz band.
Thursday, Dec. 22, before we shut down, I cycled the main HVAC multiple times in order to see if it was costing us range. In the blue “off” periods in the figures, the chiller pad chillers and water pumps were off, the turbines were off at EX, EY, and CS, and the OSB fan was off. Figure 1 shows that the range improved by 2 to 3 Mpc during the “off” periods (we were averaging about 70 Mpc).
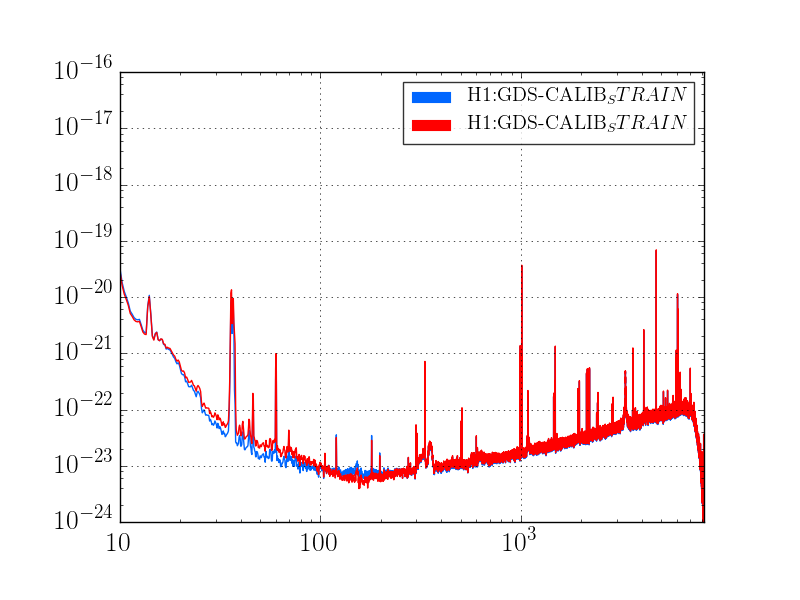
Figure 2 shows that the DARM spectrum improved in the 6-18Hz region, by a large factor between 8 and 10 Hz, and by roughly 3% in the 48-130 Hz regions. It is not clear whether the noise produced by the HVAC in the 48-130 Hz band is produced by vibration at lower frequency or by direct coupling. Low coherence with vibration sensors (< 1% in most of the 48-130 Hz band), and the observation that there is little change in peaks in that band that are known to be driven by vibration, suggest that the increased noise in this band is produced by vibration at lower frequencies and not by linear coupling. However, a preliminary look at PEM injection suggest that it is not impossible that the noise in the 48-130 Hz band is produced by direct vibration coupling. We will investigate this with further analysis of data from PEM injections.
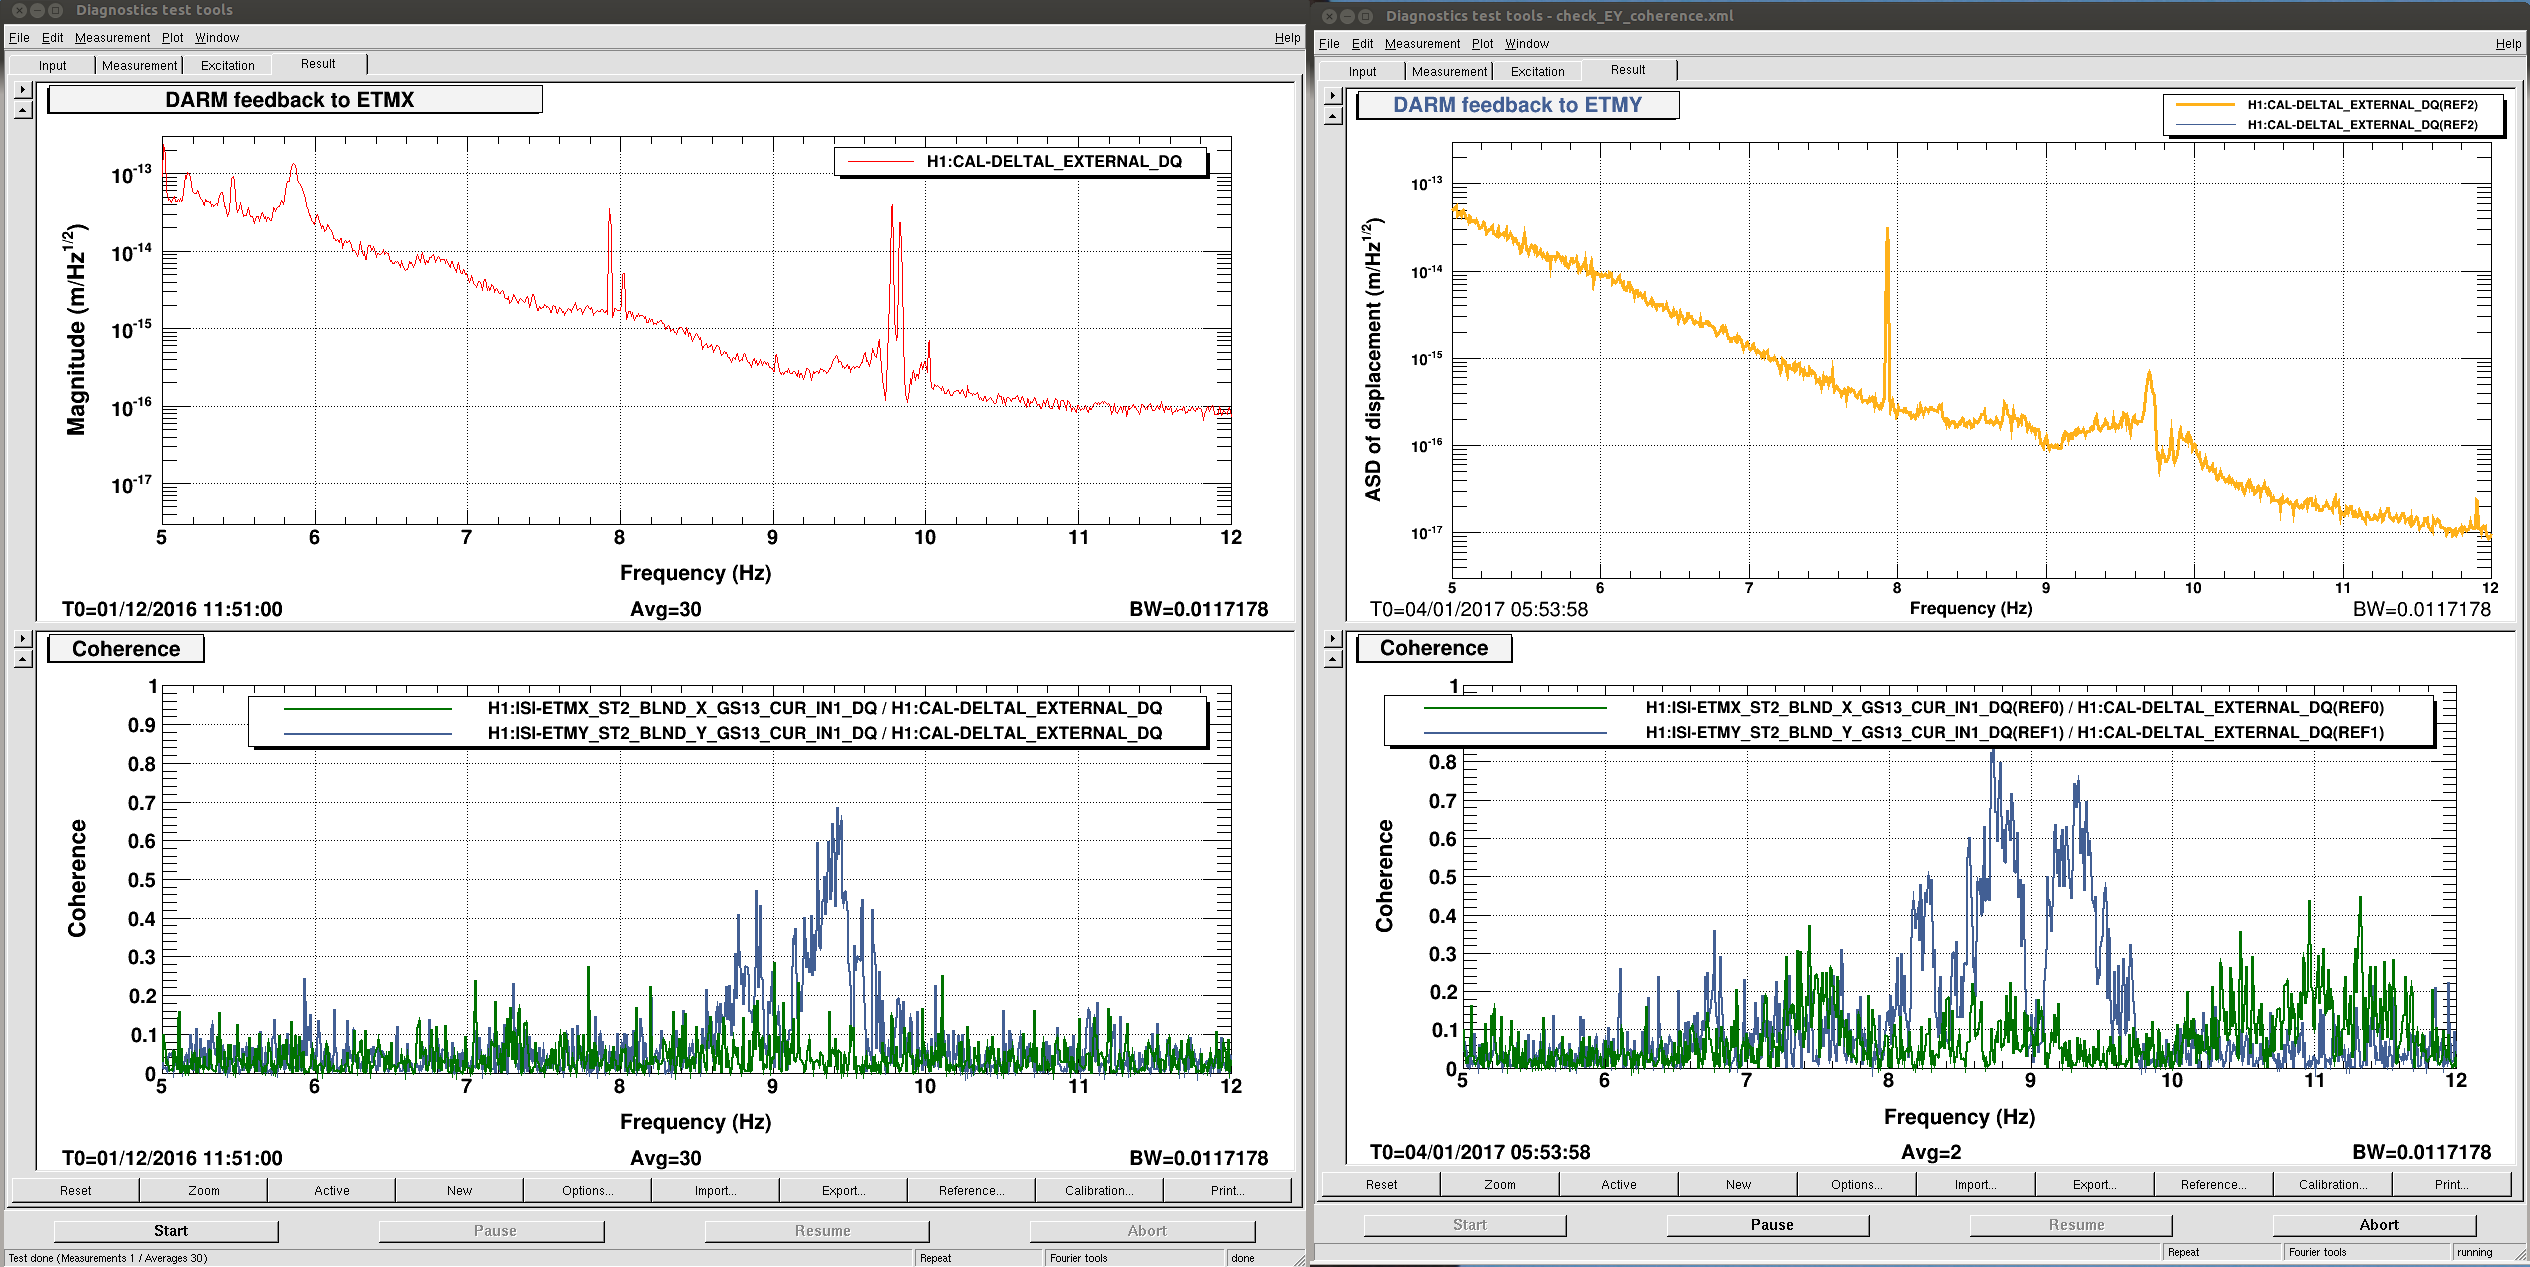
The biggest difference between “on” and “off” was in the 8 -10 Hz band (Figure 2). Figure 3 shows that Y-motion of ETMY ST2 is quite coherent with DARM, while X-motion at ETMX is not coherent with DARM. The CS is also not as coherent at these frequencies. The chilled water flow at EY has previously been shown to produce vibration in this band from turbulence (https://alog.ligo-wa.caltech.edu/aLOG/index.php?callRep=11466), so reducing the setting of the variable frequency drive below the current 50Hz level (I recommend 35-45Hz in the linked log) might reduce the 8-10 Hz region of DARM. Further analysis of PEM injections and additional injections at 9 Hz at EY would help us determine if the 8-10 Hz drive at Y-end is also responsible for the noise in the 48-130 Hz band.
Shutdown times:
UTC Dec. 22
21:24:00 shutdown starts, 21:26:00 complete
21:34:00 startup starts, 21:36:40 complete
21:44:00 shutdown starts, 21:45:40 complete
21:54:00 startup starts, 21:55:40 complete
22:04:00 shutdown starts, 22:05:40 complete
22:14:00 startup starts, 22:15:40 complete