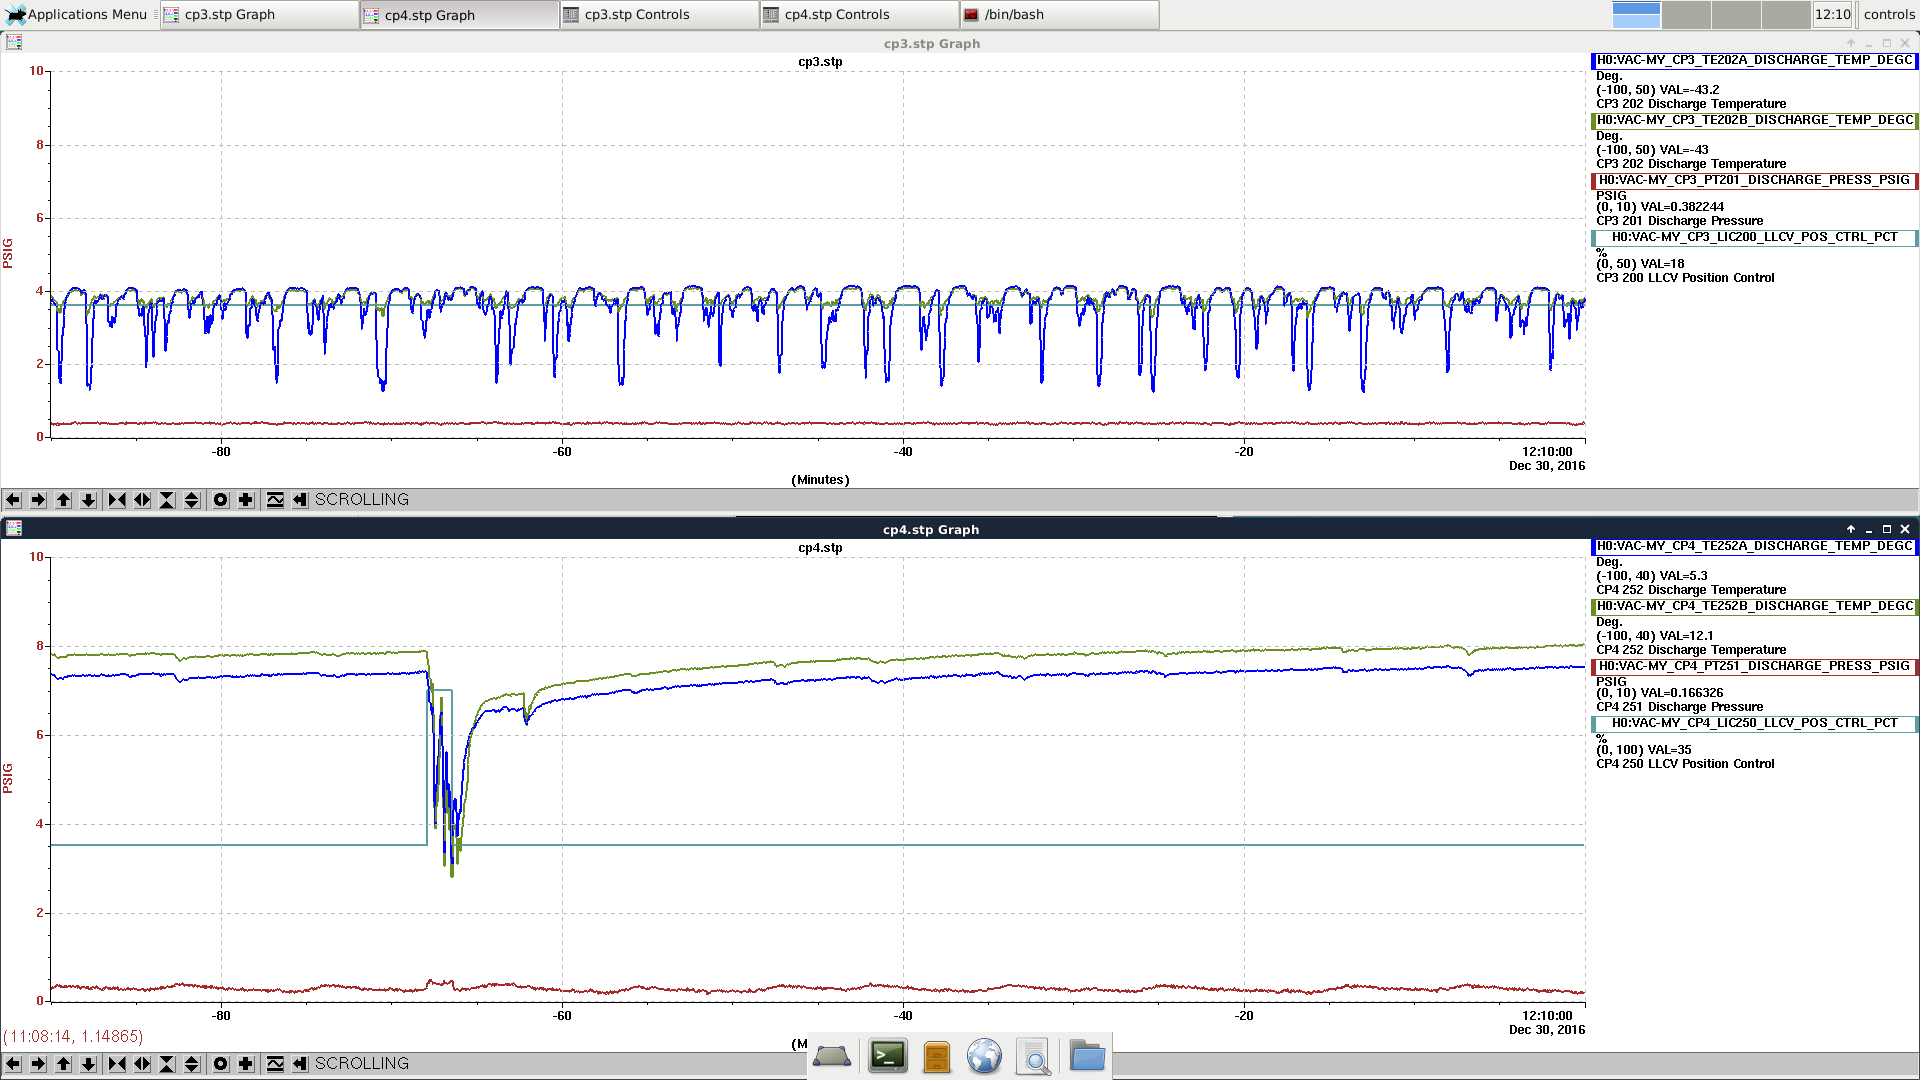
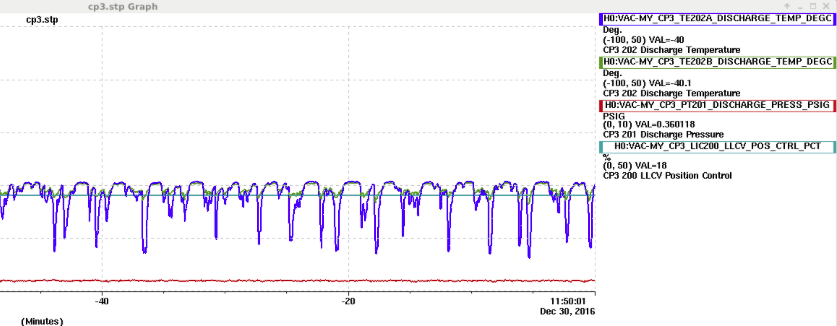
jeffrey.kissel@LIGO.ORG - posted 09:28, Tuesday 03 January 2017 - last comment - 09:44, Tuesday 03 January 2017(32911)
SEI Configuration Restored to Nominal (BRS X Damping still OFF)
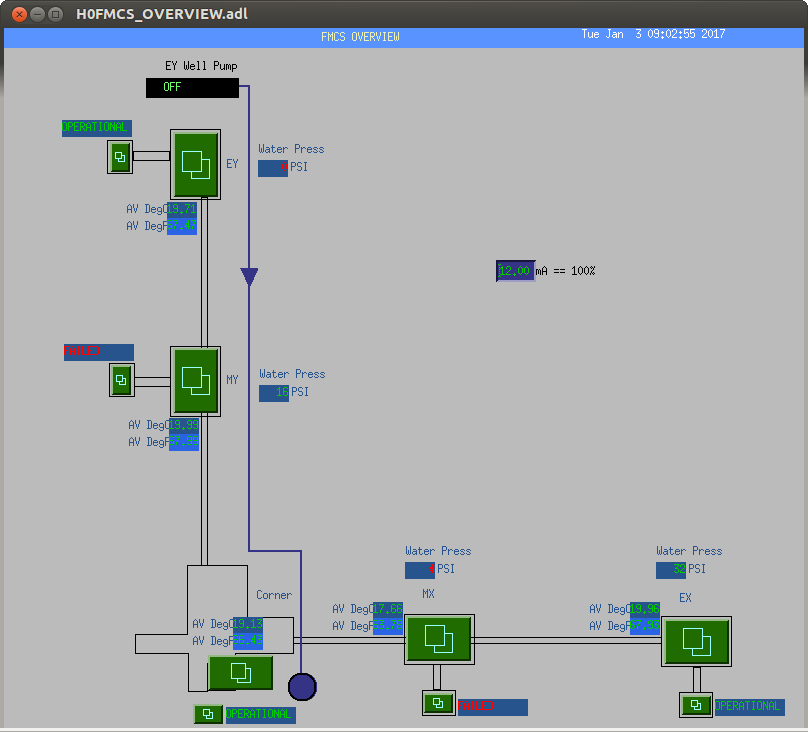
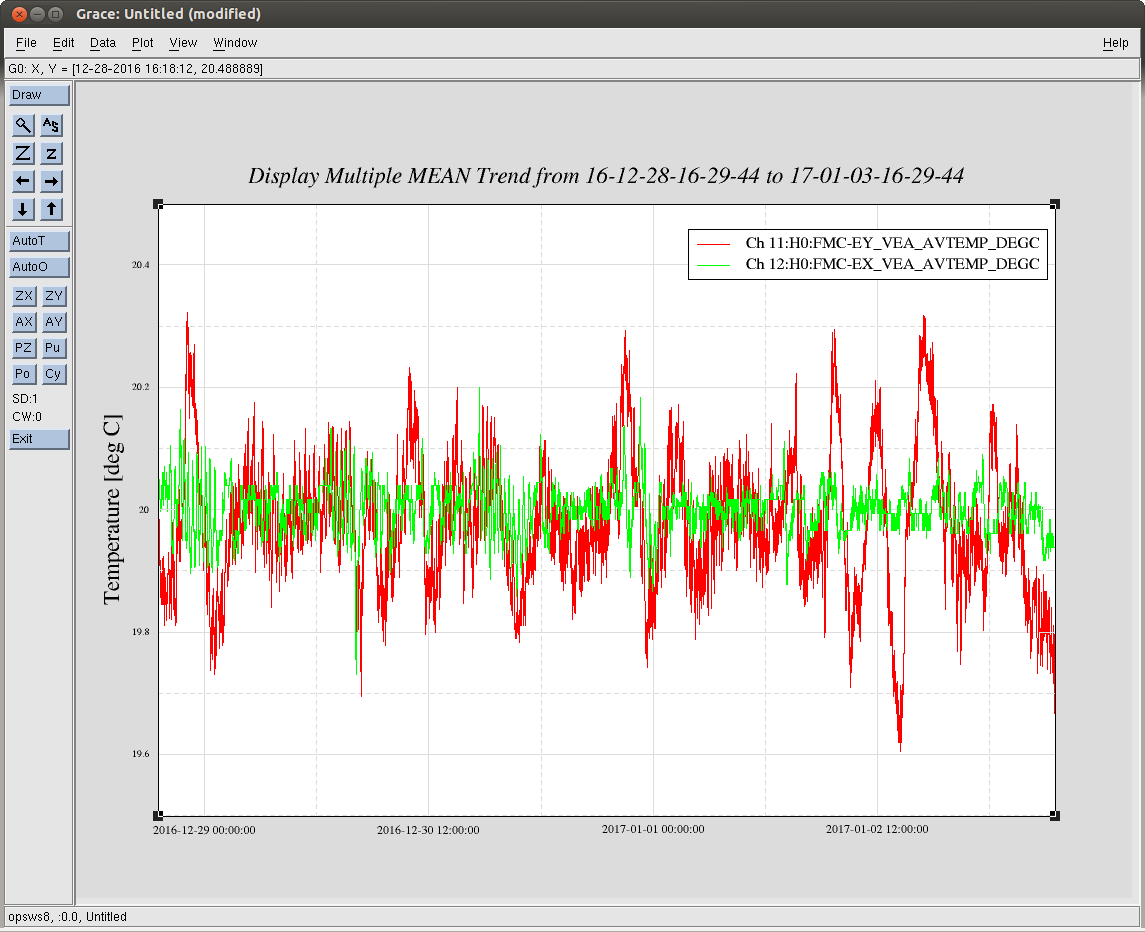
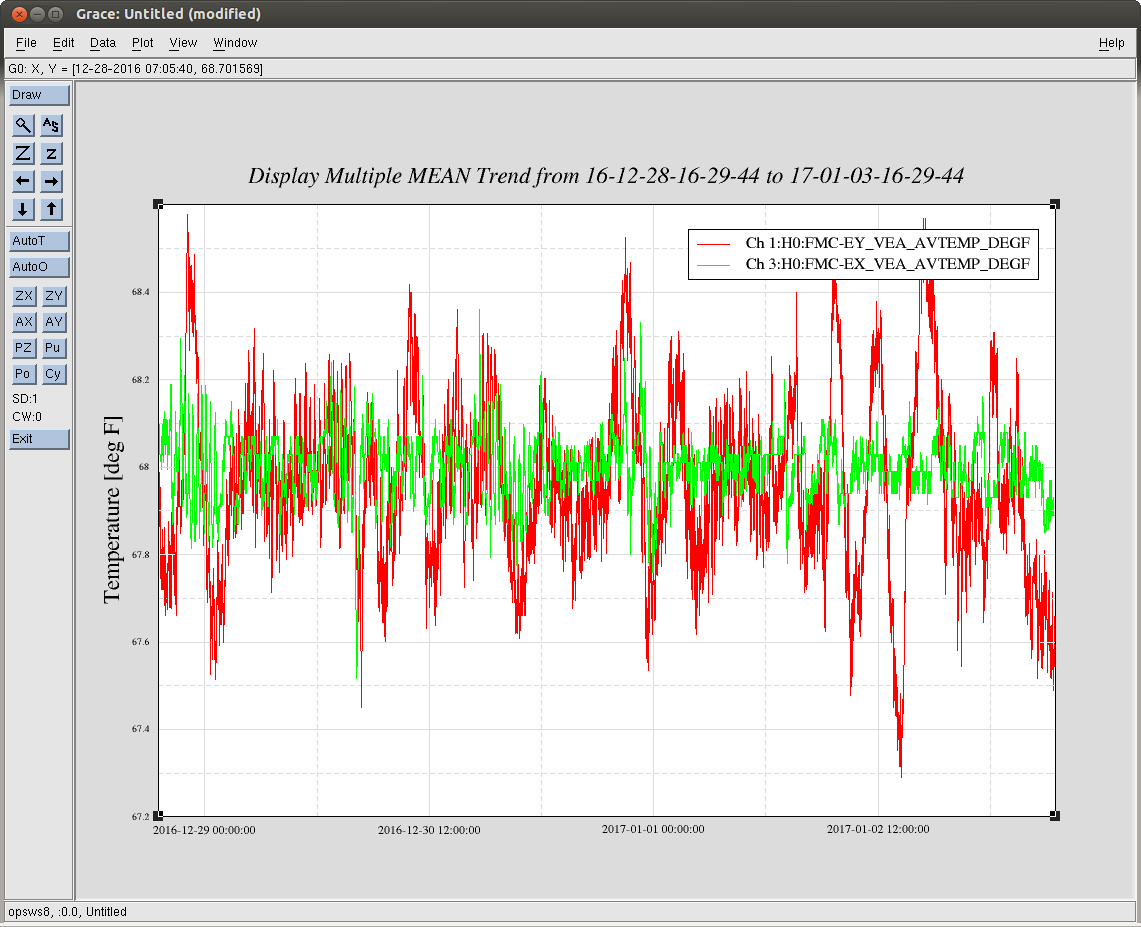
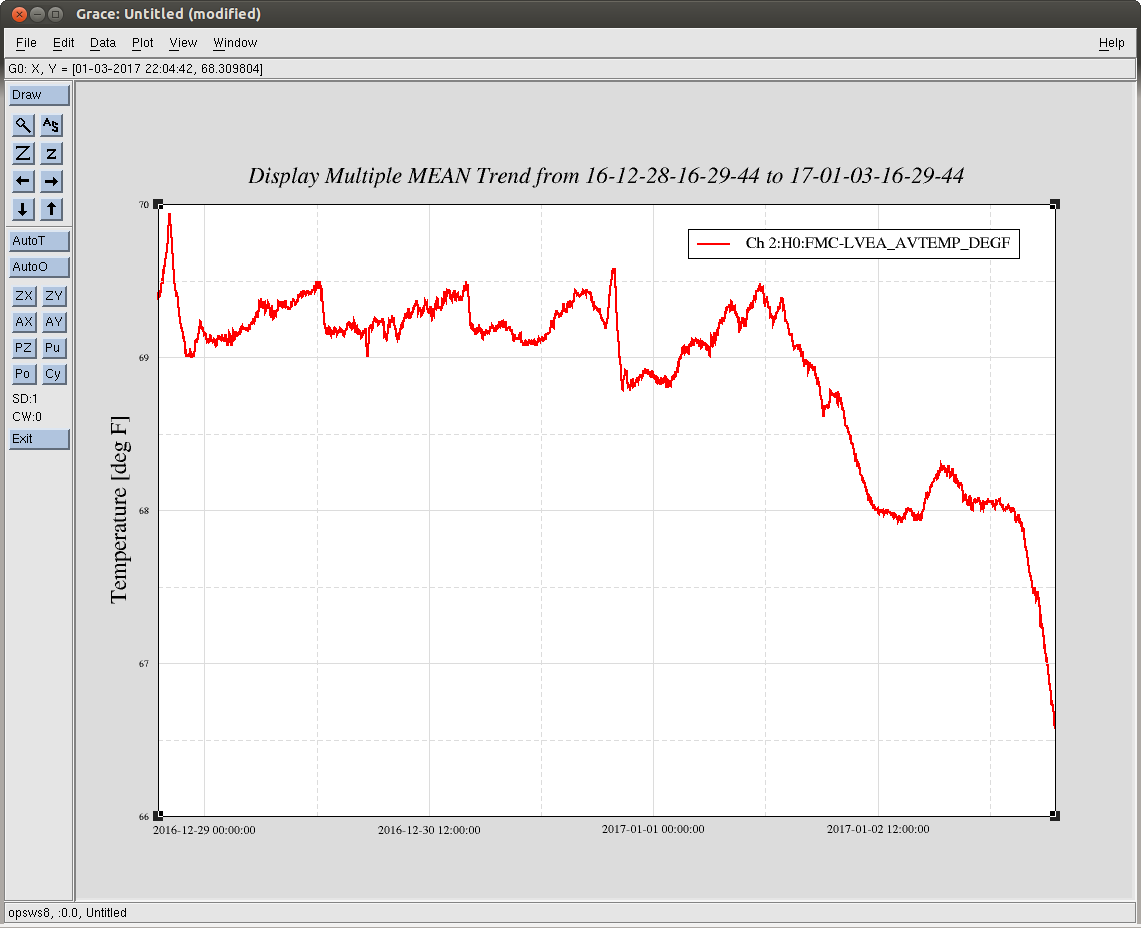
J. Kissel, C. Gray

We've used the chamber managers to bring all SEI systems back to nominal -- HAMs to ISOLATED, ITMs and ETMs to FULLY_ISOLATED, and BS to ISOLATED_DAMPED.

Before turning on sensor correction, I checked that the end-station BRS signals looked sane, and they do. BRS X damping is still OFF, but the amplitude of the raw tilt signal looks within +/- 100 [ct], which is acceptable.

Once isolated, I used the ISI_CONFIG manager to bring all platforms to their respective WINDY configuration, as per nominal.

All chambers are now running smoothly as expected, with there BLRMS blinky-light matrices almost entire green, with a little yellow sprinkled here and there (again, as expected).
J. Kissel, J. Warner

BRS X Damping restored. This is doable remotely, by requesting
     caput H1:ISI-GND_BRS_ETMX_USER 1

this changes the displace of this channel on the BRS overview screen from "DISABLED" to "ENABLED." However, if the rotational velocity of the BRS X signal (H1:ISI-GND_BRS_ETMX_VEL) is within +/- 800 [ct] [as is the case currently], the damping will not turn on, and the status bit (H1:ISI-GND_BRS_ETMX_DAMPBIT) will continue to report that damping is OFF.