[Borja]
This entry is to reproduce the analysis I did at L1 as described here and the associated comments.
The main idea is that currently during locklosses many control signals to the suspensions (QUAD and tripple suspension) become too large, which may have an effect on their stability and the time taken to relock. Also the control signals, in many cases, take many seconds to be turned off by GUARDIAN. An approach to deal with this could be to set limits to the range of values that these control signals are allowed, for this I have compiled a range of values these channel had during many lock segments in the range of 1.5 months.
The control channels analysed are given on the attached file 'H1_SUS_channels_for_analysis' (total of 192 channels). From these 157 channels did not have a range of zero for all lock segments.
The lock segments analysed are all those from Oct 22 2016 02:32:49 UTC to Dec 09 2016 19:23:51 UTC with DQ flag L1:DMT-GRD_ISC_LOCK_NOMINAL:1 which informs 'Guardian indicates IFO is in nominal lock state'. A total of 285 segments were retrieved but from those I only looked at lock segments lasting more than 15 secs which reduced the number of Segments to 280. From these there were abot 35 which gave errors when querying the data.
The huge ammount of results are given as figures with subplots each grouping multiple channels associated to a same suspension. The horizontal axis is always 'Number of Segment', the vertical axis it will depend on the analysis done; range during lockloss, time taken to zero de channel after lockloss and Value of the channel during lock (max, min and median).
Each figure is given as a Matlab figure file because of the possibility to turn on and off individual lines on each highly populated subplot and because of the orders of magnitude difference in the range of values that different channels for the same suspension can have (a .png version of the figures is also attached for convenience but notice that to get the full information you will have to look at the .fig file). I have also attached the matlab scripts used to generate each set of results.
Results:
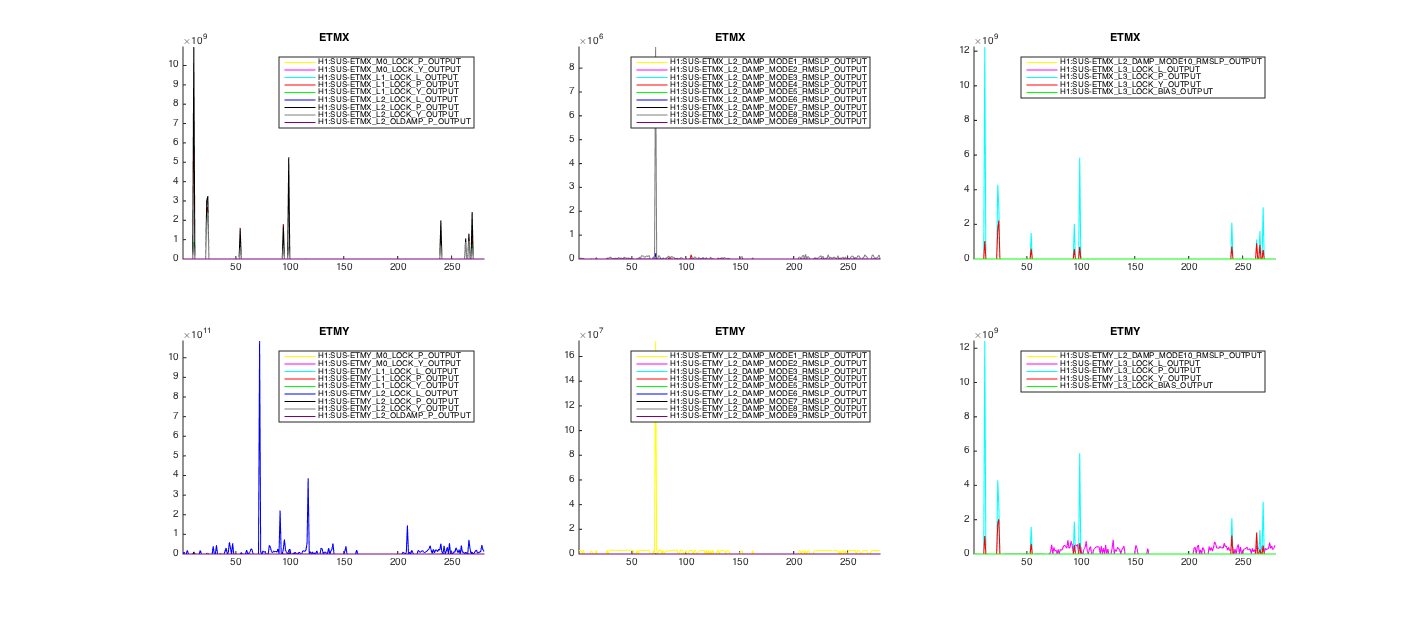
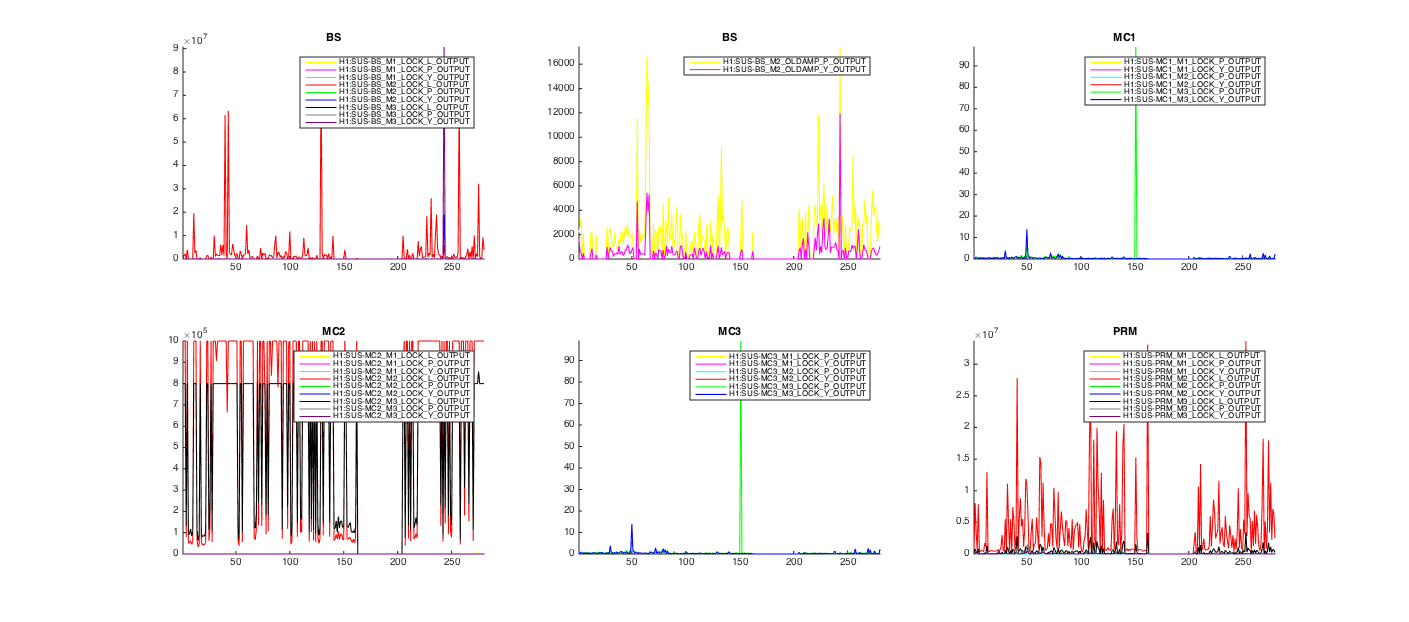
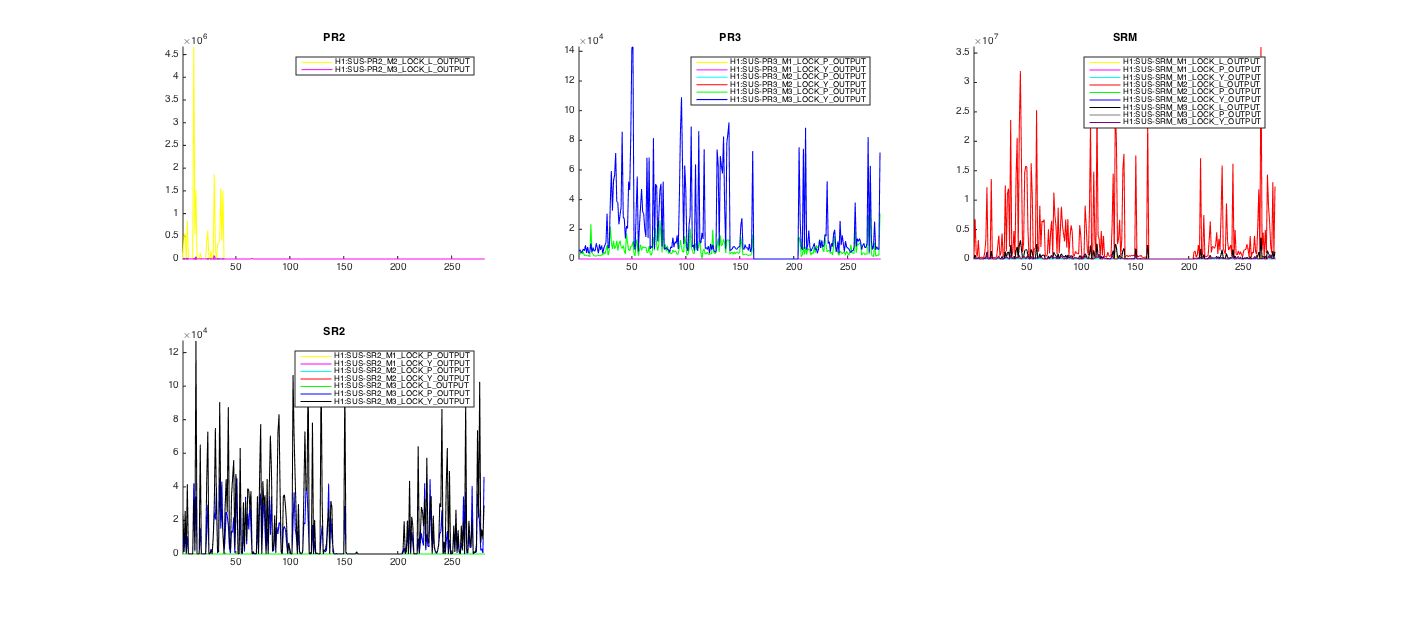
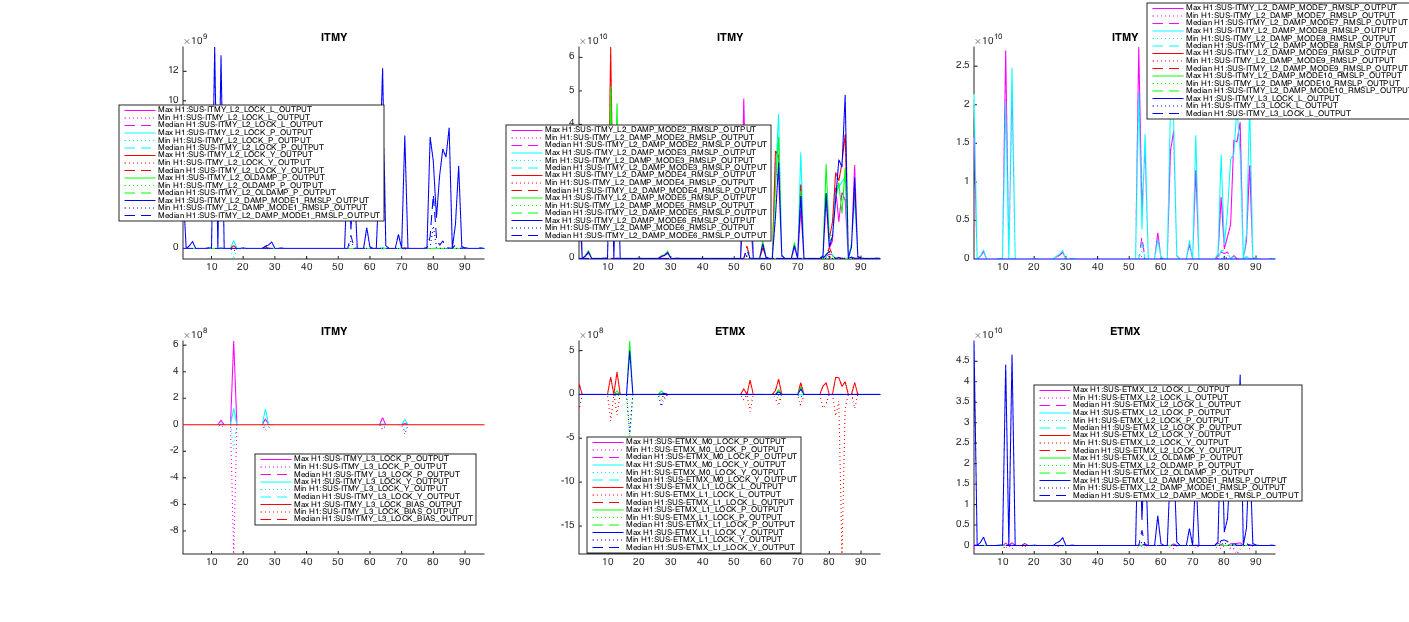
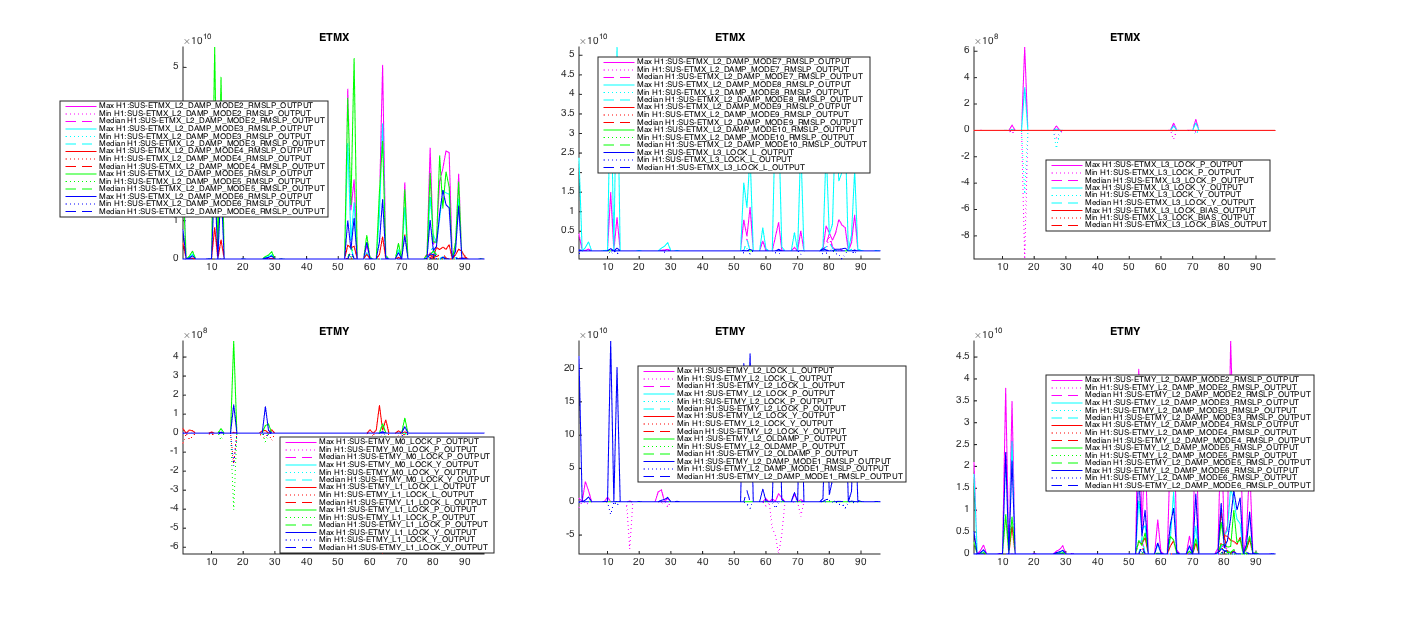
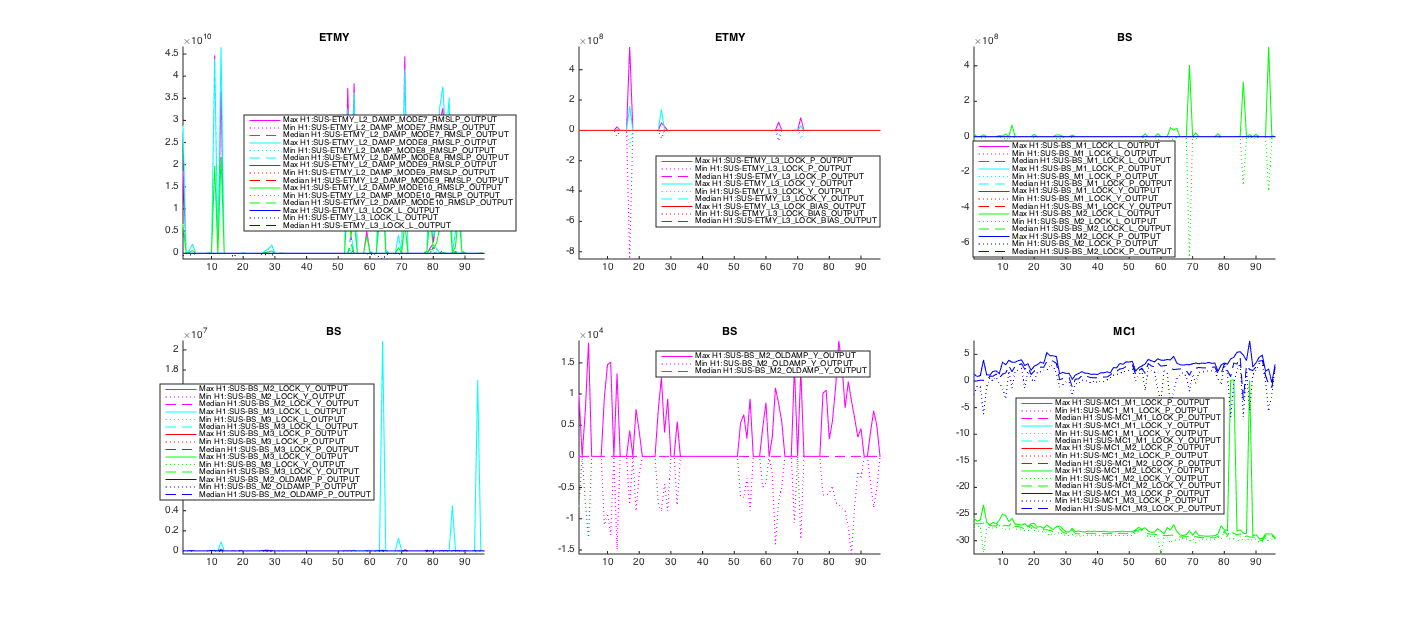
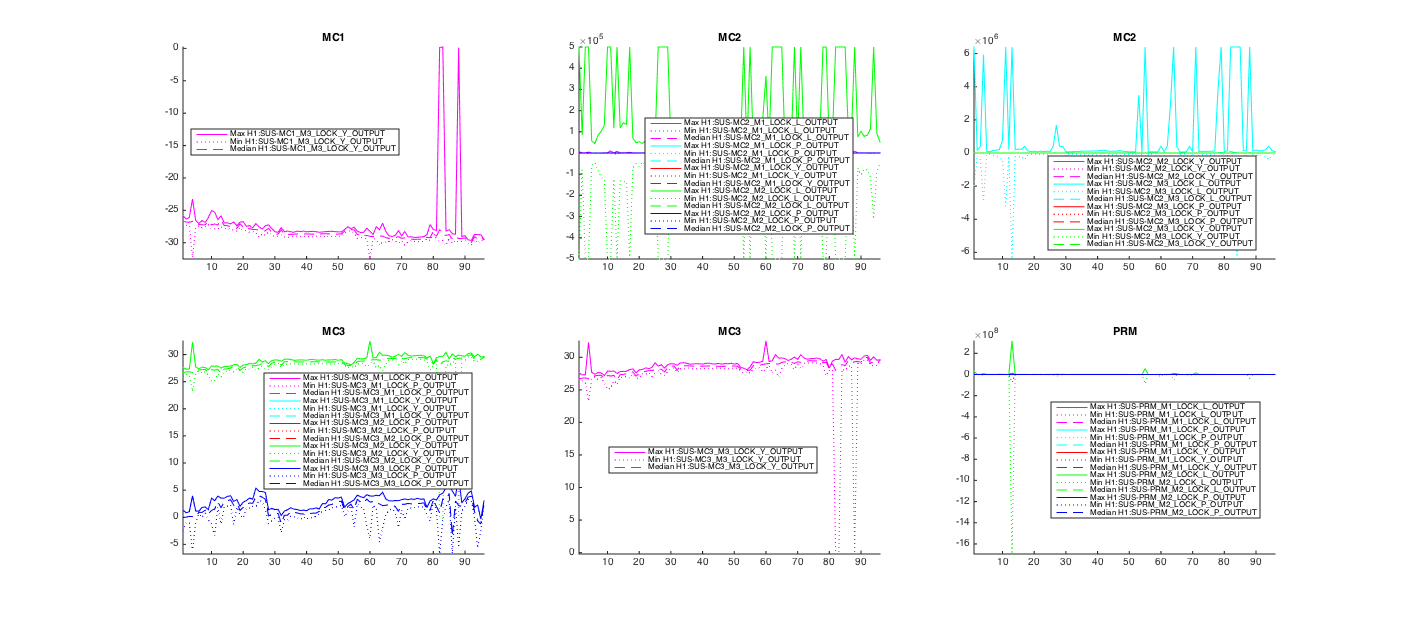
1) Range values around a lockloss: for every lockloss of the analysed lock segments I requested 10 seconds before and after the relock, then the variation range is calculated for each of the analysed channel list (difference between the maximum and minimum values of the 20 seconds of data centered on the lockloss). Script named: matlab_code_range_lockloss.m, Figures named: Fig#_Lockloss_Range_10secs_beforeandafter.fig
It is not rare to see ranges during lockloss between several million to several billion counts!
I have also attached the actual DATA obtained where you can identify the time interval of the Segment number for the plots as well as the plotted ranges and channel names (DATA-Lockloss_Range_10secs_beforeandafter.m).
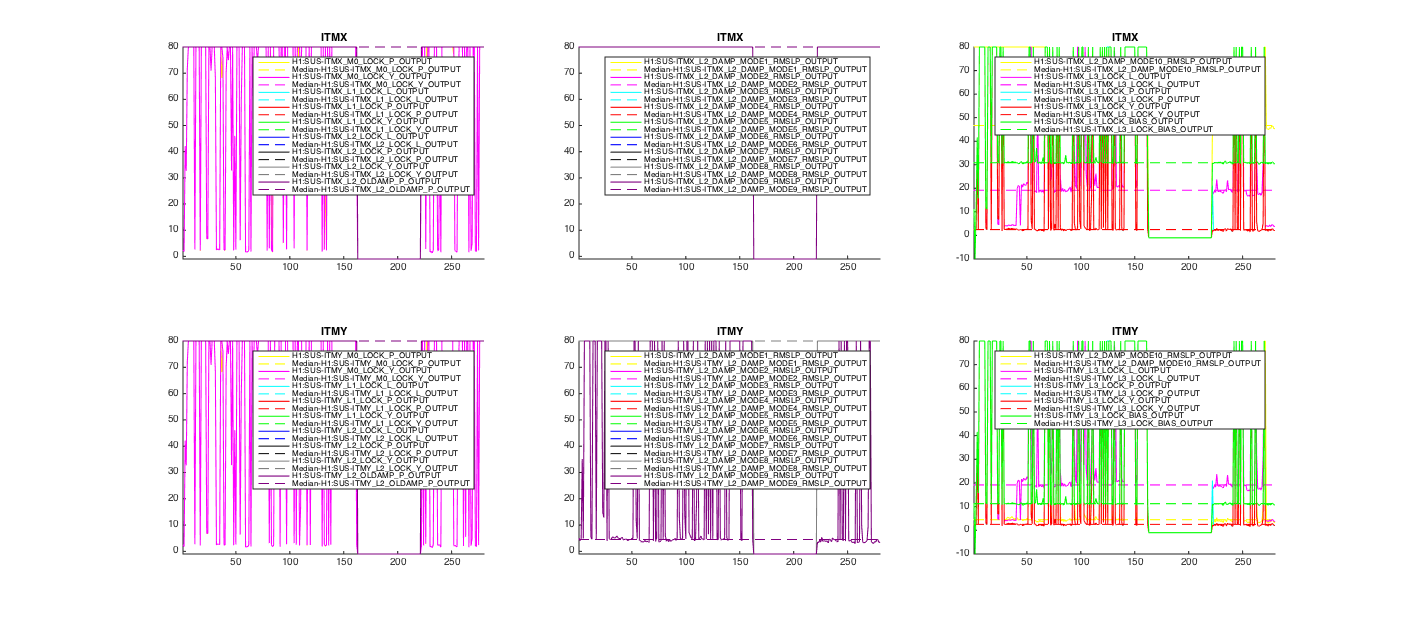
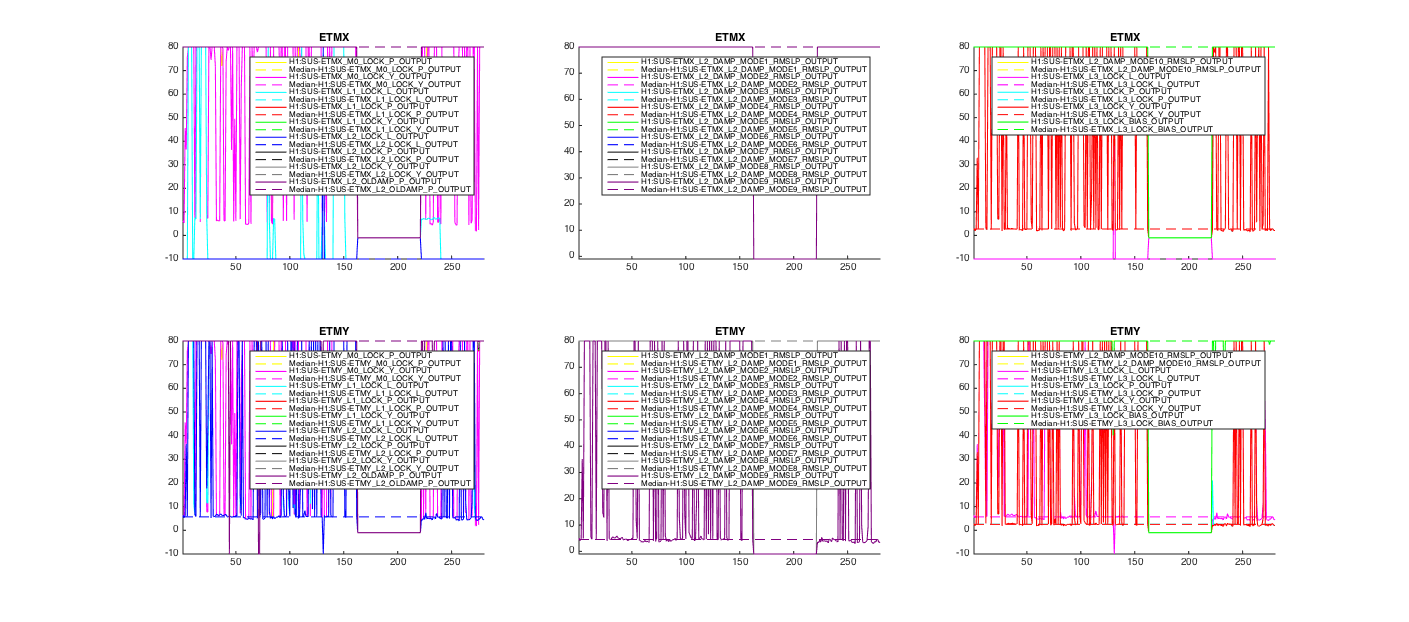
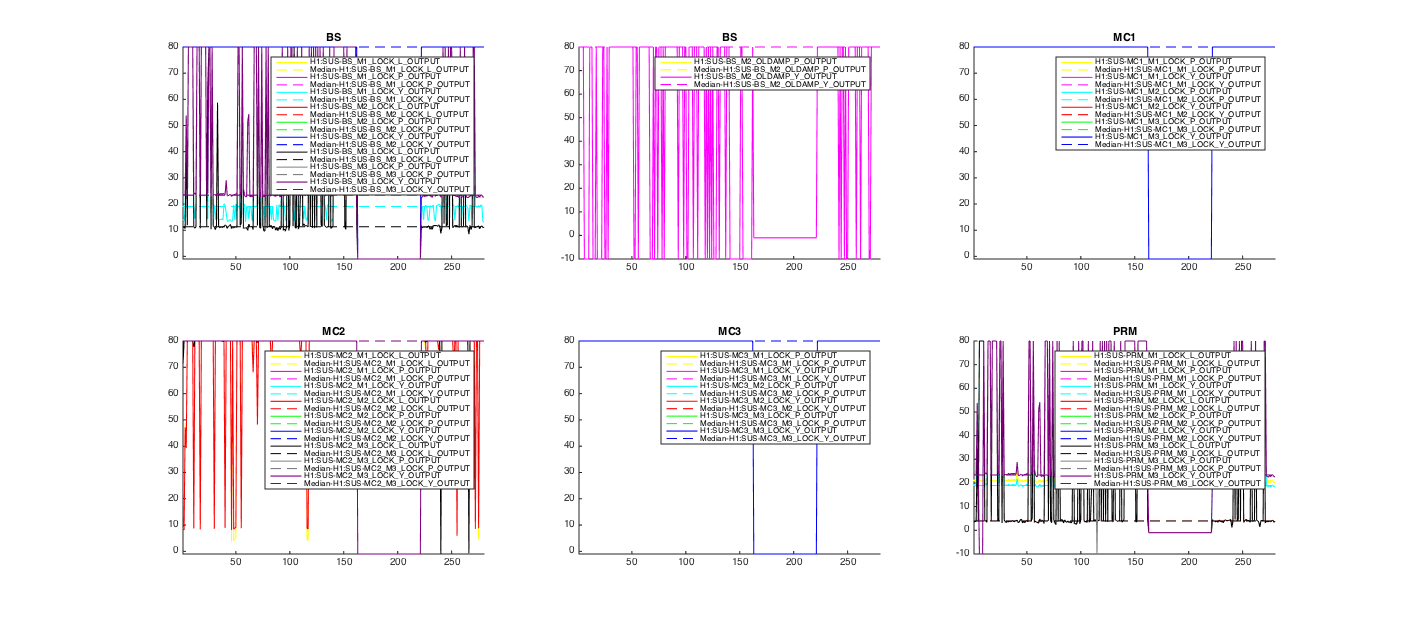
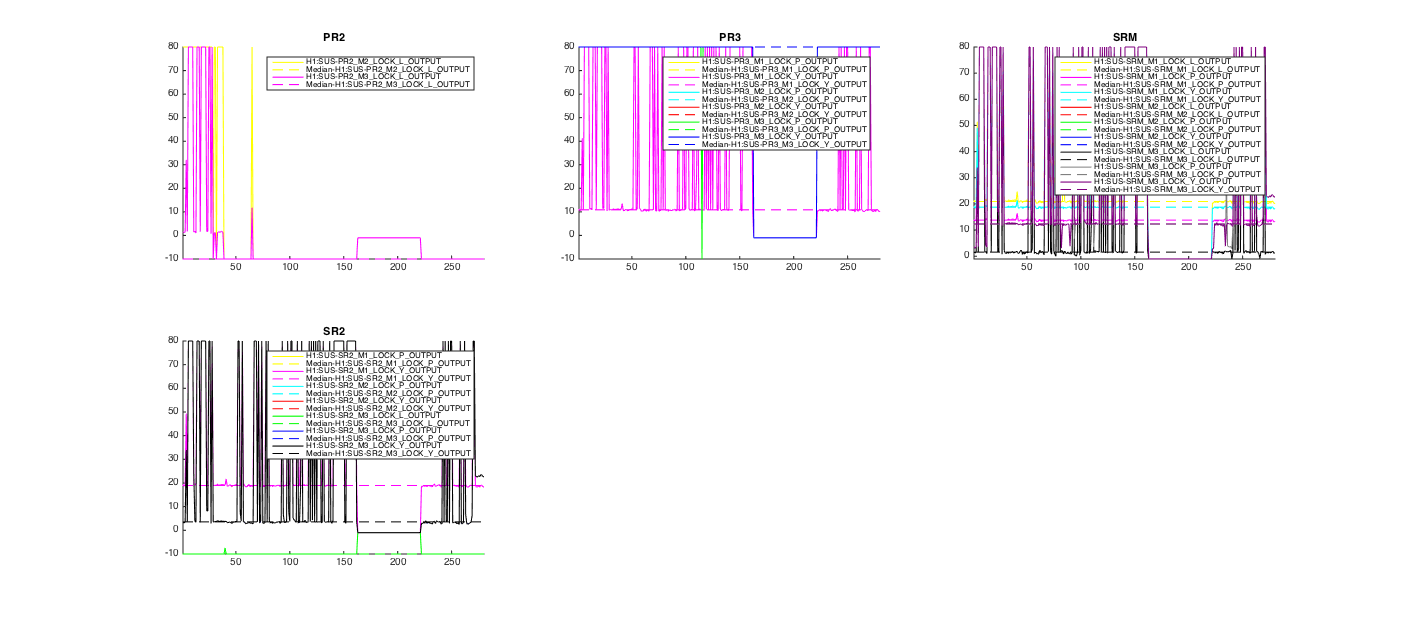
2) Number of seconds to turn off the channels after lockloss: Again for every lockloss on the analysed segments and channels I query up to 80 seconds after lockloss and see how many seconds it takes for the channel to be turned off. In many cases the answer is 80 seconds which means that it does not turn off during the queried time. Values of zero or negative seconds can be ignore. Figures named: Fig#_TimeToZero_after_lockloss_80secsMax.fig
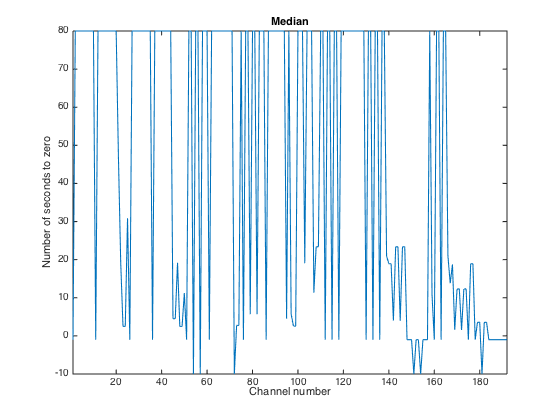
Each channel plot is accompanied with a dashed line of the same colour which represents the median (not the mean) of the respective channel plot for all the segments. Therefore showing what is the most common time to zero per channel. I have also attached a summary of the median information on a single plot where the horizontal axis is in this case the channel number as per the variable SUS_channel included on the DATA-TimeToZero_after_lockloss_80secsMax.mat file (again ignore negative values). It is clear from this plot that most channels are not turned off within 80 secs after lockloss.
I have attached the Matlab script used to generate these results (matlab_code_TimeToZero_after_lockloss.m).
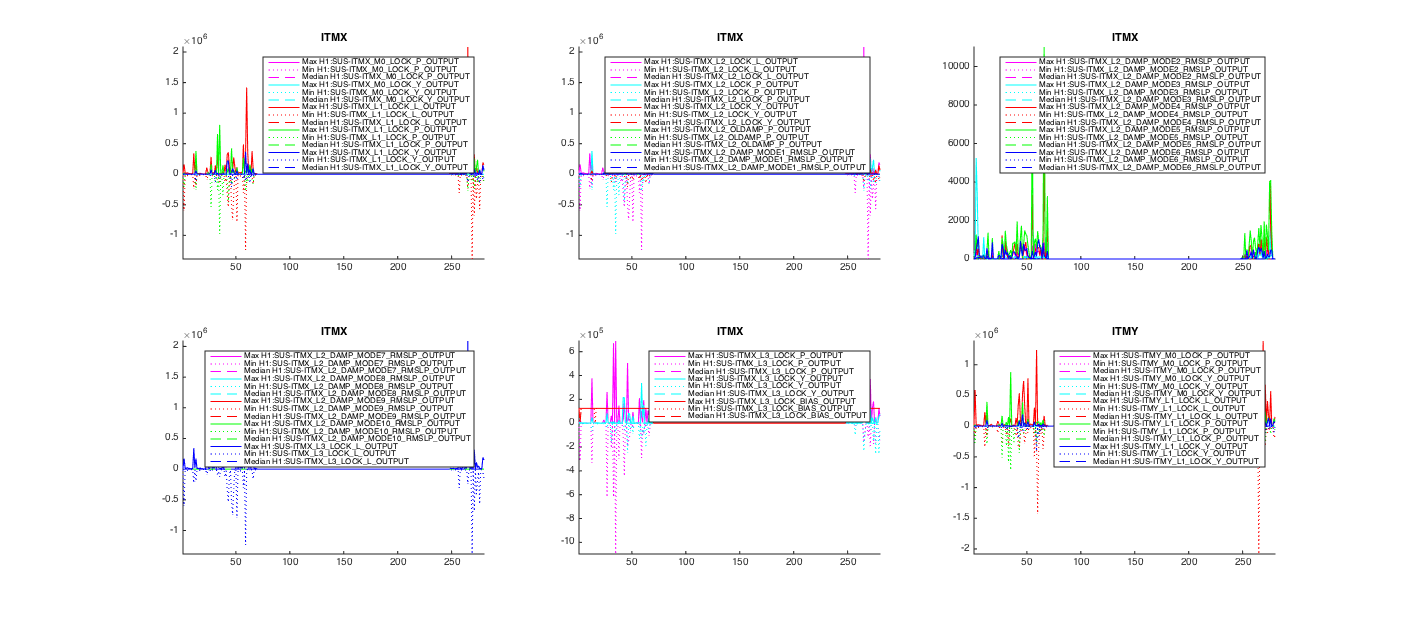
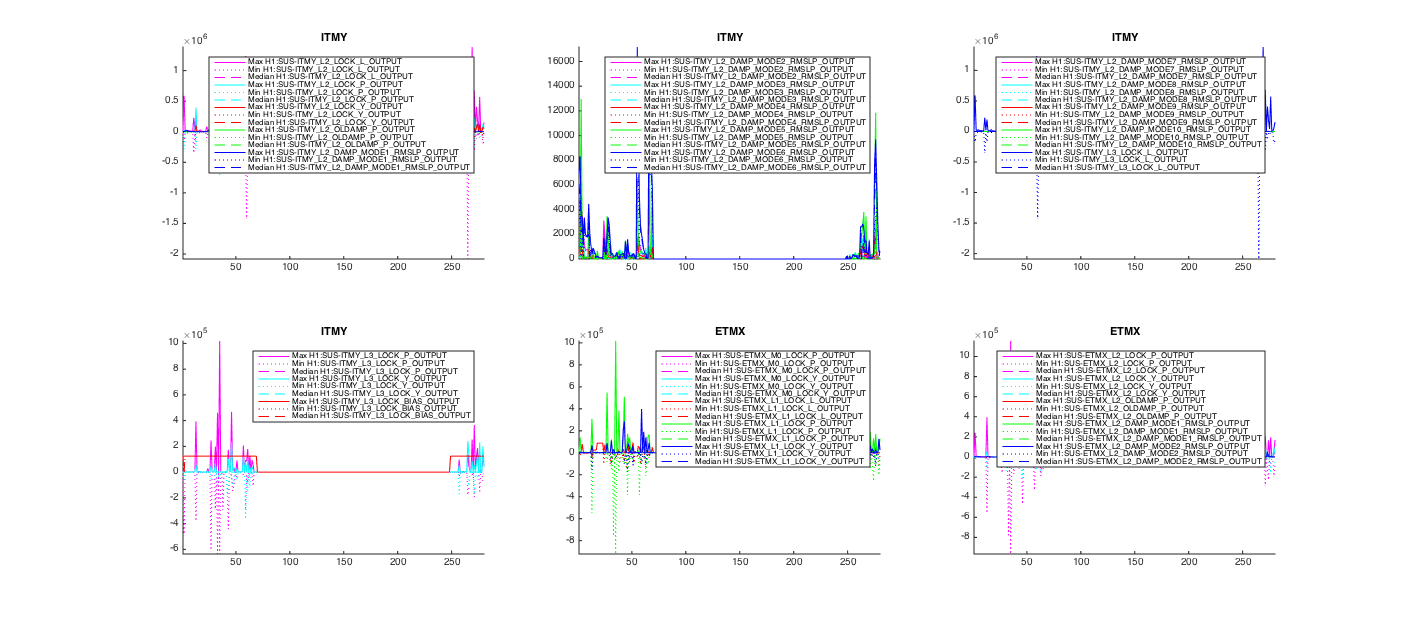
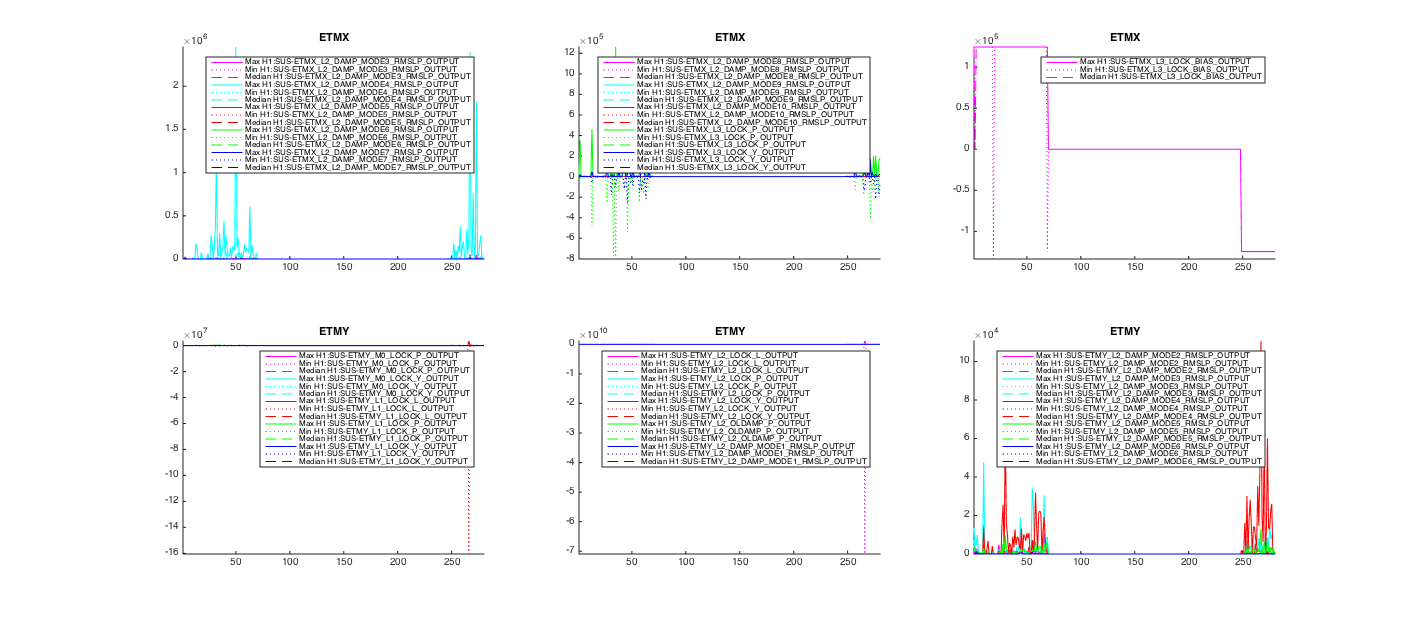
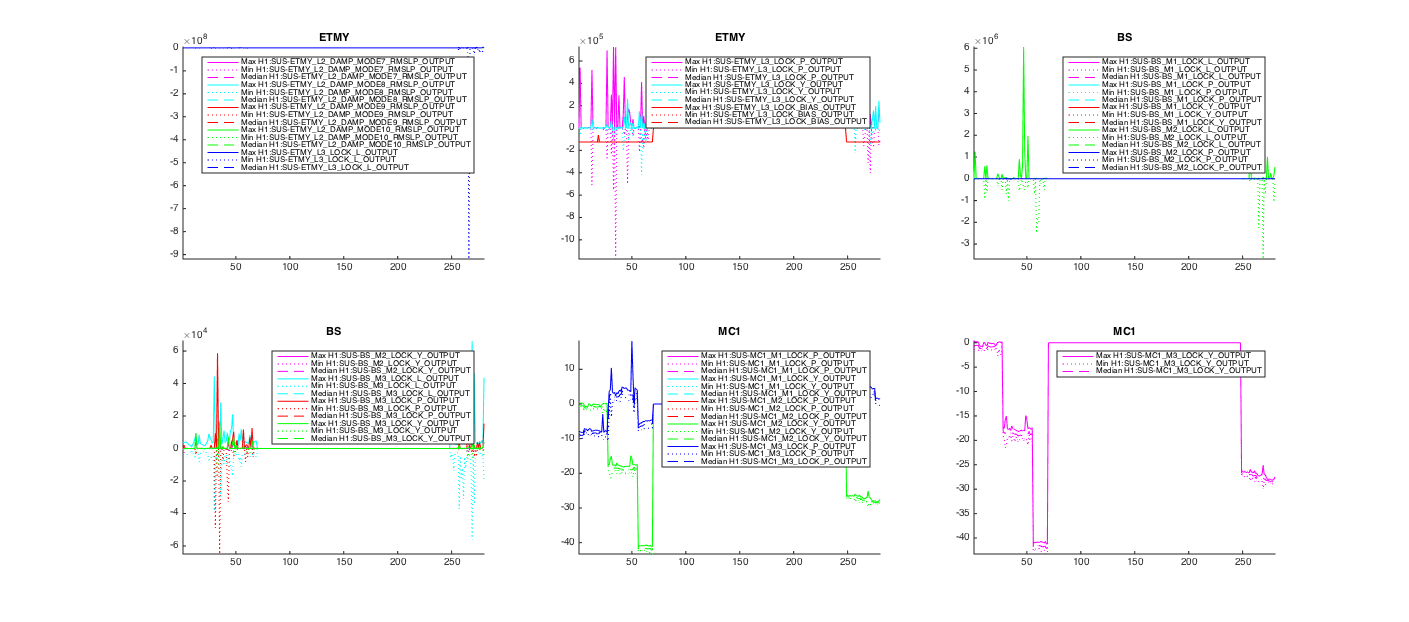
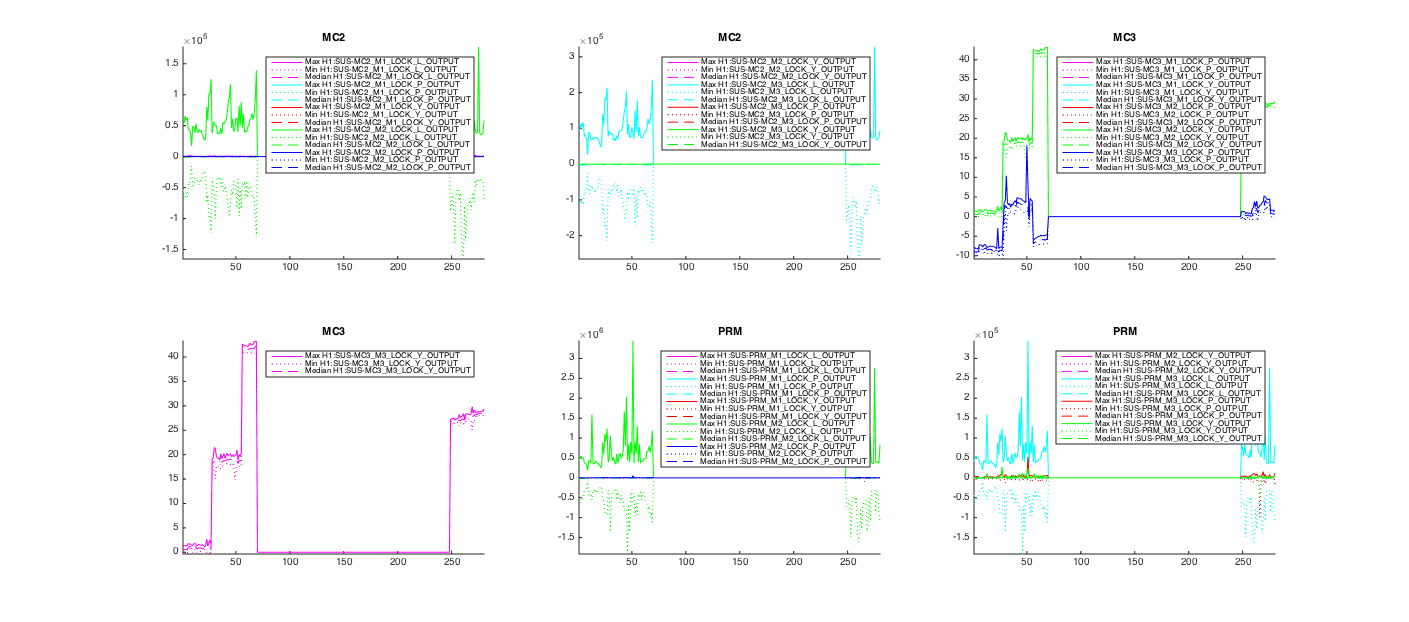
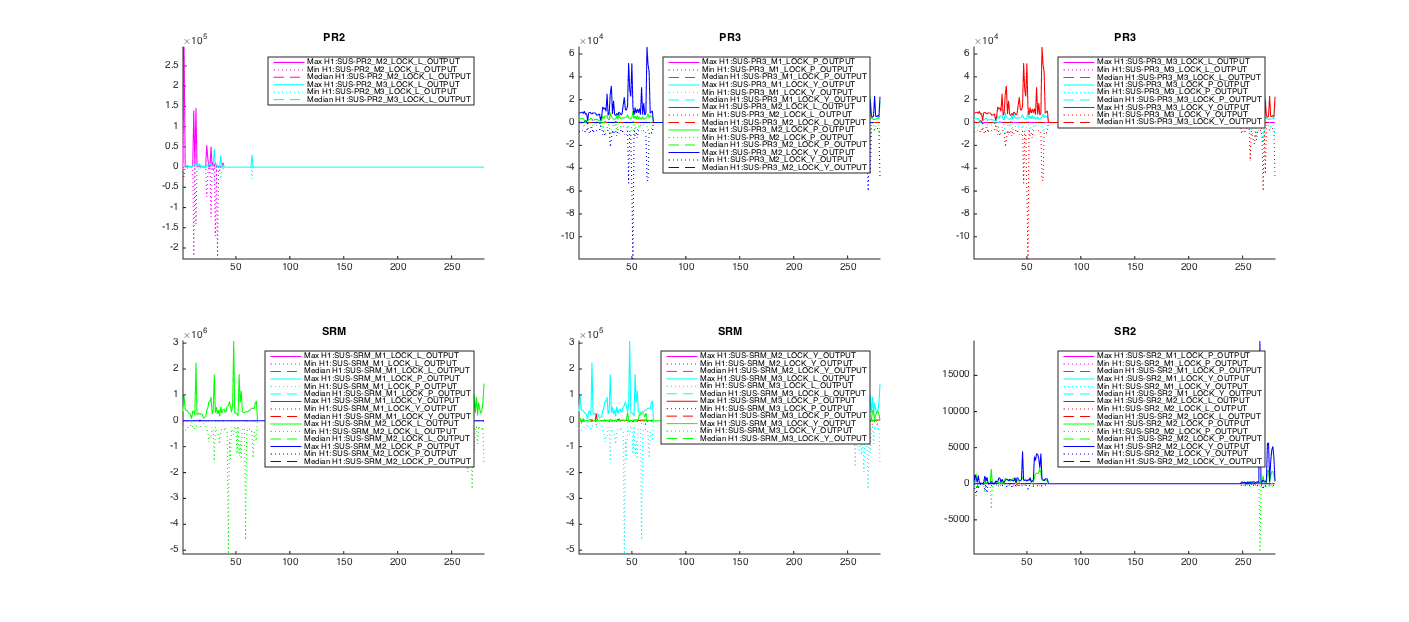
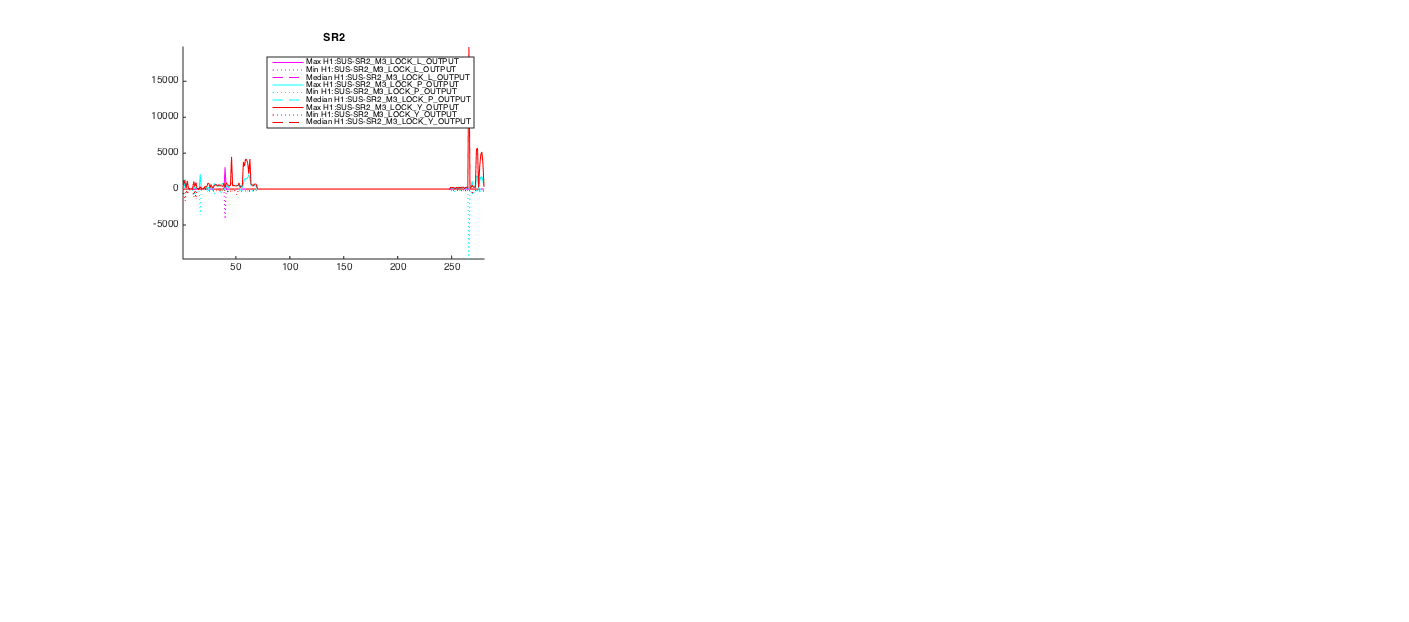
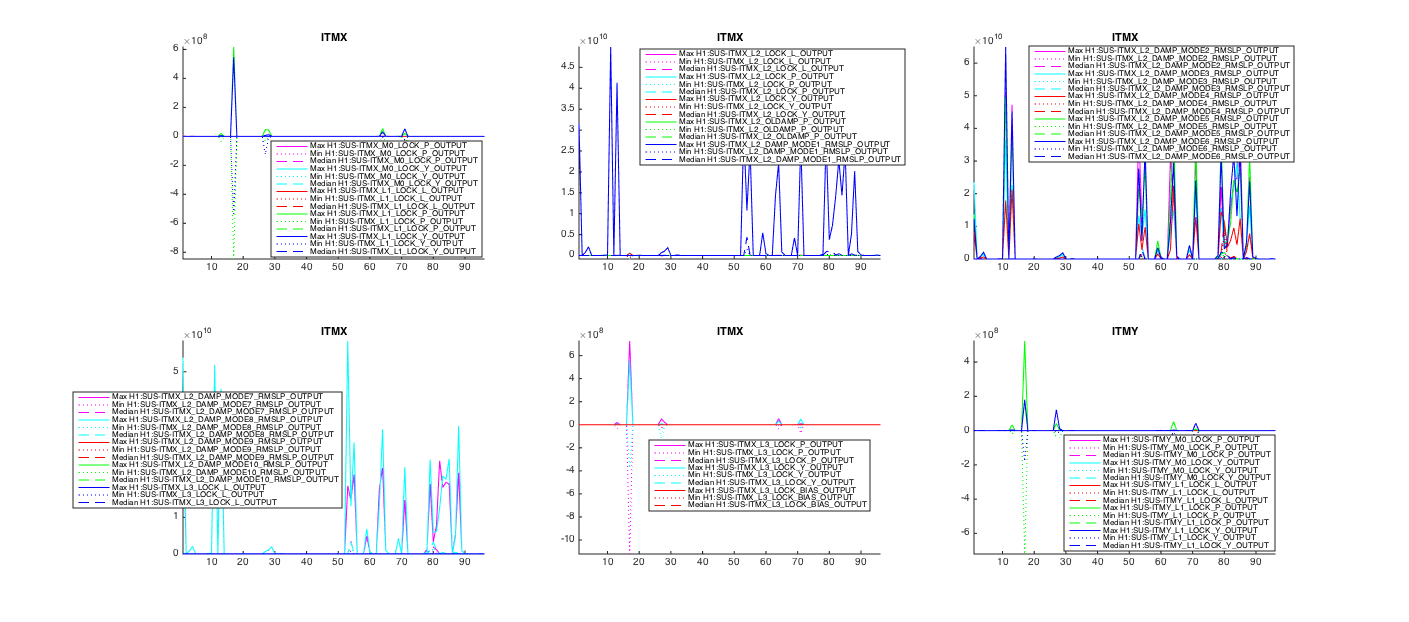
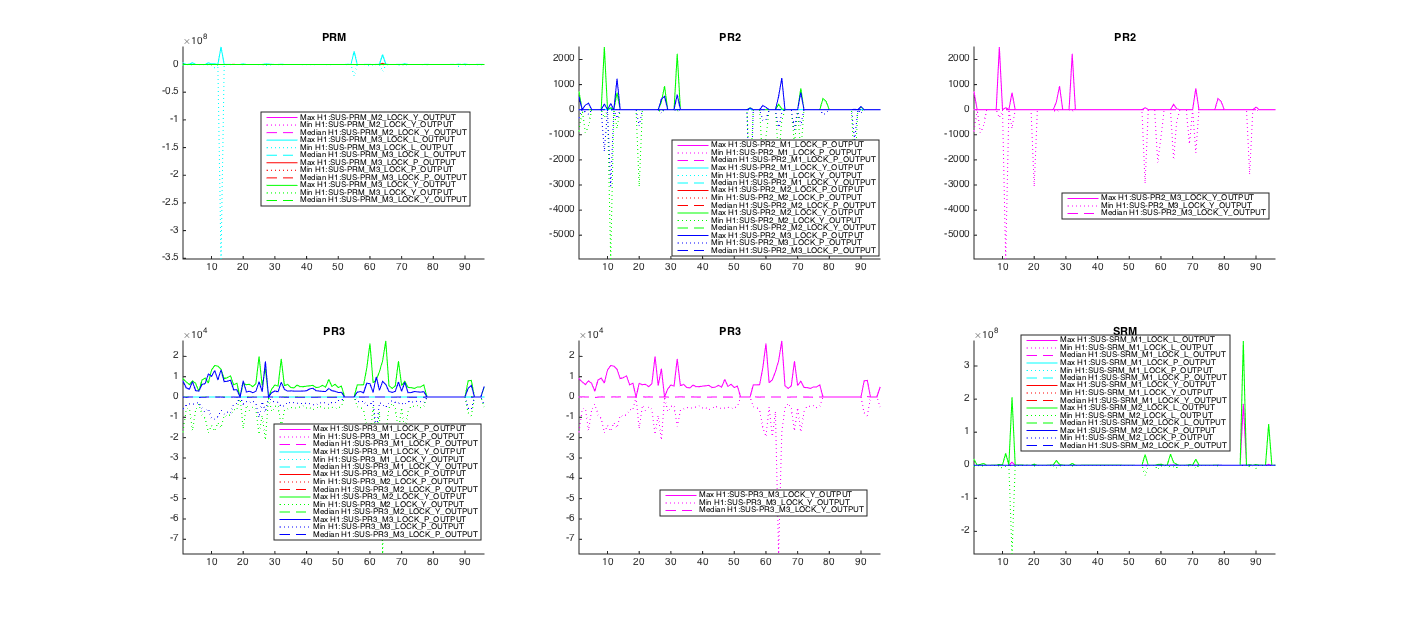
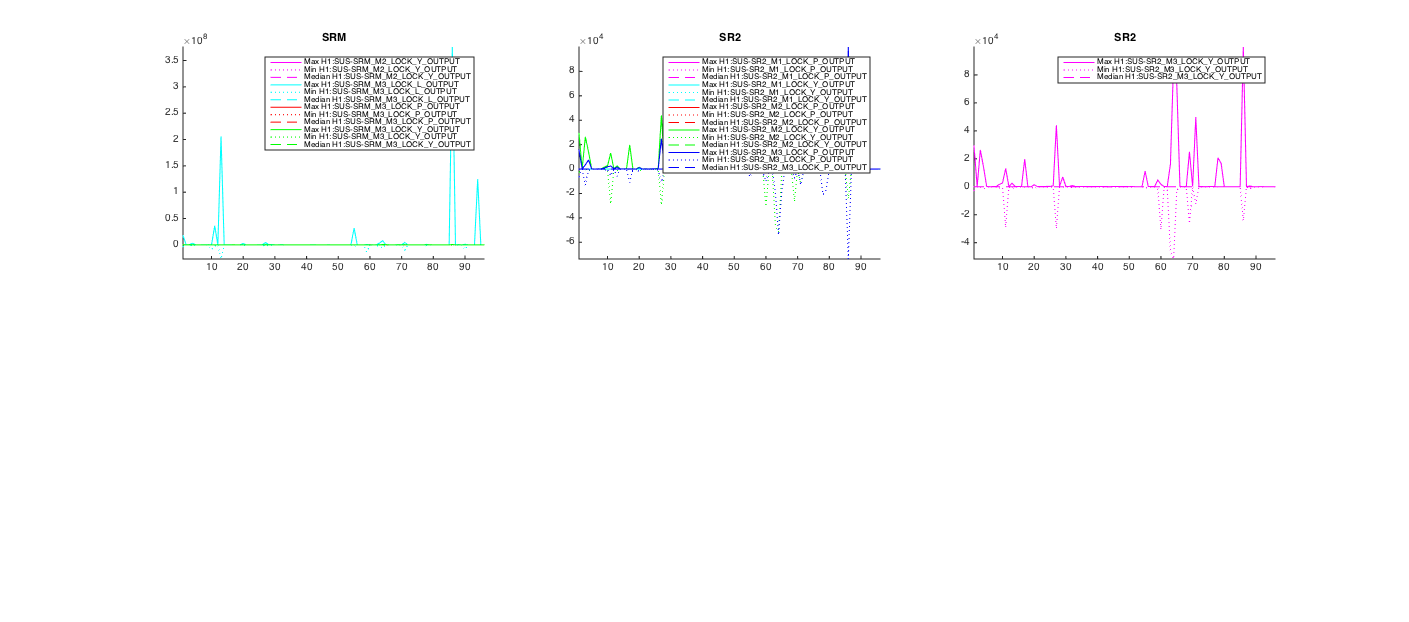
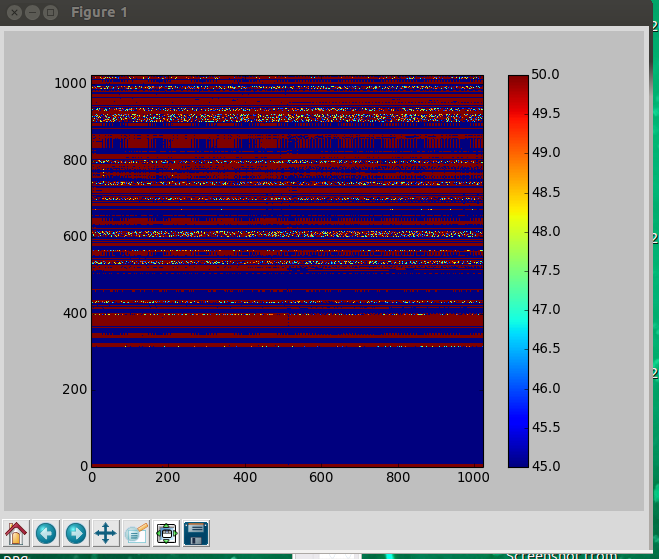
3) Values of the control channels during lock segments: In this case for each subplot there is a maximum of 5 channels related to the same suspension. For each channel I show the Maximum, Minimum and Median values that the respective channel has for each lock segment. I also attach the matlab cript used to generate this results (matlab_code_lock_segment.m) and a matlab file (DATA-During_lock_data_from_20161022_till_20161210.mat) with the relevant variables containing matrices; Maximum, Minimum and Median of the data. These matrices have dimensions: 'Number of Segments' x 'Number of Channels', these dimension correspond to the also included variables 'Segments' and 'SUS_channels'. Figures named: Fig#_Values_during_lock.fig
Notice that at the time of this analysis a bigger number of segments (about 180 of the 280 segments analysed) did not return data, this happened using both servers: nds.ligo.caltech.edu and nds.ligo-wa.caltech.edu. I do attach the results here but notice that the long zero stretch at the middle is due to this lack of information. To increase the number of segments with data, I also queried a more recent interval between Dec 01 2016 03:29:55 UTC till Dec 20 2016 23:32:39 UTC. This corresponds to a further 99 segments (filename: Segments_Lownoise_LOCK_NOMINAL_from_20161130_till_20161221_H1.txt). For this case the figures are named: Fig#_Values_during_lock_2ndInterval.fig, and the DATA file name is: DATA-During_lock_data_from_20161130_till_20161221.mat