Summary:
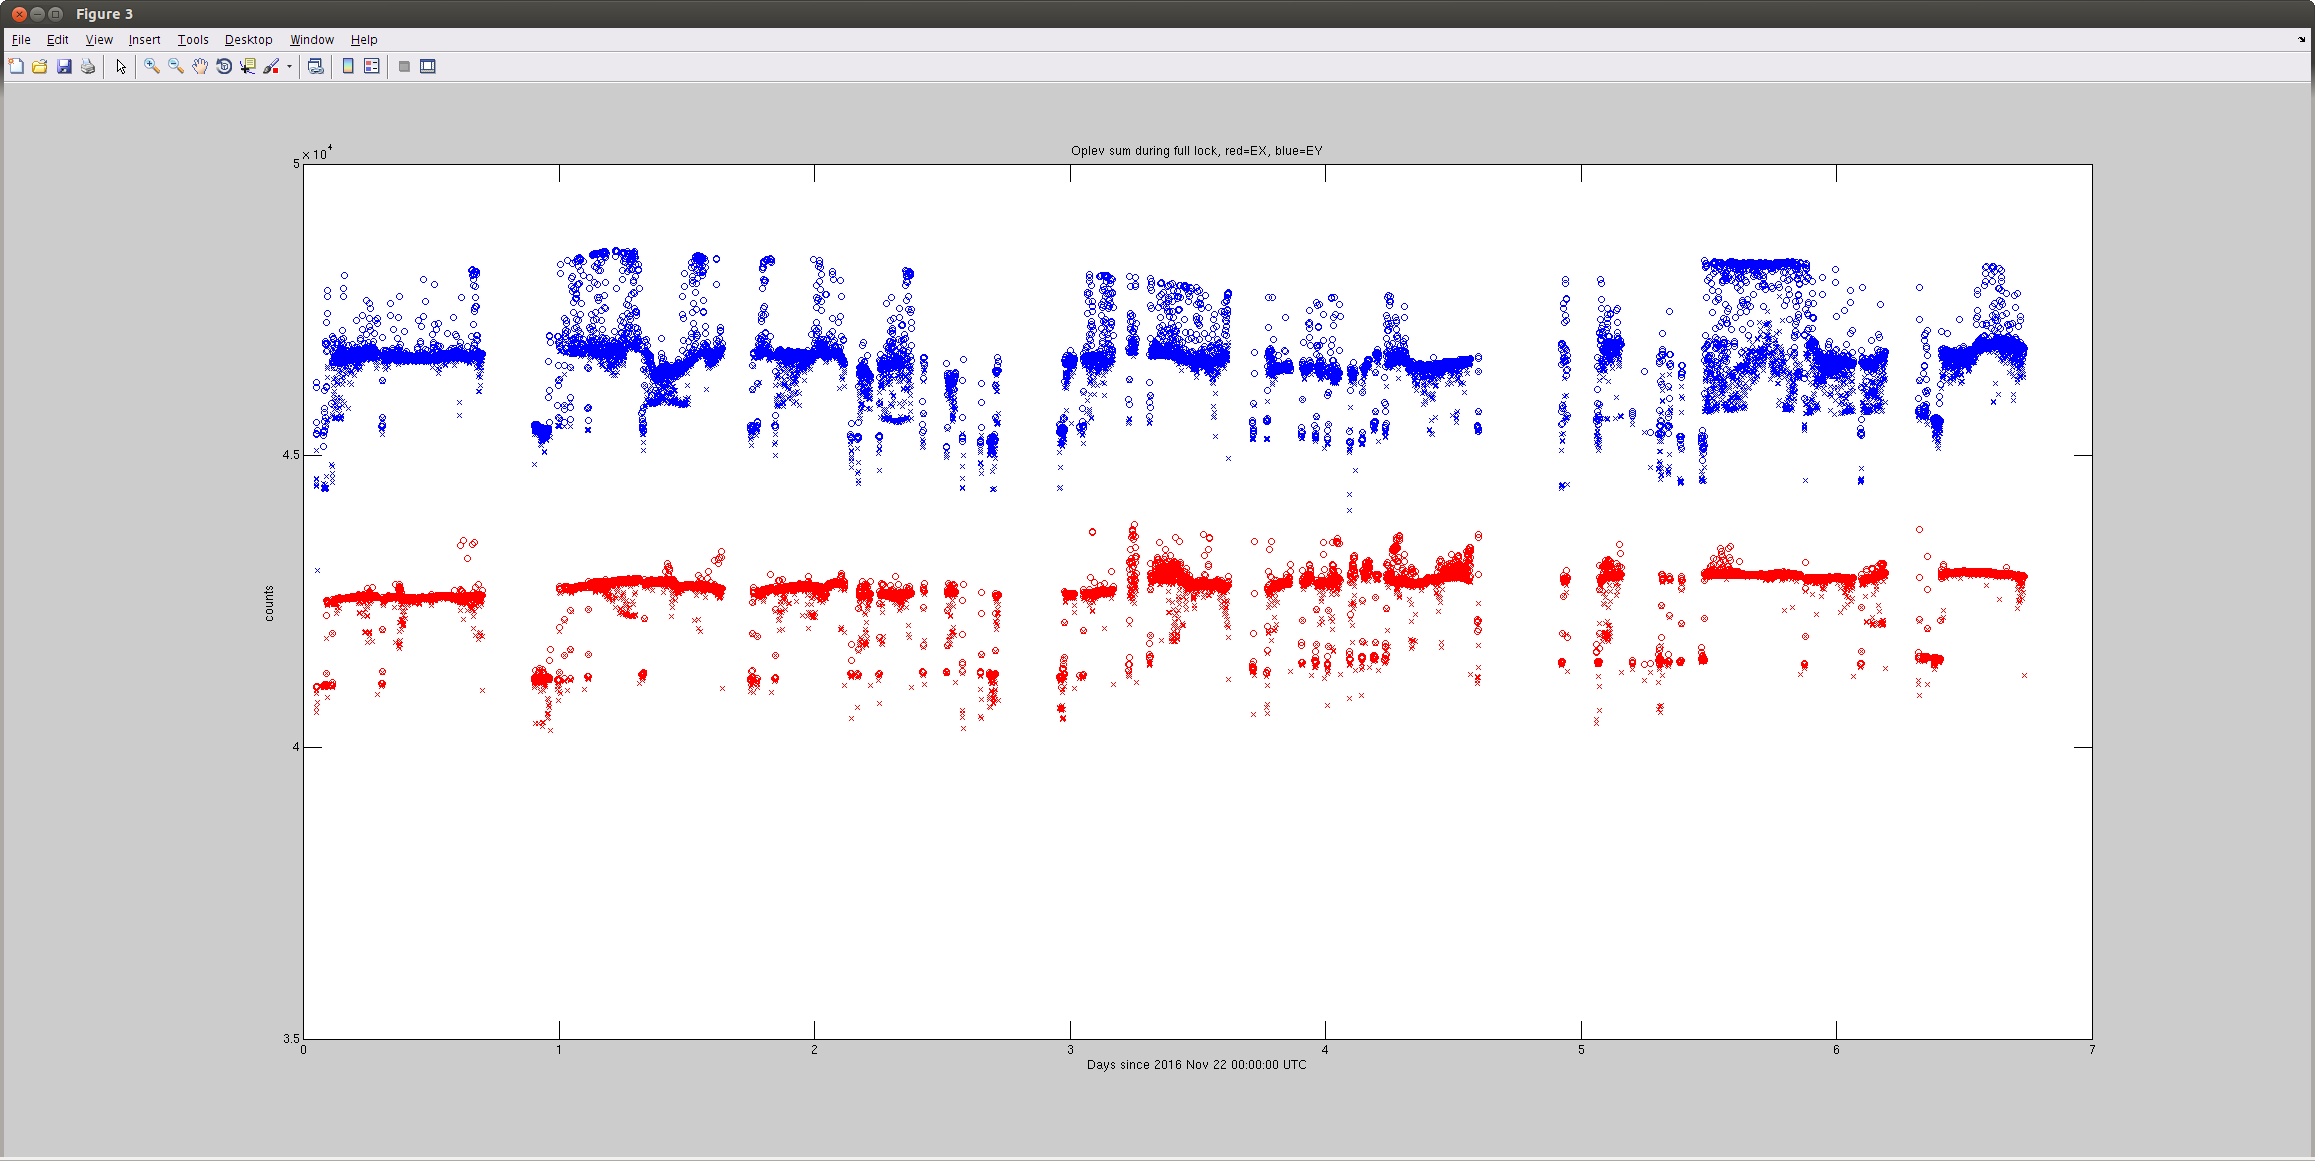
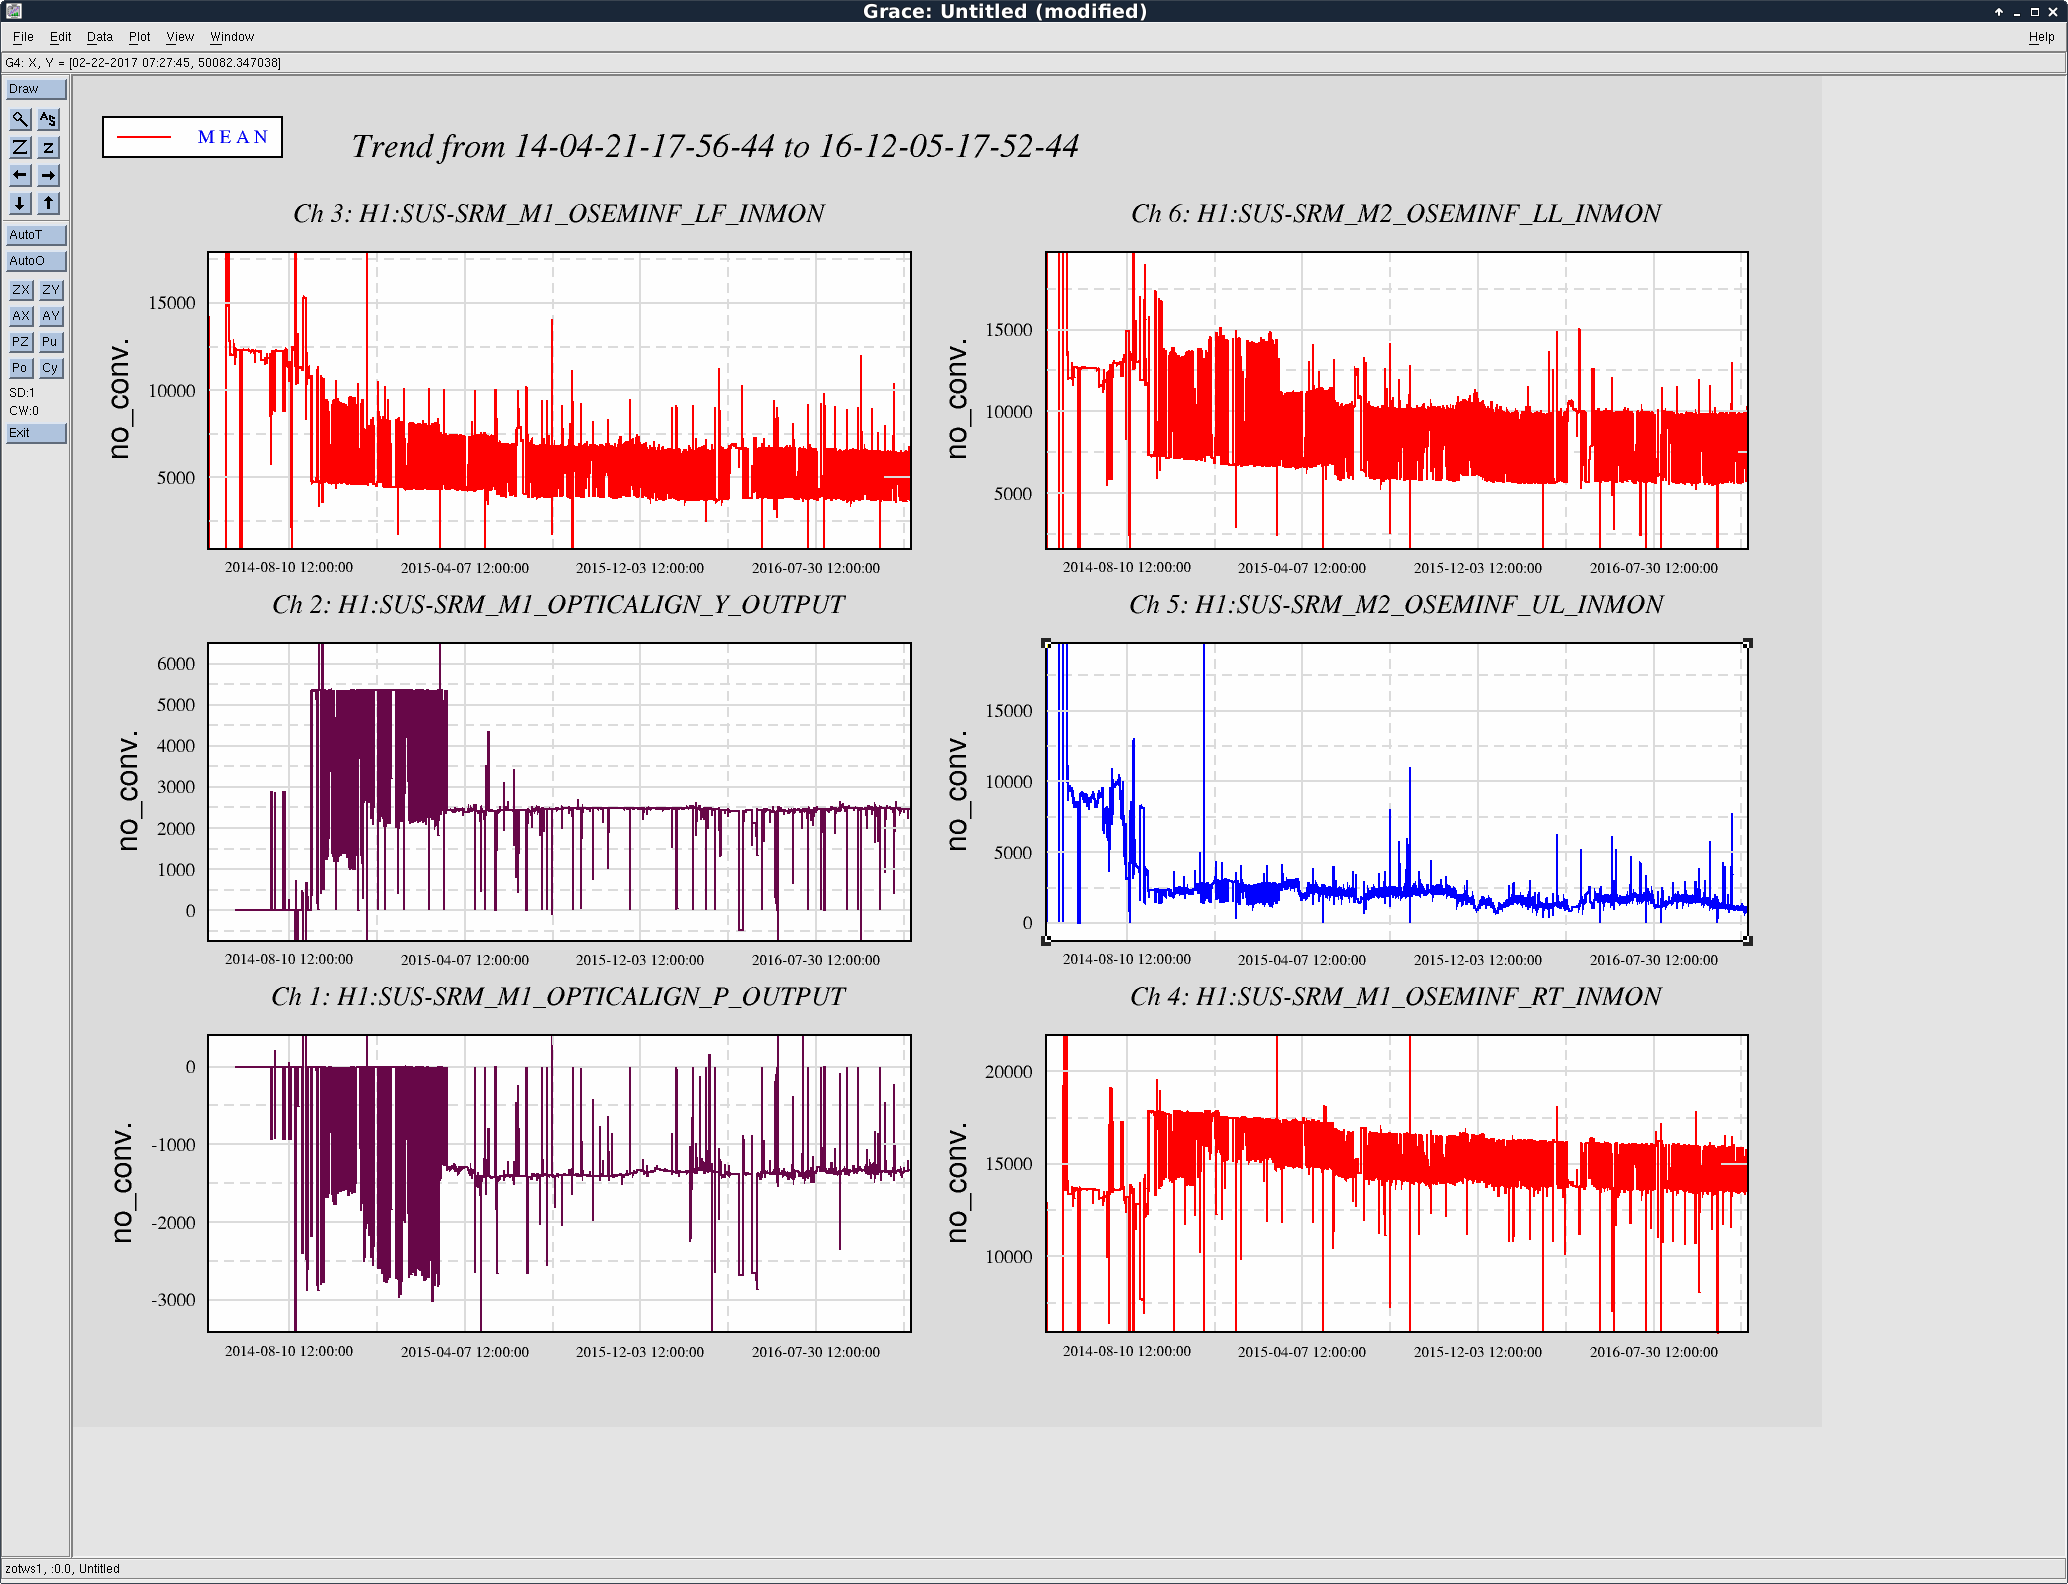
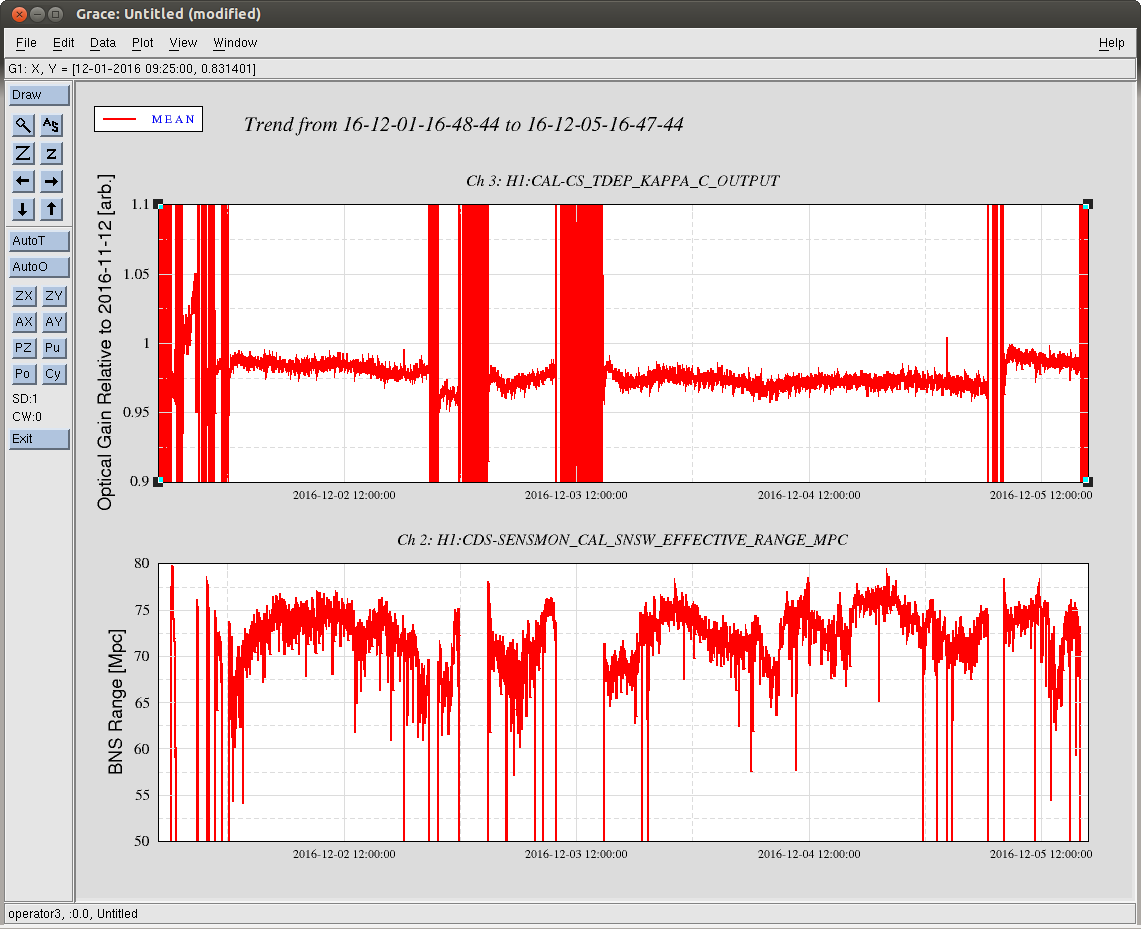
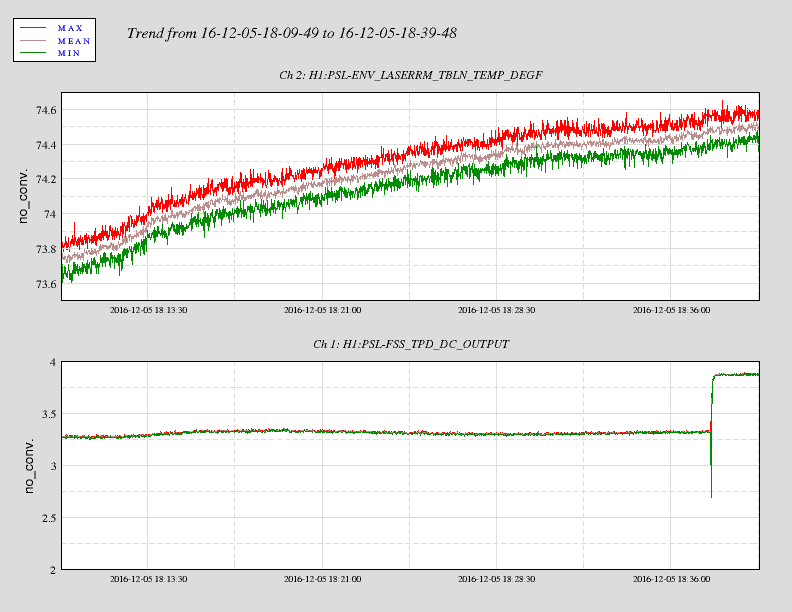
OPLEV EX laser glithes were reported to be causing DARM glitches by detchar (e.g. alog 31810) even though EY is no worse or maybe somewhat glitchier (1st attachment, this is a week's worth of trend before Jason made an adjustment). It seems like this is due to a hidden design feature that there's a fixed 0.1uf cap across transimpedance resistor, which gives different pole for different resistor.
As a quick fix I'll insert digital zp(160,16) for all EX segments, as it seems to me that we cannot change the transimpedance without accessing the receiver module on oplev pyron.
Details:
T1600085 tells us that the effective transimpedance and the whitening gain of ETMX and ETMY are [2*10k,18dB] and [2*100k,0dB] (a factor of 2 comes from the differential drive, physical transimpedance is either 10k or 100k). They both use two stages of whitening filters too.
D1100290 shows that there's a 0.1u cap across the transimpedance resistor. The pole formed by 0.1uF cap and [10k, 100k] resistor is [160Hz, 16Hz].
Analog signal of each segment including whitening gain is
ETMX ~ 8*2*10k*zp([],160Hz)*photocurrent (a factor of 8 due to 18db whitening gain)
ETMY ~ 2*100k*zp([],16Hz)*photocurrent.
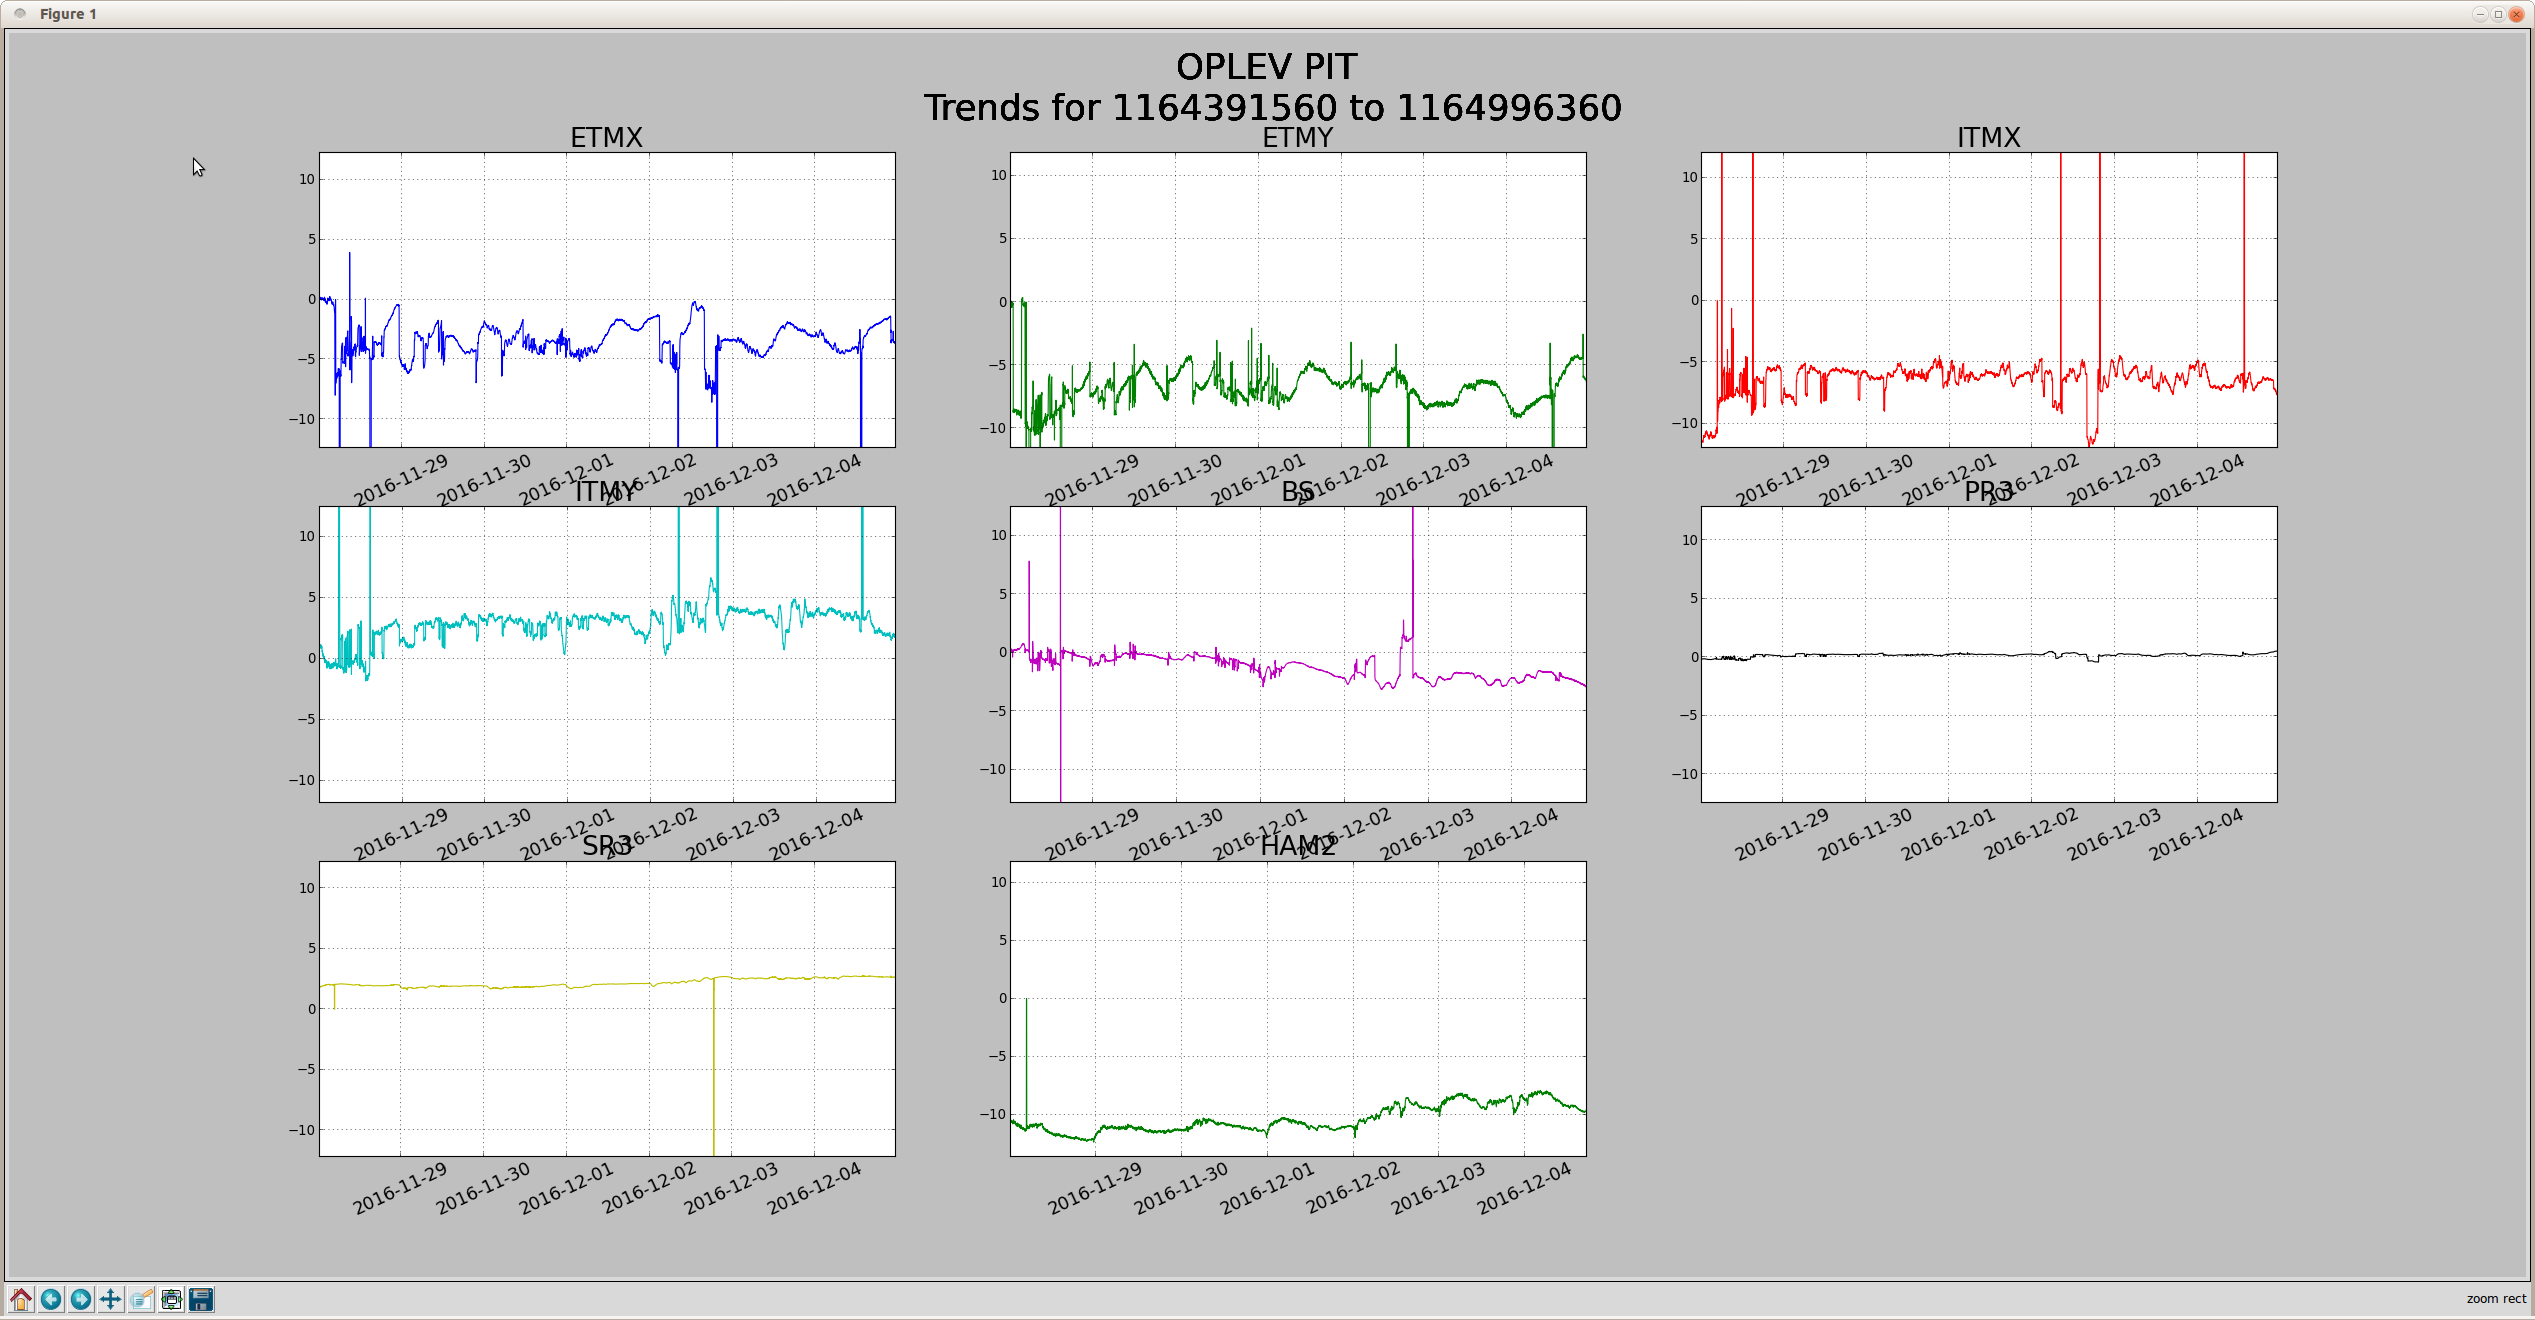
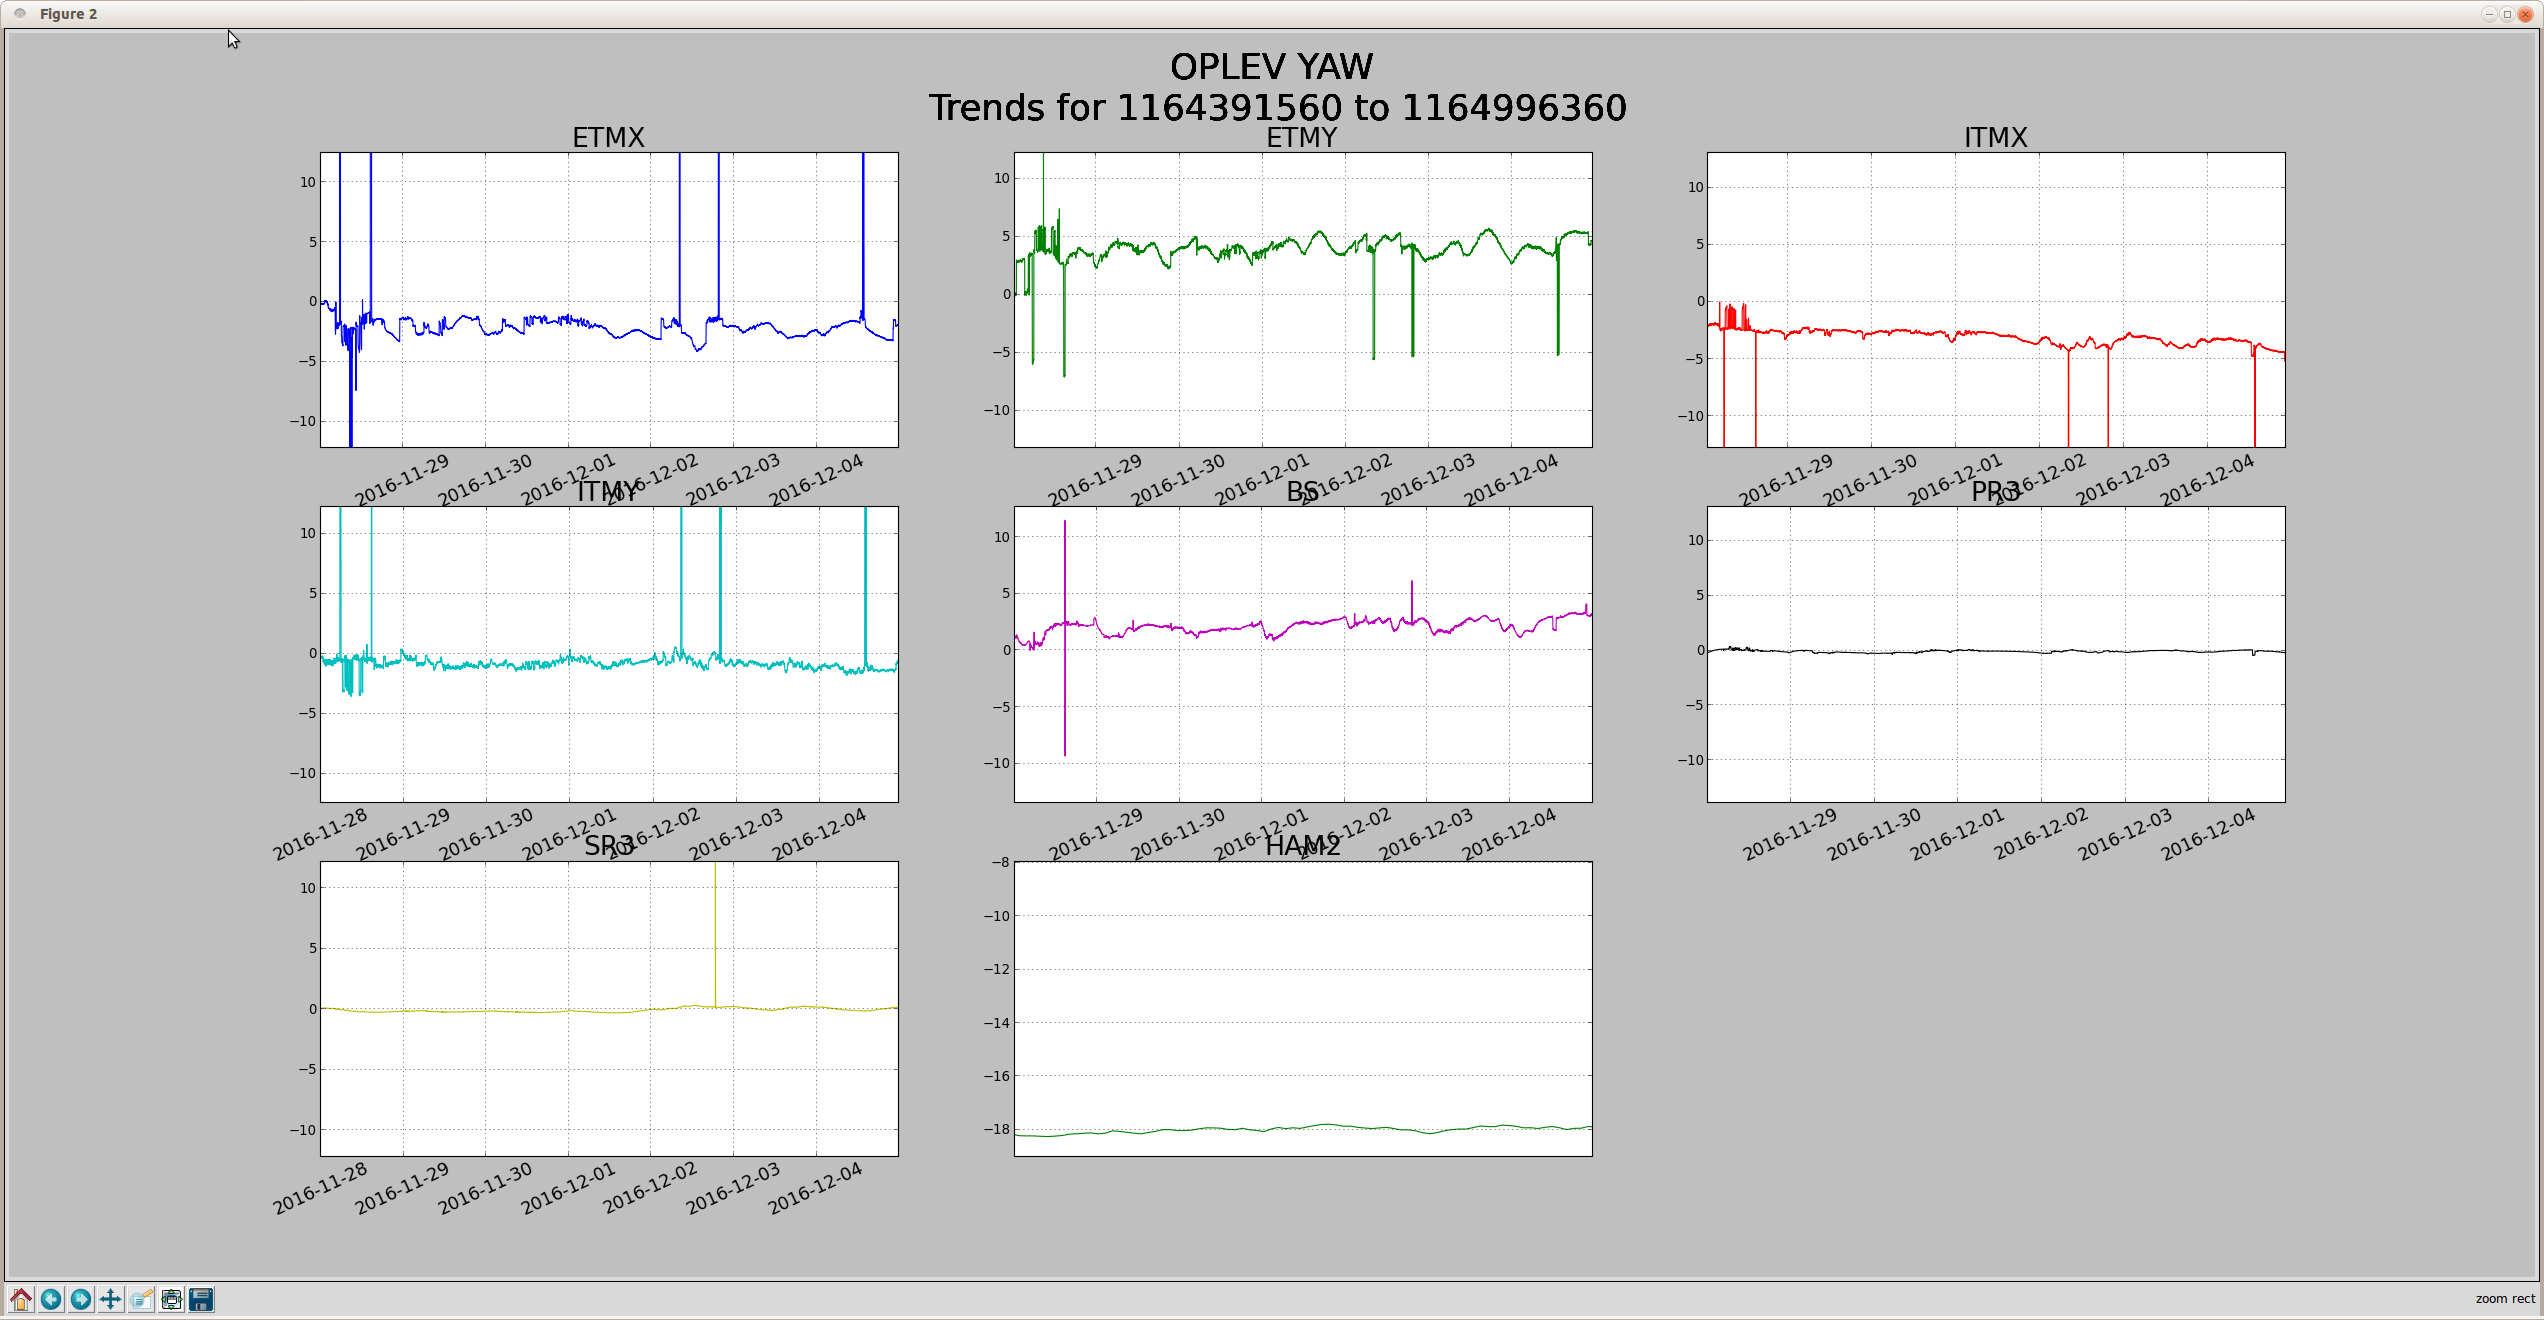
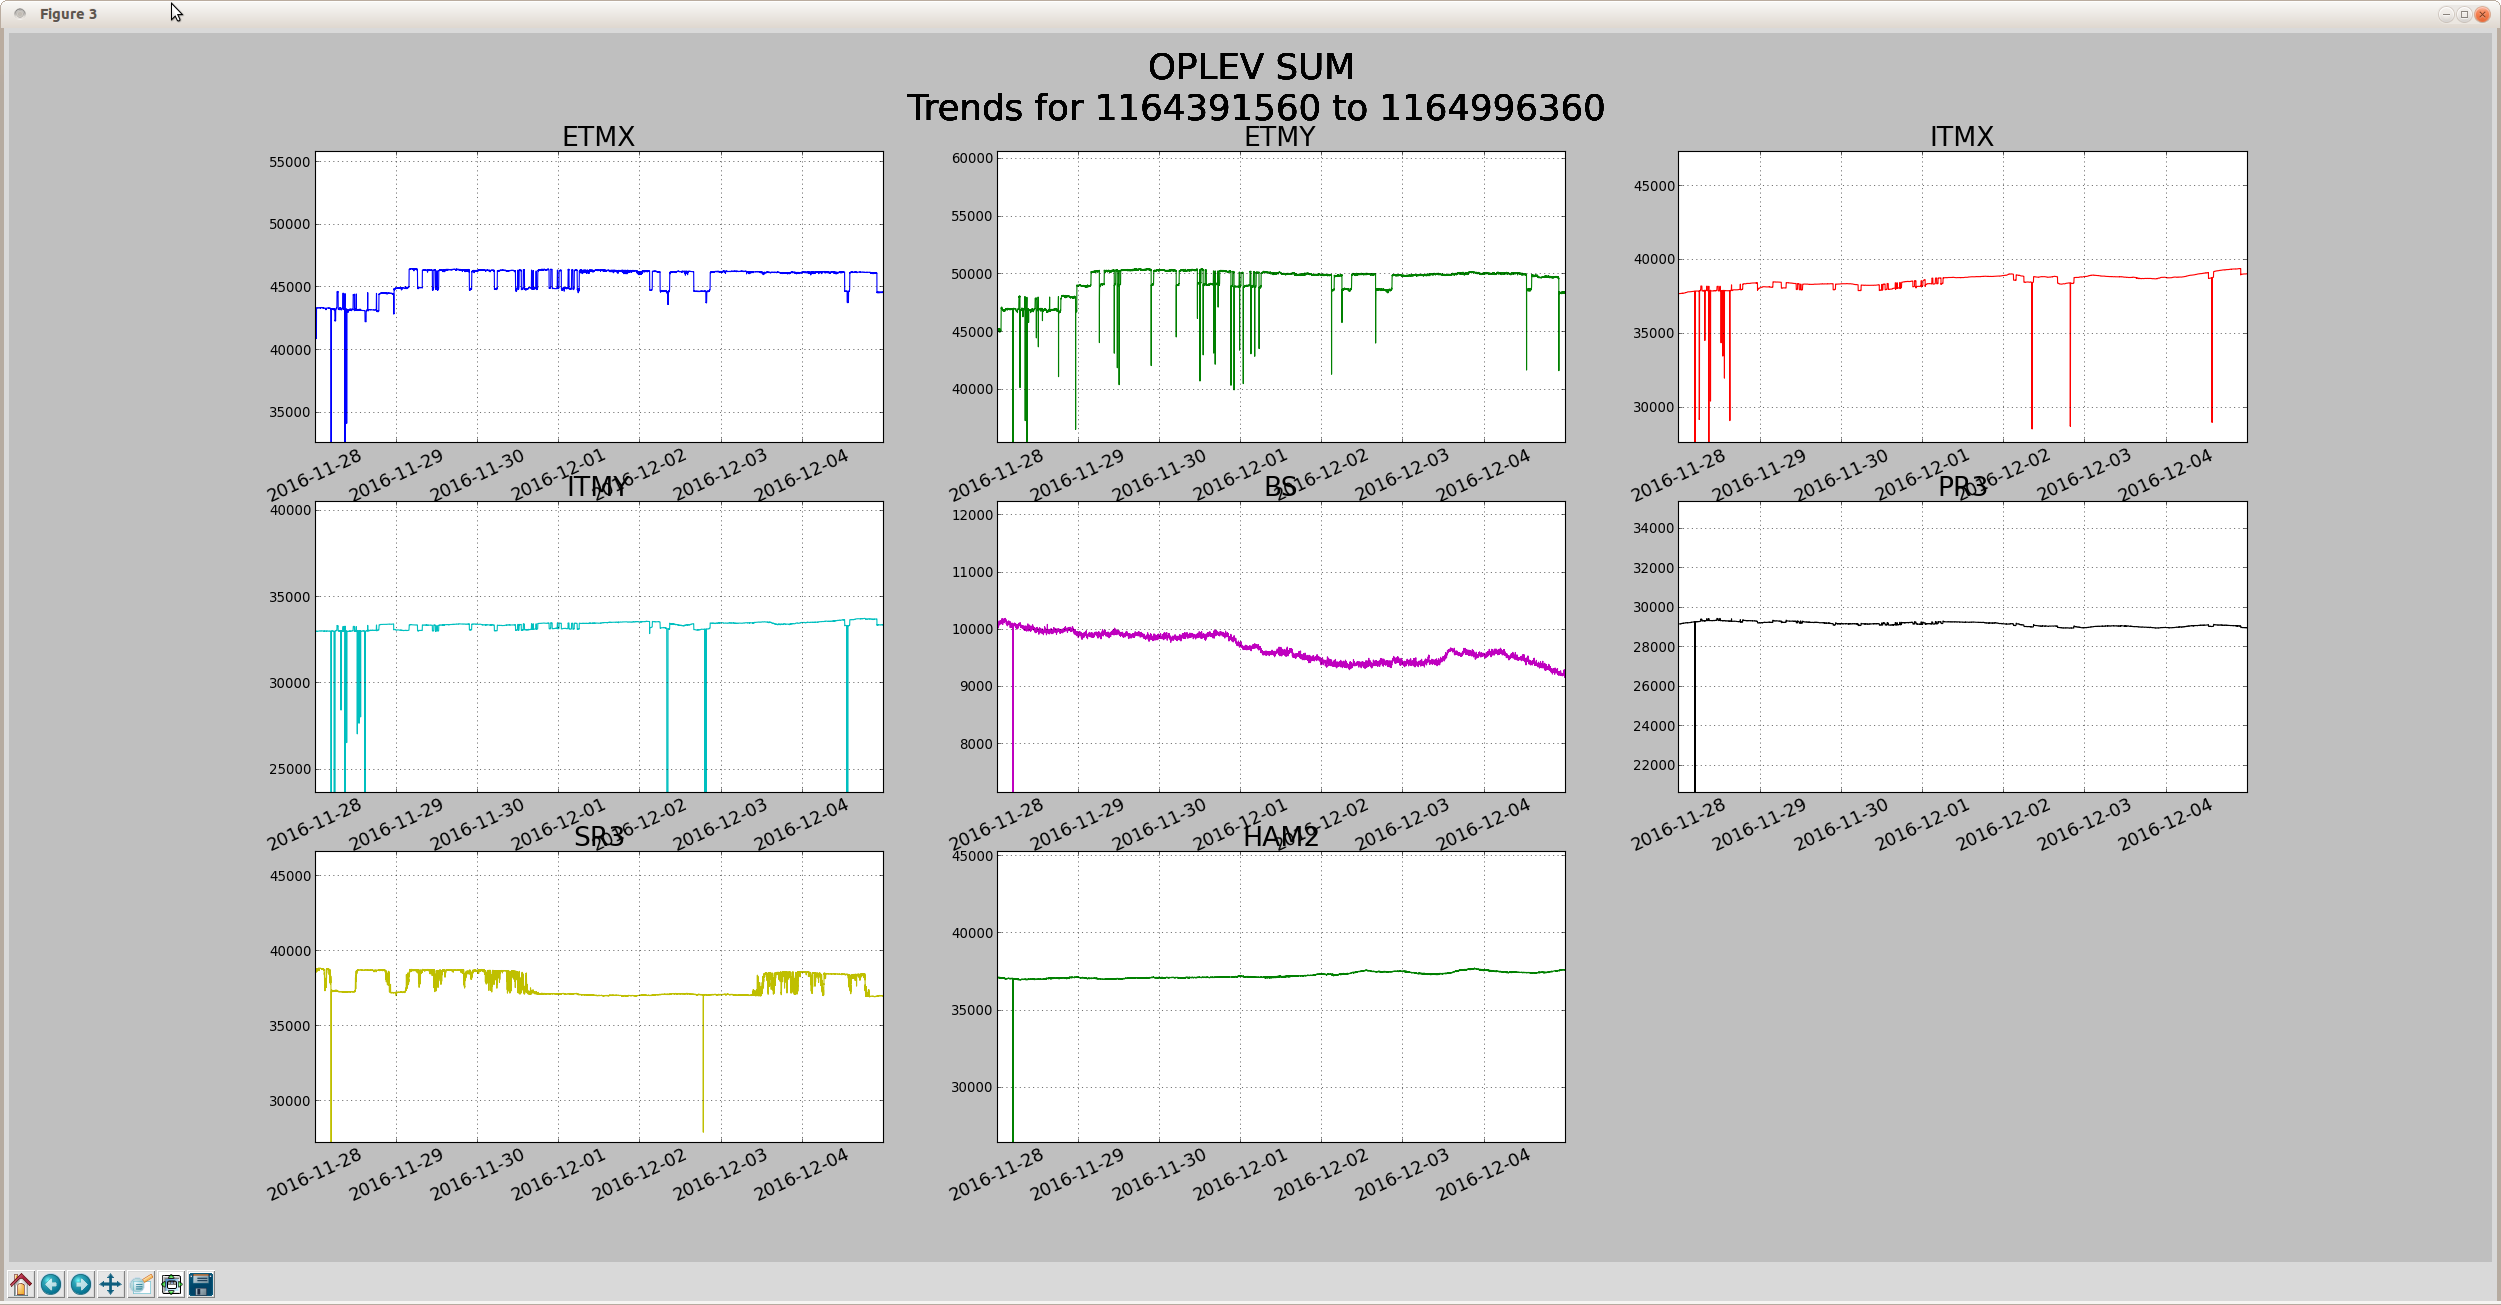
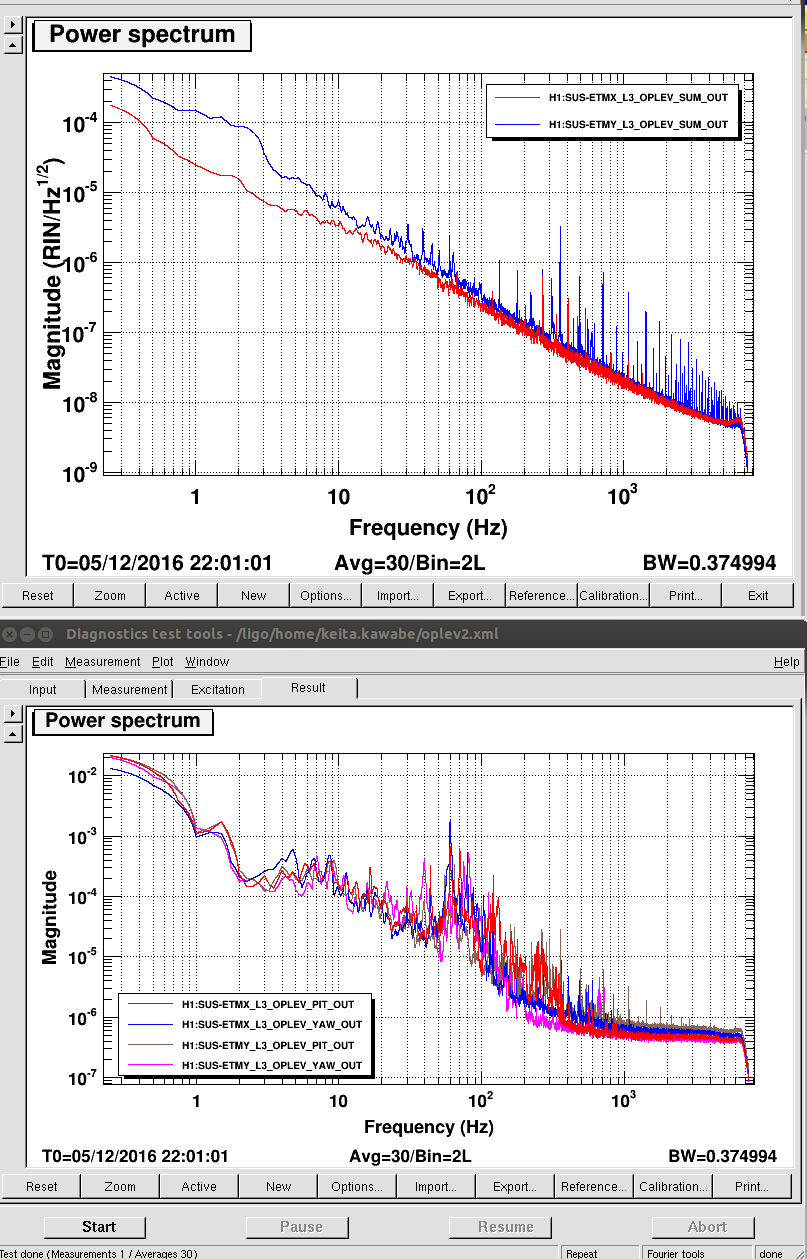
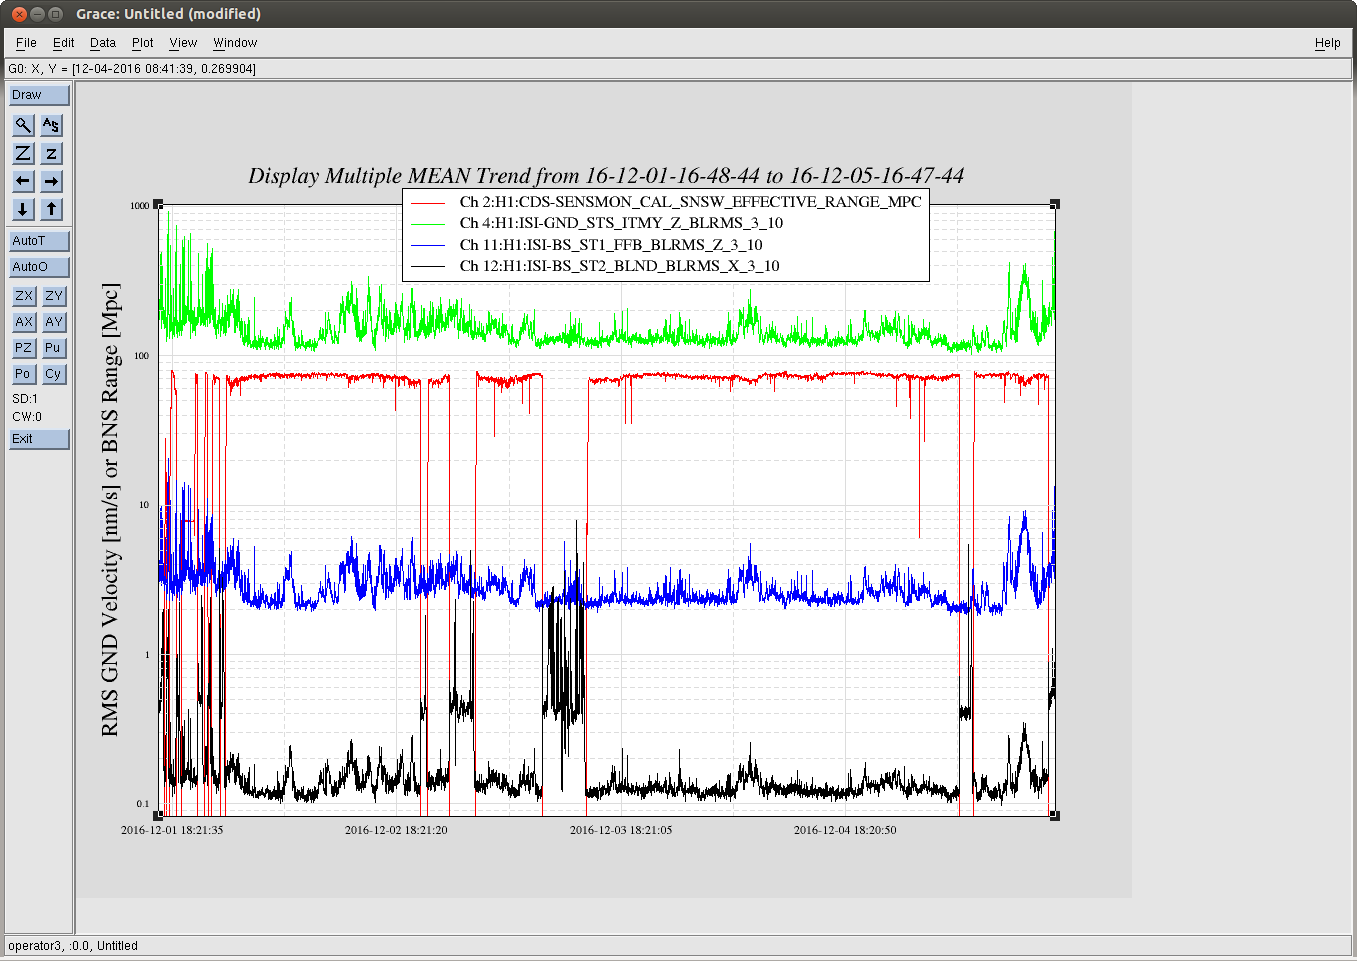
DC level is about the same but ETMX has an effective zp(16,160) whitening relative to Y. Look at RIN (second attachment) and PIT and YAW signals (third).
Residual power glitch that isn't canceled out by power scaling goes into the oplev PIT, and the effect is worse for ETMX due to this difference because X and Y has the same damping filter with similar gain. For f>300Hz the PIT signal is limited by the electronics noise, so the power glitch at this frequency directly goes to oplev damping without any cancellation.
Inserting zp(160,16) for all EX segments will, for the moment, make EY and EX about the same.