edmond.merilh@LIGO.ORG - posted 10:20, Saturday 17 December 2016 - last comment - 10:24, Saturday 17 December 2016(32668)
PSL is back up
Ed, Jason
The LASER is back up. I'm waiting on a timing error in the FE computer to clear.
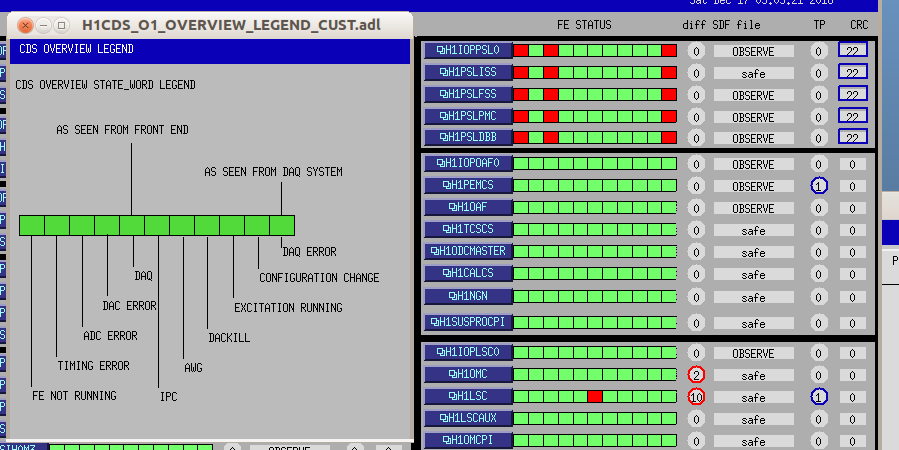
h1ioppsl0 IRIG-B timing has recovered. I've cleared the IPC errors and accumulated CRC counters.
Timing error cleared @ 18:23UTC. Going to the LVEA to check on the statues of the TCS LASERs.