edmond.merilh@LIGO.ORG - posted 09:11, Saturday 17 December 2016 - last comment - 10:13, Saturday 17 December 2016(32660)
All PSL FEs are crashed
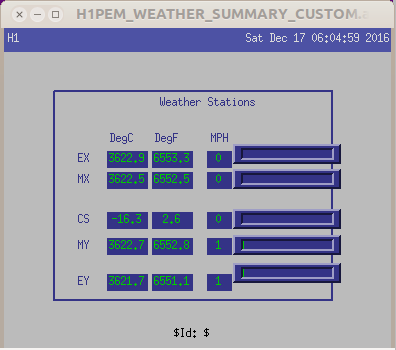
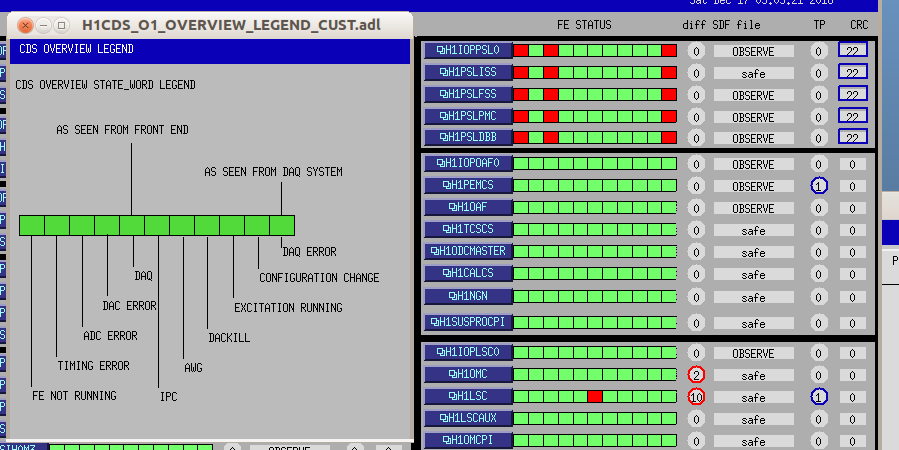
Seems like this is the bogger issue at the moment. I noticed this after the Verbal Alarm about the TCS issue. The LASERs are still showing power. I have no QUAD FOM view. THe attached screenshot shows the current CDS FE status.
Images attached to this report
Comments related to this report
Actually all the front-end models are on a single computer.  Either the power for the I/O chassis has tripped, or the communications was dropped for a few cycles. If you reboot the PSL front-end computer (h1psl0), that would fix the latter.  If that fails, you need to power down the PSL front-end computer, then power-cycle the I/O chassis (resetting DC power supply if needed), then booting the PSL front-end computer.
   If that fails, then we need more investigation.
I have Jim Batch on the phone to troubleshoot
The IOP chassis was not visible from the computer, so I remotely removed the h1psl0 computer from the dolphin network and powered down the computer.  Ed power cycled the I/O chassis and powered the computer back on.  The cards in the I/O chassis are now visible.  Timing on the h1ioppsl0 model has gone "negative", meaning the DAQ data is bad until it works it's way back positive. But the PSL computer show be able to control the PSL OK.

There is no known cause for this event.
trending h1ioppsl0's state_word shows that at 08:44 PST the FE and ADC bits faulted. It looks like a timing issue which glitched the IOP into a non-recoverable state.
IRIG-B is still in a slow recovery, DAQ data will be invalid until it completes.